Tag

Affordability

Browsing


NAHB recently released its 2026 Priced-Out Analysis, highlighting the housing affordability challenge. While previous posts discussed the impacts of rising home prices and interest rates on affordability, this post focuses on the related U.S. housing affordability pyramid. The pyramid reveals that 52% of households (70 million) cannot afford a $300,000 home, while the estimated median price of a new home is around $410,000 in 2026.

The housing affordability pyramid illustrates the number of households able to purchase a home at various price steps. Each step represents the number of households that can only afford homes within that specific price range. The largest share of households falls within the first step, where homes are priced under $200,000. As home prices increase, fewer and fewer households can afford the next price level, with the highest-priced homes, those over $2.5 million, having the smallest number of potential buyers. Housing affordability remains a critical challenge for households with income at the lower end of the spectrum.

The pyramid is based on income thresholds and underwriting standards. Under these assumptions, the minimum income required to purchase a $200,000 home at the mortgage rate of 6% is $55,500. In 2026, about 47.5 million households in the U.S. are estimated to have incomes no more than that threshold and, therefore, can only afford to buy homes priced up to $200,000. These 47.5 million households form the bottom step of the pyramid. Of the remaining households that can afford a home priced at $200,000, 22.4 million can only afford to pay a top price of somewhere between $200,000 and $300,000. These households make up the second step on the pyramid. Each subsequent step narrows further, reflecting the shrinking number of households that can afford increasingly expensive homes.

It is worthwhile to compare the number of households that can afford homes at various price levels and the number of owner-occupied homes available in those ranges, as shown in Figure 2. For example, while around 47.5 million households can afford a home priced at $200,000 or less, there are only 20.7 million owner-occupied homes valued in this price range. This trend continues in the $200,000 $300,000 price range, where the number of households that can afford homes is much higher than the number of housing units in that range. These imbalances reflect the ongoing challenges of housing affordability.


This article was originally published by a eyeonhousing.org . Read the Original article here. .
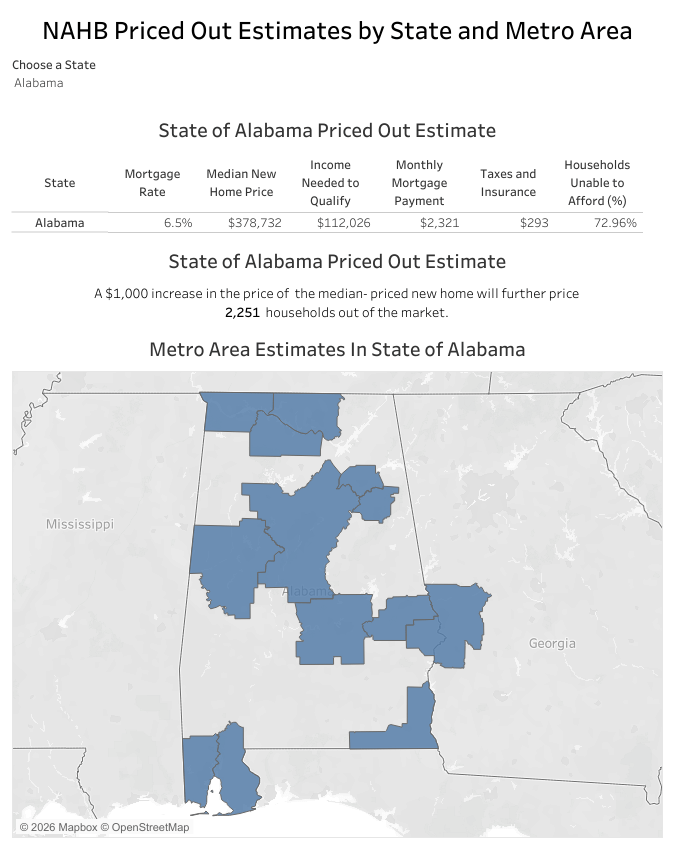

The NAHB 2026 priced-out estimates show that the housing affordability challenge is widespread across the country. In 39 states and the District of Columbia, over 65% of households are priced out of the median-priced new home market. This indicates a significant disconnect between higher new home prices, elevated mortgage rates, and household incomes.

New Hampshire stands out as the state with the highest share of households (83.4%) unable to afford the state’s median new home price of $677,982. High-cost states such as Hawaii and Maine follow closely, with 83% and 82.7% of households, respectively, struggling to afford new homes.

Even in states with relatively lower median new home prices, affordability remains a major concern. For example, in Mississippi, where the median home price is $266,837, 61.1% of households still find these new homes out of reach. Meanwhile, Delaware, the state with better affordability in the analysis, has a median new home price of $373,666, and even there, around 56% of households still struggle to afford a new home. Even modest price increases, such as an additional $1,000, could push thousands more households from affording these median priced new homes. For instance, in Texas, such an increase could price out over 14,365 households.

Affordability patterns also vary significantly across metropolitan areas. In high-cost areas like the San Jose-Sunnyvale-Santa Clara, CA metro area, where new homes largely target high-income Silicon Valley residents, only 14% of all households meet the minimum income threshold of $407,659 required to qualify for a loan on a median-priced new home. In contrast, in more affordable metro areas like Rome, GA, where the median new home price is $107,567, more than three-quarters of households can afford a median-priced new home. While higher home prices generally result in higher monthly mortgage payments and higher income thresholds, the relationship between home prices and affordability is not always linear. Factors like property taxes and insurance payments can also significantly impact monthly housing costs, adding complexity to affordability calculations.

The affordability of new homes, together with the population size of a metro area, significantly influences the priced-out impact of a $1,000 increase in new home prices. In metro areas where new homes are already unaffordable to most households, the effect of such an increase tends to be small. For instance, in the San Jose-Sunnyvale-Santa Clara, CA metro area, an additional $1,000 increase to the home price affects only 273 households, as only 14% of all households could afford such expensive new homes in the first place. Here, the additional price increase only affects a narrow share of high-income households at the upper end of the income distribution, where affordability is already stretched.

In contrast, metro areas, where new homes are more broadly affordable, experience a larger priced-out effect. A $1,000 increase in the median new home price affects a larger share of households in the “thicker part” of the income distribution. For example, in the New York-Newark-Jersey City, NY-NJ Metro Area metro area, a $1,000 increase in new home price would disqualify 4,028 households from affording a median-priced new home. This is the largest priced-out effect among all metro areas, driven by a substantial population base.

Detailed priced-out estimates for every state and more than 300 metro areas are available in the interactive dashboard below.


This article was originally published by a eyeonhousing.org . Read the Original article here. .
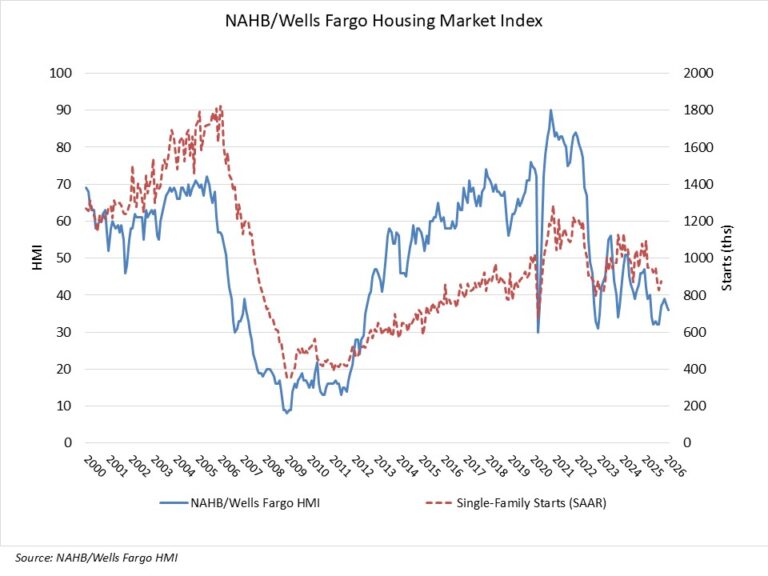

Builder confidence in the market for newly built single-family homes fell one point to 36 in February, according to the National Association of Home Builders (NAHB)/Wells Fargo Housing Market Index (HMI).

Persistent affordability challenges, including high housing price-to-income ratios and elevated land and construction costs, helped push builder confidence lower for the second straight month to start the year.

Housing affordability remains an ongoing challenge at the start of 2026. The solution for the housing market is the enactment of policies that will bend the construction cost curve and enable additional supply of attainable housing. On the positive side, easing inflation should continue to allow lower interest rates for mortgages and builder loans.

The latest HMI survey also revealed that 36% of builders cut prices in February, down from 40% in January. While this marks the lowest incidence of price-cutting since last May (34%), the average price reduction remains at 6%. The use of sales incentives was 65% in February, unchanged from January, and marking the 11th consecutive month this share has exceeded 60%.

While the majority of builders continue to deploy buyer incentives, including price cuts, many prospective buyers remain on the sidelines. Although demand for new construction has weakened, remodeling demand has remained solid given a lack of household mobility, per comments from builders in the HMI.

Derived from a monthly survey that NAHB has been conducting for more than 40 years, the NAHB/Wells Fargo HMI gauges builder perceptions of current single-family home sales and sales expectations for the next six months as “good,” “fair” or “poor.” The survey also asks builders to rate traffic of prospective buyers as “high to very high,” “average” or “low to very low.” Scores for each component are then used to calculate a seasonally adjusted index where any number over 50 indicates that more builders view conditions as good than poor.

The HMI index gauging current sales conditions held steady at 41 from January to February, the index measuring future sales fell three points to 46 and the gauge charting traffic of prospective buyers fell two points to 22.

Looking at the three-month moving averages for regional HMI scores, the Northeast fell one point to 43, the Midwest held steady at 43, the South dropped one point to 35 and the West fell two points to 33. HMI tables can be found at nahb.org/hmi.

Editor’s Note: With the official 2026 release schedule for the Survey of Construction still unavailable from the U.S. Census Bureau, NAHB confirms the HMI for March 2026 will be released on March 16.  A schedule for the rest of the year will be available as soon as possible.


This article was originally published by a eyeonhousing.org . Read the Original article here. .

As housing affordability remains a critical challenge across the country, mortgage rates continue to play a central role in shaping homebuying power. Mortgage rates stayed elevated throughout 2023 and early 2024. Recent data, however, shows a modest decline in mortgage rates. Even slight declines can have a significant impact on housing affordability, pricing more households back into the market. New NAHB Priced-Out Estimates show how home price increases affect housing affordability in 2025. This post presents details regarding how interest rates affect the number of households that can afford a median priced new home.

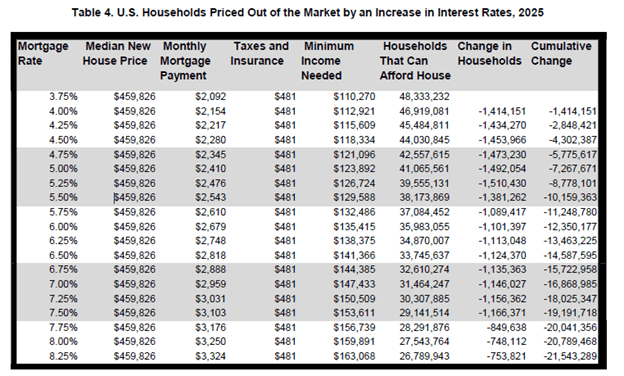
At the beginning of 2025, with the average 30-year fixed mortgage rate at 7%, around 31.5 million households could afford a median-priced home at $459,826. This requires a household income of $147,433 by the front-end underwriting standards[1]. In contrast, if the average mortgage rates had remained at the recent peak of 7.62% in October 2023, only 28.7 million households would have qualified. This 62-basis point decline has effectively priced 2.8 million additional households into the market, expanding homeownership opportunities.

The table below shows how affordability changes with each 25 basis-point increase in interest rates, from 3.75% to 8.25% for a median-priced home at $459,826. The minimum required income with a 3.75% mortgage rate is $110,270. In contrast, a mortgage rate of 8.25%, increases the required income to $163,068, pushing millions of households out of the market.

As rates climb higher, the priced-out effect diminishes. When interest rates increase from 6.5% to 6.75%, around 1.13 million households are priced out of the market, unable to meet the higher income threshold required to afford the increased monthly payments. However, an increase from 7.75% to 8% would squeeze about 850,000 households out of the market.

This exemplifies that when interest rates are relatively low, a 25 basis-point increase has a much larger impact. It is because it affects a broader portion of households in the middle of the income distribution. For example, if the mortgage interest rate decreases from 5.25% to 5%, around 1.5 million more households will qualify the mortgage for the new homes at the median price of $459,826. This indicates lower interest rates can unlock homeownership opportunities for a substantial number of households.

[1] . The sum of monthly payment, including the principal amount, loan interest, property tax, homeowners’ property and private mortgage insurance premiums (PITI), is no more than 28 percent of monthly gross household income.


This article was originally published by a eyeonhousing.org . Read the Original article here. .
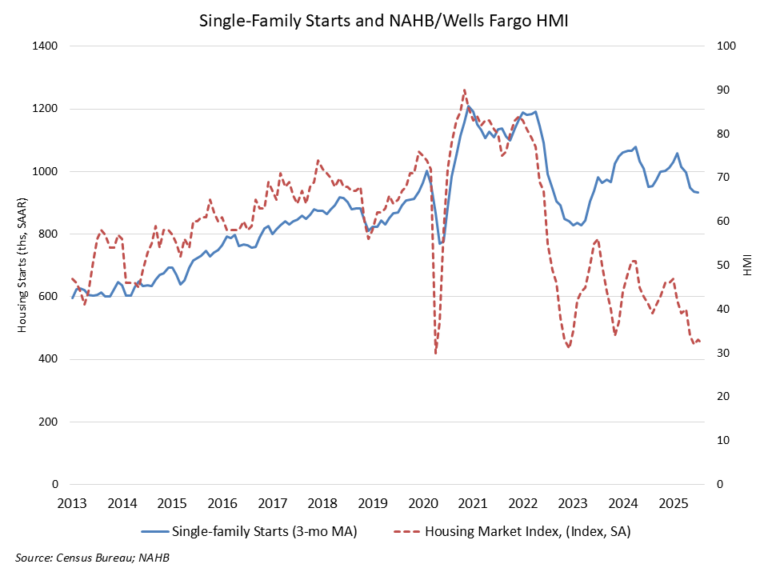

Single-family housing starts posted a modest gain in July as builders continue to contend with challenging housing affordability conditions and a host of supply-side headwinds, including labor shortages, elevated construction costs and inefficient regulatory costs.

Led by solid multifamily production, overall housing starts increased 5.2% in July to a seasonally adjusted annual rate of 1.43 million units, according to a report from the U.S. Department of Housing and Urban Development and the U.S. Census Bureau.

The July reading of 1.43 million starts is the number of housing units builders would begin if development kept this pace for the next 12 months. Within this overall number, single-family starts increased 2.8% to a 939,000 seasonally adjusted annual rate and are down 4.2% on a year-to-date basis. The multifamily sector, which includes apartment buildings and condos, increased 9.9% to an annualized 489,000 pace.

The slowdown in single-family home building has narrowed the home building pipeline. There are currently 621,000 single-family homes under construction, down 1% in July and 3.7% lower than a year ago. This is the lowest level since early 2021 as builders pull back on supply.

On a regional and year-to-date basis, combined single-family and multifamily starts were 10.2% higher in the Northeast, 17.7% higher in the Midwest, 2.4% lower in the South and 0.5% lower in the West.

Overall permits decreased 2.8% to a 1.35-million-unit annualized rate in July. Single-family permits increased 0.5% to an 870,000-unit rate and are down 5.8% on a year-to-date basis. Multifamily permits decreased 8.2% to a 484,000 pace.

Looking at regional permit data on a year-to-date basis, permits were 16.6% lower in the Northeast, 9.1% higher in the Midwest, 3.4% lower in the South and 5.1% lower in the West.

Discover more from Eye On Housing

Subscribe to get the latest posts sent to your email.


This article was originally published by a eyeonhousing.org . Read the Original article here. .
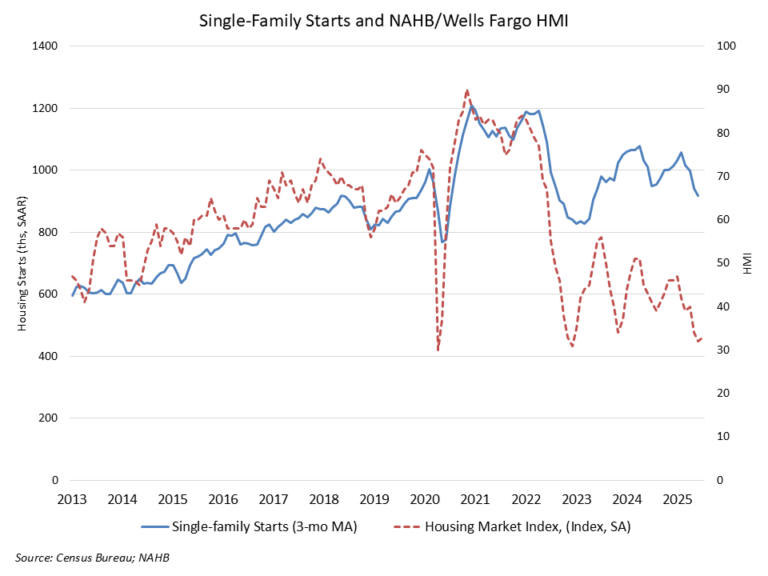

Single-family housing starts declined in June to the lowest rate since July 2024 as elevated interest rates, rising inventories and ongoing supply-side issues continue to act as headwinds for the housing sector.

Due to a solid increase in multifamily production, overall housing starts increased 4.6% in June to a seasonally adjusted annual rate of 1.32 million units, according to a report from the U.S. Department of Housing and Urban Development and the U.S. Census Bureau.

The June reading of 1.32 million starts is the number of housing units builders would begin if development kept this pace for the next 12 months. Within this overall number, single-family starts decreased 4.6% to an 883,000 seasonally adjusted annual rate and are down 10% compared to June 2024. The multifamily sector, which includes apartment buildings and condos, increased 30% to an annualized 438,000 pace.

Single-family building conditions continued to weaken in June as housing affordability challenges caused builder traffic to move lower as buyers moved to the sidelines. Rising levels of resale inventory are also a headwind for the industry.

Single-family home building in the South is down 12.4% on a year-to-date basis, far outpacing declines in the Northeast and the West. However, single-family home building is up 10% on a year-to-date basis in the Midwest, where housing affordability conditions are generally better than much of the nation.

On a regional and year-to-date basis, combined single-family and multifamily starts were 28.8% higher in the Northeast, 13.1% higher in the Midwest, 8.1% lower in the South and 0.6% lower in the West.

Overall permits increased 0.2% to a 1.40-million-unit annualized rate in June. Single-family permits decreased 3.7% to an 866,000-unit rate and are down 8.4% compared to June 2024. Multifamily permits increased 7.3% to a 531,000 pace.

Looking at regional permit data on a year-to-date basis, permits were 16.9% lower in the Northeast, 8.2% higher in the Midwest, 3.3% lower in the South and 3.7% lower in the West.

The declines for single-family home building have caused the number of single-family homes under construction to level off. There are currently 622,000 single-family homes under construction, which is 6% lower than a year ago. The number of apartments under construction in June, 739,000, is 18.8% lower than a year ago.

Discover more from Eye On Housing

Subscribe to get the latest posts sent to your email.


This article was originally published by a eyeonhousing.org . Read the Original article here. .
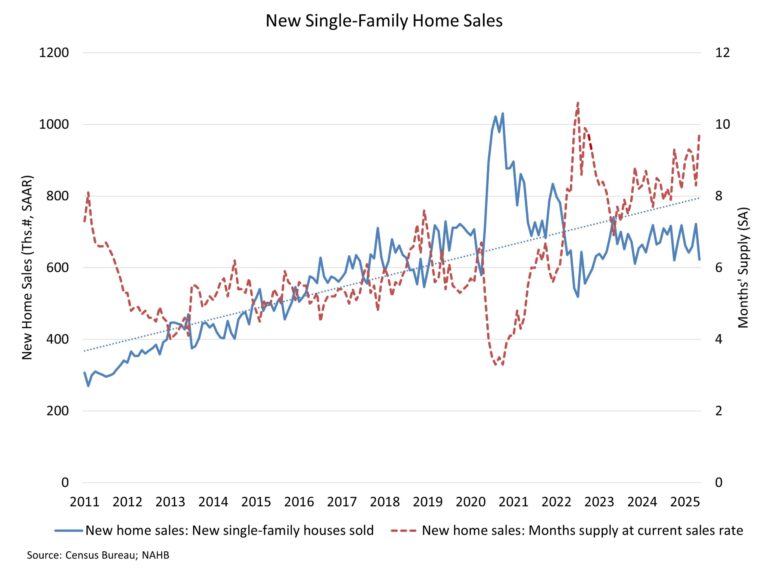

Elevated interest rates and economic uncertainty sent more home buyers to the sidelines in May as housing affordability conditions remain challenging.

Sales of newly built single-family homes declined 13.7% in May, falling back to a seasonally adjusted annual rate of 623,000 according to newly released data from the U.S. Department of Housing and Urban Development and the U.S. Census Bureau. This was the slowest pace since October of last year, as mortgage rates averaged 6.83% in May. Sales were particularly slow in the South, with the pace of sales down 21% in May.

The slowing of the housing market has occurred despite the growing use of of builder sales incentives, including 37% of home builders reporting cutting prices in the June NAHB/Wells Fargo Housing Market Index survey.

On a year-to-date basis, new home sales are 3.2% lower thus far in 2025. As a result of slowing home sales conditions, inventory continues to rise, marking an elevated 9.8 months’ supply in May.

As estimated by NAHB, total months’ supply, defined as a combination of current new and resale single-family inventory, now stands at 5.2. This is the highest sales-adjusted inventory level since 2015 and will place downward pressure on housing construction starts in the months ahead.

A new home sale occurs when a sales contract is signed, or a deposit is accepted. The home can be in any stage of construction: not yet started, under construction or completed. In addition to adjusting for seasonal effects, the May reading of 623,000 units is the number of homes that would sell if this pace continued for the next 12 months.

New single-family home inventory continued to rise with 507,000 residences marketed for sale as of May. This is 1.4% higher than the previous month and 8.1% higher than a year ago. At the current sales pace, the months’ supply for new homes stands at 9.8 compared to 8.5 a year ago. Completed, ready-to-occupy new home inventory stood at 115,000 in May, up 29% compared to a year ago on a non-seasonally adjusted basis. However, this measure was higher at the end of 2024.

The median new home sale price in May was $426,600, compared to $414,300 a year ago. This measure reflects the fact that higher income borrowers face fewer budget constraints than lower income prospective home buyers. New home sales priced below $500,000 were down 15% in May of 2025 compared to the May 2024.

Regionally, on a year-to-date basis, new home sales are down 20.7% in the Northeast, 11.9% in the Midwest and 1.8% in the South. Sales are up 2.1% in the West.

Discover more from Eye On Housing

Subscribe to get the latest posts sent to your email.


This article was originally published by a eyeonhousing.org . Read the Original article here. .


Despite solid income gains and lower home prices, Americans still continue to face major housing affordability challenges, according to the latest data from the National Association of Home Builders (NAHB)/Wells Fargo Cost of Housing Index (CHI). The CHI results from the first quarter of 2025 show that a family earning the nation’s median income of $104,200 needed 36% of its income to cover the mortgage payment on a median-priced new home. Low-income families, defined as those earning only 50% of median income, would have to spend 72% of their earnings to pay for the same new home.

The figures track closely for the purchase of existing homes in the U.S. as well. A typical family would have to pay 35% of their income for a median-priced existing home while a low-income family would need to pay 70% of their earnings to make the same mortgage payment.

The percentage of a family’s income needed to purchase a new home fell from 38% in Q4 2024 to 36% in Q1 2025, as a result of a 6.5% rise in median family income and a 1% decline in the median price of a new home. The low-income CHI also fell from 76% to 72% over the same period.

Affordability of existing homes also edged higher for both median- and low-income families between Q4 2024 and Q1 2025. The CHI indices were 35% and 70% in the first quarter vs 37% and 74%, respectively, in the fourth quarter.  The uptick was due to the increase in median income and a 2% drop in median existing home prices.

The U.S. data for the percentage of earnings needed to purchase a new home in Q1 2025 is based on a national median new home price of $416,900 and median income of $104,200. The first quarter median new home price is down slightly from $419,200 in the fourth quarter. The corresponding price for an existing home in the first quarter is $402,300, down from the $410,100 in the previous quarter. The average 30-year mortgage rate increased from 6.72% in Q4 2024 to 6.91% in Q1 2025.

CHI is also available for 175 metropolitan areas, calculating the percentage of a family’s income needed to make the mortgage payment on an existing home based on the local median home price and median income in those markets.

In nine out of 175 markets in Q1 2025, the typical family is severely cost-burdened (must pay more than 50% of their income on a median-priced existing home). In 75 other markets, such families are cost-burdened (need to pay between 31% and 50%). There are 91 markets where the CHI is 30% of earnings or lower.

The Top 5 Severely Cost-Burdened Markets

San Jose-Sunnyvale-Santa Clara, Calif., was the most severely cost-burdened market on the CHI, where 88% of a typical family’s income is needed to make a mortgage payment on an existing home. This was followed by:

Urban Honolulu, Hawaii (74%)

San Diego-Chula Vista-Carlsbad, Calif. (68%)

Naples-Marco Island, Fla. (66%)

San Francisco-Oakland-Fremont, Calif. (64%)

Low-income families would have to pay between 128% and 176% of their income in all five of the above markets to cover a mortgage.

The Top 5 Least Cost-Burdened Markets

By contrast, Elmira, N.Y., was the least cost-burdened markets on the CHI, where typical families needed to spend just 15% of their income to pay for a mortgage on an existing home. Rounding out the least burdened markets are:

Decatur, Ill. (16%)

Peoria, Ill. (16%)

Springfield, Ill. (16%)

Davenport-Moline-Rock Island, Iowa-Ill. (17%)

Low-income families in these markets would have to pay between 31% and 35% of their income to cover the mortgage payment for a median-priced existing home.

Visit nahb.org/chi for tables and details.

Discover more from Eye On Housing

Subscribe to get the latest posts sent to your email.


This article was originally published by a eyeonhousing.org . Read the Original article here. .
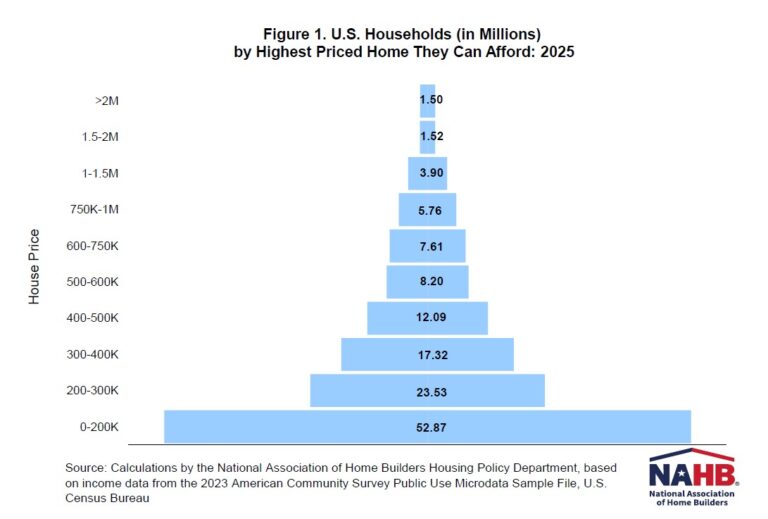

NAHB recently released its 2025 Priced-Out Analysis, highlighting the housing affordability challenge. While previous posts discussed the impacts of rising home prices and interest rates on affordability, this post focuses on the related U.S. housing affordability pyramid. The pyramid reveals that 70% of households (94 million) cannot afford a $400,000 home, while the estimated median price of a new home is around $460,000 in 2025.

The housing affordability pyramid illustrates the number of households able to purchase a home at various price steps. Each step represents the number of households that can only afford homes within that specific price range. The largest share of households falls within the first step, where homes are priced under $200,000. As home prices increase, fewer and fewer households can afford the next price level, with the highest-priced homes—those over $2 million—having the smallest number of potential buyers. Housing affordability remains a critical challenge for households with income at the lower end of the spectrum.

The pyramid is based on income thresholds and underwriting standards. Under these assumptions, the minimum income required to purchase a $200,000 home at the mortgage rate of 6.5% is $61,487. In 2025, about 52.87 million households in the U.S. are estimated to have incomes no more than that threshold and, therefore, can only afford to buy homes priced up to $200,000. These 52.87 million households form the bottom step of the pyramid. Of the remaining households who can afford a home priced at $200,000, 23.53 million can only afford to pay a top price of somewhere between $200,000 and $300,000. These households make up the second step on the pyramid. Each subsequent step narrows further, reflecting the shrinking number of households that can afford increasingly expensive homes.

It is worthwhile to compare the number of households that can afford homes at various price levels and the number of owner-occupied homes available in those ranges (excludes homes built-for-rent), as shown in Figure 2. For example, while around 53 million households can afford a home priced at $200,000 or less, there are only 22 million owner-occupied homes valued in this price range. This trend continues in the $200,000 to $300,000 price range, where the number of households that can afford homes is much higher than the number of housing units in that range. These imbalances show a shortage of affordable housing.

Discover more from Eye On Housing

Subscribe to get the latest posts sent to your email.


This article was originally published by a eyeonhousing.org . Read the Original article here. .

As housing affordability remains a critical challenge across the country, mortgage rates continue to play a central role in shaping homebuying power. Mortgage rates stayed elevated throughout 2023 and early 2024. Recent data, however, shows a modest decline in mortgage rates. Even slight declines can have a significant impact on housing affordability, pricing more households back into the market. New NAHB Priced-Out Estimates show how home price increases affect housing affordability in 2025. This post presents details regarding how interest rates affect the number of households that can afford a median priced new home.

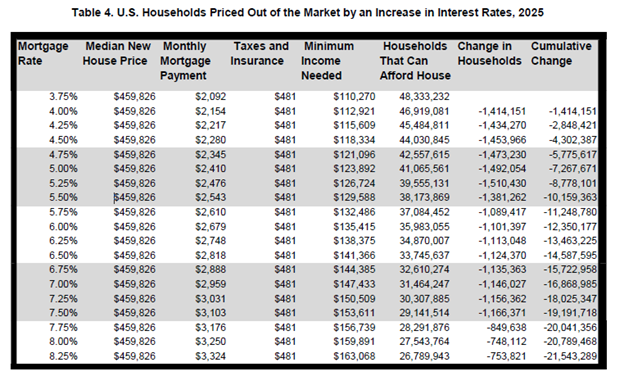
At the beginning of 2025, with the average 30-year fixed mortgage rate at 7%, around 31.5 million households could afford a median-priced home at $459,826. This requires a household income of $147,433 by the front-end underwriting standards[1]. In contrast, if the average mortgage rates had remained at the recent peak of 7.62% in October 2023, only 28.7 million households would have qualified. This 62-basis point decline has effectively priced 2.8 million additional households into the market, expanding homeownership opportunities.

The table below shows how affordability changes with each 25 basis-point increase in interest rates, from 3.75% to 8.25% for a median-priced home at $459,826. The minimum required income with a 3.75% mortgage rate is $110,270. In contrast, a mortgage rate of 8.25%, increases the required income to $163,068, pushing millions of households out of the market.

As rates climb higher, the priced-out effect diminishes. When interest rates increase from 6.5% to 6.75%, around 1.13 million households are priced out of the market, unable to meet the higher income threshold required to afford the increased monthly payments. However, an increase from 7.75% to 8% would squeeze about 850,000 households out of the market.

This exemplifies that when interest rates are relatively low, a 25 basis-point increase has a much larger impact. It is because it affects a broader portion of households in the middle of the income distribution. For example, if the mortgage interest rate decreases from 5.25% to 5%, around 1.5 million more households will qualify the mortgage for the new homes at the median price of $459,826. This indicates lower interest rates can unlock homeownership opportunities for a substantial number of households.

[1] . The sum of monthly payment, including the principal amount, loan interest, property tax, homeowners’ property and private mortgage insurance premiums (PITI), is no more than 28 percent of monthly gross household income.

Discover more from Eye On Housing

Subscribe to get the latest posts sent to your email.


This article was originally published by a eyeonhousing.org . Read the Original article here. .

Pin It