Tag

Affordability

Browsing


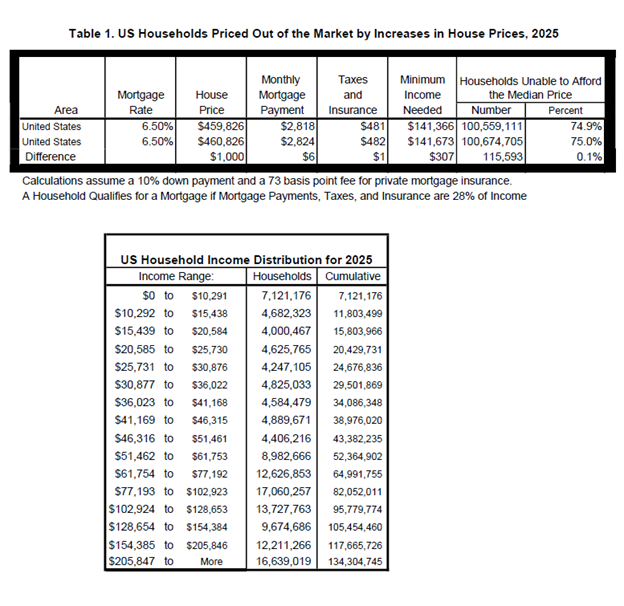
Housing affordability remains a critical issue, with 74.9% of U.S. households unable to afford a median-priced new home in 2025, according to NAHB’s latest analysis. With a median price of $459,826 and a 30-year mortgage rate of 6.5%, this translates to around 100.6 million households priced out of the market, even before accounting for further increases in home prices or interest rates. A $1,000 increase in the median price of new homes would price an additional 115,593 households out of the market.

The 2024 priced-out estimates for all states and the District of Columbia and over 300 metropolitan statistical areas are shown in the interactive map below. It highlights the growing housing affordability challenges across the United States. In 23 states and the District of Columbia, over 80% of households are priced out of the median-priced new home market. This indicates a significant disconnect between rising home prices and household incomes.

Maine stands out as the state with the highest share of households (91.2%) unable to afford the state’s median new home price of $682,223. High-cost states such as Connecticut and Rhode Island follow closely, with 88.3% and 87.8% of households, respectively, struggling to afford new homes. Even in states with relatively lower median new home prices, affordability remains a major concern. For example, in Mississippi, where the median home price is $275,333, 70.2% of households still find these new homes out of reach. Meanwhile, Delaware, the state with better affordability in the analysis, has a median new home price of $373,666. However, around 58.2% of households in Delaware still struggle to afford a new home. Even modest price increases, such as an additional $1,000, could push thousands more households from affording these median priced new homes. For instance, in Texas, such an increase could price out over 11,000 households.

It also shows the 2025 priced-out estimates for over 300 metropolitan statistical areas. The analysis estimates how many households in each metro area earn enough income to qualify for mortgages on median-priced new homes. In high-cost areas like the San Jose-Sunnyvale-Santa Clara, CA metro area, where new homes largely target high-income Silicon Valley residents, only 10% of all households meet the minimum income threshold of $437,963 required to qualify for a loan on a median priced new home. In contrast, in more affordable metro areas like Sierra Vista-Douglas, AZ, where the median new home price is $150,893, nearly two-thirds of households can afford a median priced new home. While higher home prices generally result in higher monthly mortgage payments and higher income thresholds, the relationship between home prices and affordability is not always linear. Factors like property taxes and insurance payments can also significantly impact monthly housing costs, adding complexity to affordability calculations.

The affordability of new homes together with the population size of a metro area, significantly influence the priced-out impact of a $1,000 increase in new home prices. In metro areas where new homes are already unaffordable to most households, the effect of such an increase tends to be small. For instance, in the San Jose-Sunnyvale-Santa Clara, CA metro area, an additional $1,000 increase to the home price affects only 259 households, as only 10% of all households could afford such expensive new homes in the first place. Here, the additional price increase only affects a narrow share of high-income households at the upper end of the income distribution, where affordability is already stretched.

In contrast, metro areas, where new homes are more broadly affordable, experience a larger priced-out effect. A $1,000 increase in the median new home price affects a larger share of households in the “thicker part” of the income distribution. For example, in the Dallas-Fort Worth-Arlington, TX metro area, a $1,000 increase in new home price would disqualify 2,882 households from affording a median-priced new home. This is the largest priced-out effect among all metro areas, driven by the combination of relatively moderate home prices and a substantial population base.

More details, including priced-out estimates for every state and over 300 metropolitan areas, and a description of the underlying methodology, are available in the full study.

Discover more from Eye On Housing

Subscribe to get the latest posts sent to your email.


This article was originally published by a eyeonhousing.org . Read the Original article here. .

With inflation gradually easing and builders anticipating mortgage rates will moderate in coming months, builder sentiment moved higher for a second consecutive month despite challenging affordability conditions.

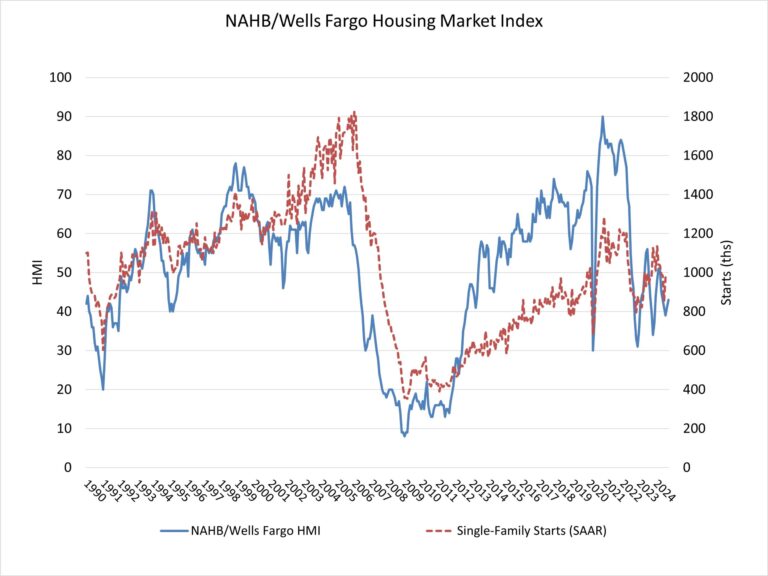
Builder confidence in the market for newly built single-family homes was 43 in October, up two points from a reading of 41 in September, according to the National Association of Home Builders (NAHB)/Wells Fargo Housing Market Index (HMI).

Despite the beginning of the Fed’s easing cycle, many prospective home buyers remain on the sideline waiting for lower interest rates. We are forecasting uneven declines for mortgage interest rates in the coming quarters, which will improve housing demand but place stress on building lot supplies due to tight lending conditions for development and construction loans. However, while housing affordability remains low, builders are feeling more optimistic about 2025 market conditions. A wildcard for the outlook remains the election.

The latest HMI survey also revealed that the share of builders cutting prices held steady at 32% in October, the same rate as last month. Meanwhile, the average price reduction returned to the long-term trend of 6% after dropping to 5% in September. The use of sales incentives was 62% in October, slightly up from 61% in September.

Derived from a monthly survey that NAHB has been conducting for more than 35 years, the NAHB/Wells Fargo HMI gauges builder perceptions of current single-family home sales and sales expectations for the next six months as “good,” “fair” or “poor.” The survey also asks builders to rate traffic of prospective buyers as “high to very high,” “average” or “low to very low.” Scores for each component are then used to calculate a seasonally adjusted index where any number over 50 indicates that more builders view conditions as good than poor.

All three HMI indices were up in October. The index charting current sales conditions rose two points to 47, the component measuring sales expectations in the next six months increased four points to 57 and the gauge charting traffic of prospective buyers posted a two-point gain to 29.

Looking at the three-month moving averages for regional HMI scores, the Northeast increased two points to 51, the Midwest moved two points higher to 41, the South held steady at 41 and the West increased three points to 41. The HMI tables can be found at nahb.org/hmi.

Discover more from Eye On Housing

Subscribe to get the latest posts sent to your email.


This article was originally published by a eyeonhousing.org . Read the Original article here. .


With mortgage rates declining by more than one-half of a percentage point from early August through mid-September, per Freddie Mac, builder sentiment edged higher this month even as builders continue to grapple with rising costs.

Builder confidence in the market for newly built single-family homes was 41 in September, up two points from a reading of 39 in August, according to the National Association of Home Builders (NAHB)/Wells Fargo Housing Market Index (HMI). This breaks a string of four consecutive monthly declines.

Due to lower interest rates, builders now have a positive view for future new home sales for the first time since May 2024. However, builders will face competition from rising existing home inventory in many markets as the mortgage rate lock-in effect softens with lower rates.

With inflation moderating, the Federal Reserve is expected to begin a cycle of monetary policy easing this week, which will produce downward pressure on mortgage interest rates and also lower the interest rates on land development and home construction business loans. Lowering the cost of construction is critical to confront persistent challenges for housing affordability.

The latest HMI survey also revealed that the share of builders cutting prices dropped in September for the first time since April, down one point to 32%. Moreover, the average price reduction was 5%, the first time it has been below 6% since July 2022. Meanwhile, the use of sales incentives fell to 61% in September, down from 64% in August.

Derived from a monthly survey that NAHB has been conducting for more than 35 years, the NAHB/Wells Fargo HMI gauges builder perceptions of current single-family home sales and sales expectations for the next six months as “good,” “fair” or “poor.” The survey also asks builders to rate traffic of prospective buyers as “high to very high,” “average” or “low to very low.” Scores for each component are then used to calculate a seasonally adjusted index where any number over 50 indicates that more builders view conditions as good than poor.

All three HMI indices were up in September. The index charting current sales conditions rose one point to 45, the component measuring sales expectations in the next six months increased four points to 53 and the gauge charting traffic of prospective buyers posted a two-point gain to 27.

Looking at the three-month moving averages for regional HMI scores, the Northeast fell three points to 49, the Midwest edged one-point higher to 40, the South decreased one point to 41 and the West increased two points to 39.

The HMI tables can be found at nahb.org/hmi.

Discover more from Eye On Housing

Subscribe to get the latest posts sent to your email.


This article was originally published by a eyeonhousing.org . Read the Original article here. .

Pin It