This article was originally published by a www.houzz.com . Read the Original article here. .

This article was originally published by a www.houzz.com . Read the Original article here. .
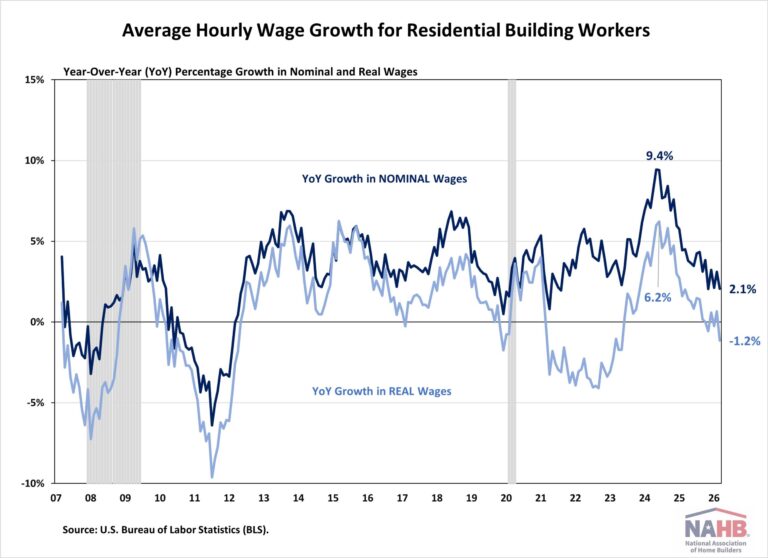
Wage growth for residential building workers remained subdued during the first quarter of 2026, reflecting continued softness in housing construction activity and easing labor demand. According to the latest data from the U.S. Bureau of Labor Statistics, both nominal and inflation-adjusted wage gains moderated further, marking a clear transition from the rapid post-pandemic expansion toward a slower labor market.
In nominal terms, average hourly earnings (AHE) for residential building workers increased 2.1% year-over-year in March 2026, down notably from the 9.4% peak reached in mid-2024 and continuing the broader cooling trend observed throughout 2025.
After accounting for inflation, real wages declined 1.2% year-over-year in March 2026, indicating that wage gains have not fully kept pace with broader price increases. Real wage growth strengthened temporarily during parts of 2024, reaching a peak of 6.2%, but has since softened alongside the slowdown in residential construction activity.
Meanwhile, the number of open, and unfilled construction sector jobs has continued to trend downward, consistent with weaker housing demand and slower construction hiring.
Despite the slowdown in wage growth, residential building workers’ wages remain competitive relative to other industries:
8.4% higher than the manufacturing sector ($36.54 per hour)
22.4% higher than the transportation and warehousing sector ($32.34 per hour)
3.6% lower than the mining and logging sector ($41.10 per hour)
Note:
Data used in this post relates to all employees in the residential building industry. This group includes both new single-family housing construction (excluding for-sale builders) and residential remodelers but does not include specialty trade contractors.
This article was originally published by a eyeonhousing.org . Read the Original article here. .
Business activity softened across the residential construction and design industries at the start of 2026, but professionals are entering the second quarter with measured optimism, according to the Q2 2026 U.S. Houzz Pro Industry Barometer. Construction firms expect modest improvement driven by gains in newly committed projects, while architecture and design firms maintain positive expectations despite sharper declines in recent activity, particularly project inquiries.
The recently released Barometer provides timely insights into the residential renovation market, tracking expectations, project backlogs and recent business activity among construction and architectural and design services firms in the United States.
“After recent activity slowed in the first quarter compared with the end of 2025, construction and design pros are entering Q2 with cautious optimism, particularly in construction, where expectations for new projects are showing early signs of a rebound,” says Marine Sargsyan, head of economic research at Houzz. “At the same time, persistent cost pressures and client hesitation are reshaping how firms compete. We’re seeing pros adapt in real time, with construction firms investing in workforce development and more flexible pricing, while design professionals are doubling down on client experience and branding.”
The U.S. Houzz Pro Industry Barometer tracks expected, current and recent business activity among businesses in the construction sector and the architectural and design services sector. The Q2 2026 Barometer was fielded March 17 through April 6, 2026, and garnered responses from nearly 1,000 home improvement firms on Houzz.
Here’s what construction and design industry professionals are reporting.
Construction Firms
1. Expectations improve modestly. The Expected Business Activity Indicator related to project inquiries and new committed projects increased 3 points to 58 for Q2 2026 (from 55 for Q1 2026). The quarter-over-quarter gain was driven by improved expectations for new committed projects, which rose to 59 (up from 53 for Q1), while project inquiries held steady at 57.
Trends diverge across firm types. Design-build remodelers report a strong rebound, with the indicator increasing 10 points to 66 (from 56 for Q1), supported by gains in both inquiries and newly committed projects. In contrast, build-only remodelers declined 5 points to 50 (from 55 for Q1), reflecting softer expectations across both components.
The indicator is based on survey questions about whether businesses expect the number of project inquiries and new committed projects to increase, decrease or remain unchanged in the coming three months compared with the previous three months.
See how Houzz Pro can help you find customers, manage projects and grow your business
Build-only remodelers report a backlog of 4.6 weeks (down slightly from 4.8 weeks in Q2 2025), while design-build firms report 6.7 weeks, a more pronounced decline from 8.0 weeks last year and the primary driver of the overall contraction.
Although pipelines have shortened across both groups, design-build firms continue to report longer wait times than build-only remodelers. The trend suggests a gradual normalization following elevated backlog levels seen in prior years.
The Project Backlog Indicator is based on survey questions that ask businesses to report wait times (in weeks) to start work on a midsize project. Scores are computed as average wait times without seasonal adjustment.
3. Recent activity declines despite stabilizing inquiries. The Recent Business Activity Indicator fell to 48 in Q1 2026 (from 51 in Q4 2025), indicating that more firms reported declines than reported increases in activity. Project inquiries showed modest improvement, rising 2 points to 51, while new committed projects dropped sharply to 45 (from 52 for Q4), suggesting weaker conversion of demand into signed work.
Results again vary by firm type. Build-only remodelers reported an indicator reading of 50 (down from 59 for Q4), while design-build remodelers improved slightly to 46 (from 43 for Q4), reflecting gains in both inquiries and committed projects despite remaining below the 50-point threshold.
The Recent Business Activity Indicator looks at actual activity over the previous three months. In contrast with the Expected Business Activity and Project Backlog indicators, which look forward in time, the Recent Business Activity Indicator looks back. It’s based on survey questions about whether businesses observed an increase, a decrease or no change in the actual number of project inquiries and new committed projects over the previous three months relative to the three months prior.
Learn about Houzz Pro software
Architectural and Design Firms
1. Expectations remain positive but edge down slightly. The Expected Business Activity Indicator for architectural and design services firms decreased 1 point to 60 for Q2 2026 (from 61 for Q1), reflecting mixed forward-looking momentum.
Expectations for project inquiries declined to 60 (from 62 for Q1), while expectations for new committed projects increased slightly to 61 (from 60 for Q1).
Interior designers report growing optimism, with the indicator rising to 65 (from 61 for Q1), supported by gains across both inquiries and committed projects. Architects, meanwhile, saw expectations decline to 58 (from 61 for Q1), reflecting softer outlooks across both components.
Despite the modest dip, the index remains above the 50-point line, indicating that more firms anticipate improving business conditions than worsening ones.
2. Backlogs drop significantly across the sector. The Project Backlog Indicator declined to 4.0 weeks at the start of Q2 2026, down 1.7 weeks from 5.7 weeks one year earlier, signaling notably shorter pipelines. Architects experienced the largest contraction, with backlogs falling to 4.0 weeks from 6.3 weeks a year ago. Interior designers also reported declines, with wait times easing to 4.0 weeks from 4.8 weeks.
Backlog levels have now converged across both groups, suggesting a continued normalization of project pipelines after extended periods of elevated demand.
3. Recent business activity softens sharply. The Recent Business Activity Indicator declined to 48 in Q1 2026 (from 54 in Q4 2025), driven primarily by a drop in project inquiries.
Inquiry activity fell 9 points to 45, while new committed projects edged down slightly to 52 (from 53 for Q4), highlighting weaker near-term demand signals despite relatively stable project commitments.
Architects reported a more pronounced slowdown, with the indicator dropping to 45 (from 55 for Q4). Interior designers, however, posted modest improvement, rising to 53 (from 50 for Q4), supported by increases in both inquiries and newly committed projects.
Overall, results point to uneven performance across the design sector, with interior designers showing resilience while architects face more significant softening.
This article was originally published by a www.houzz.com . Read the Original article here. .
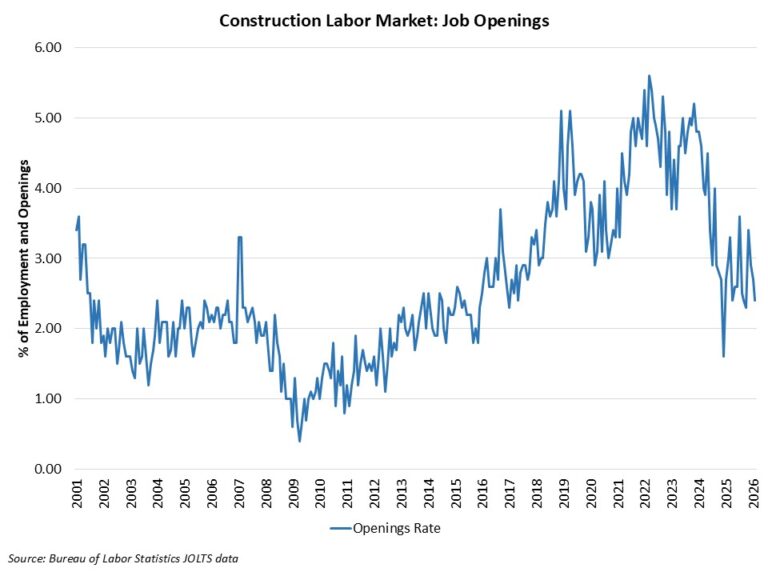
The number of open positions in construction in February was down year-over-year, per the Bureau of Labor Statistics Job Openings and Labor Turnover Survey (JOLTS). The current level of open jobs is down measurably from three years ago due to declines in construction activity, particularly in housing. However, recent gains for nonresidential construction have not fully offset soft conditions for housing with respect to the demand for construction labor.
The number of open jobs for the overall economy declined in February, falling from 7.24 million in January to 6.88 million in February. The February reading was down from a year ago (7.24 million) due to a cooling labor market.
Previous NAHB analysis indicated that this number had to fall below eight million on a sustained basis for the Federal Reserve to move forward on interest rate reductions. With estimates remaining below eight million for national job openings, the Fed, in theory, should be able to cut further.
The number of open construction sector jobs fell, declining slightly from 230,000 in January to 202,000 in February. This total was down compared to a year ago (255,000). The chart below notes the declining trend that has been in place for unfilled construction jobs since the Fed raised the federal funds rate and home building weakened. While home building employment was declining during the second half of 2025, other subsectors of the construction industry have expanded (e.g. data centers). This has produced volatility within a reduced range in the series since 2024.
The construction job openings rate decreased to 2.4% in February, down from the 3% rate estimated a year ago.
The layoff rate in construction declined slightly to 1.8% in February. The quits rate decreased to 1.3% for the month.
The current data looks similar to the much discussed low-hire, low-fire labor market paradigm.
This article was originally published by a eyeonhousing.org . Read the Original article here. .
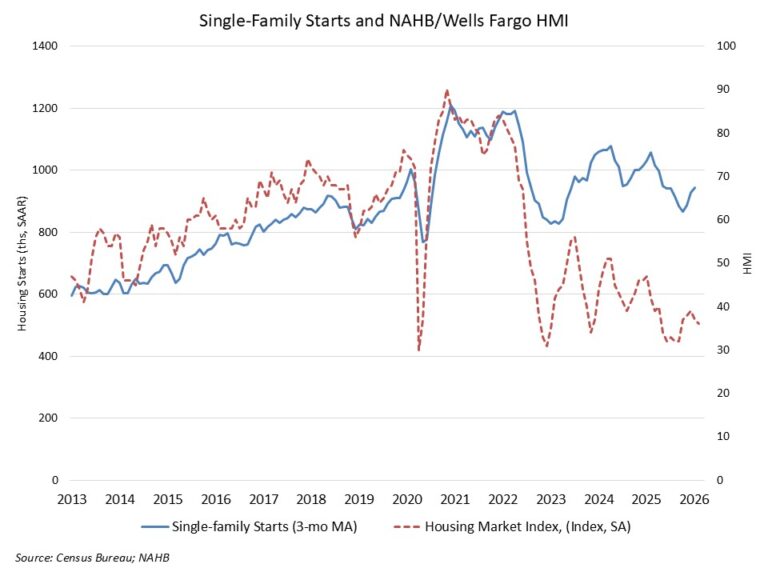
Elevated construction costs and constrained affordability conditions led to a reduction in single-family housing starts in January.
However, led by solid multifamily production, overall housing starts increased 7.2% in January to a seasonally adjusted annual rate of 1.49 million units, according to a report from the U.S. Department of Housing and Urban Development and the U.S. Census Bureau.
The January reading of 1.49 million starts is the number of housing units builders would begin if development kept this pace for the next 12 months.
Within this overall number, single-family starts decreased 2.8% to a 935,000 seasonally adjusted annual rate. Weather effects also likely depressed single-family construction in the Northeast, where single-family starts were down 33% from December 2025 and down more than 6% compared to January 2025 readings.
The multifamily sector, which includes apartment buildings and condos, increased 30% to an annualized 552,000 pace. However, this data may be revised lower in future revisions. Furthermore, prior NAHB analysis of the geography of permit data has shown recent gains for apartment construction occurring in lower density areas, such as exurbs, secondary cities and small towns.
On a regional basis compared to the previous month, combined single-family and multifamily starts were 47.4% higher in the Northeast, 10.8% lower in the Midwest, 11.4% higher in the South and 7.5% lower in the West.
Overall permits decreased 5.4% to a 1.38 million unit annualized rate in January. Single-family permits decreased 0.9% to an 873,000-unit rate, which is the weakest reading since August of last year. This is an indicator of relatively flat construction starts conditions for 2026 amid the ongoing affordability crisis. Multifamily permits decreased 12% to an annualized 503,000 pace.
Looking at regional permit data compared to the previous month, permits were 9.6% lower in the Northeast, 9% higher in the Midwest, 3.5% lower in the South and 15.7% in the West.
The number of single-family homes under construction fell back to 582,000 in January, down 8.8% year over year as the single-family home building market has slowed. Despite recent gains for apartment construction, the number of apartments under construction has fallen back to 686,000 units, a 10% decline from January 2025.
The multiyear trend of a smaller number of units under construction is consistent with builders pulling back construction given higher post-covid construction costs and affordability constraints.
This article was originally published by a eyeonhousing.org . Read the Original article here. .

Single-family permitting softened over the course of 2025 and finished the year weaker than the prior year. After showing some resilience in 2024, permitting activity gradually lost momentum as elevated mortgage rates and ongoing affordability constraints weighed on buyer demand. By year’s end, the pace of single-family permit issuance was below the level recorded in 2024, signaling a pullback in new construction. Multifamily permitting followed a more uneven path during 2025, reflecting the sector’s typical volatility, but ended the year on a stronger footing.
Over the year, the number of single-family permits issued nationwide reached 909,280. On a year-over-year basis, this represents a 7.4 percent decline compared with the December 2024 year-to-date total of 981,834. Multifamily permitting activity was stronger, with 516,886 permits issued nationwide, marking a 5.6 percent increase from the same period last year.
Regionally, year-to-date single-family permitting increased in only one of the four regions through December. The Midwest posted a slight gain of 0.3 percent, while activity declined in the Northeast (down 1.9 percent), the South (down 8.5 percent), and the West (down 10.4 percent). Multifamily permits increased in three of the four regions, led by gains in the West (up 17.6 percent), followed by the Midwest (up 9.8 percent), and then the South (up 4.9 percent). The Northeast saw a sharp decline of 12.4 percent, driven largely by a 21.0 percent drop in the New York–Newark–Jersey City metropolitan area.
At the state level, 16 states recorded year-over-year increases in single-family permits between December 2025 year-to-date and December 2024 year-to-date, with gains ranging from 24.0 percent in the District of Columbia to 0.1 percent in New York. The remaining 34 states reported declines, led by Nevada, which posted the steepest drop at 21.3 percent.
The ten states issuing the highest number of single-family permits accounted for 61.8 percent of all single-family permits issued nationwide. Texas continued to lead the country, with 140,002 permits issued over 2025, although this represented an 11.7 percent decline compared with 2024. Florida, the second-highest state, saw permits fall by 10.3 percent, while North Carolina, ranked third, experienced a decline of 6.9 percent.
Between December 2025 year-to-date and December 2024 year-to-date, 31 states recorded increases in multifamily building permits, while 19 states and the District of Columbia experienced declines. Mississippi posted the largest percentage increase, with multifamily permits surging 195.8 percent, rising from 357 to 1,056 units. In contrast, Maryland recorded the steepest decline, with permits falling 32.7 percent, from 5,797 to 3,902 units.
The ten states issuing the highest number of multifamily permits accounted for 60.5 percent of all multifamily permits issued nationwide. Over the course of 2025, Texas, which issued the most multifamily permits, recorded a modest increase of 1.7 percent. Florida, the second-highest state, posted a stronger gain of 29.6 percent, while California, ranking third, saw multifamily permits rise by 21.6 percent.
At the local level, the following are the ten metropolitan areas with the highest number of single-family permits issued.
Below are the ten metropolitan areas with the highest levels of multifamily permitting activity.
This article was originally published by a eyeonhousing.org . Read the Original article here. .

Single-family built-for-rent construction fell back in the third quarter of 2025, as a higher cost of financing and increased multifamily supply crowded out development.
According to NAHB’s analysis of data from the Census Bureau’s Quarterly Starts and Completions by Purpose and Design, there were approximately 18,000 single-family built-for-rent (SFBFR) starts during the third quarter of 2025. This is down significantly relative to the third quarter of 2024 (24,000 starts). Over the last four quarters, 69,000 such homes began construction, which is a 25% decrease compared to the 92,000 estimated SFBFR starts in the four quarters prior to that period.
The SFBFR market is a source of inventory amid challenges over housing affordability and downpayment requirements in the for-sale market, particularly during a period when a growing number of people want more space and a single-family structure. Single-family built-for-rent construction differs in terms of structural characteristics compared to other newly-built single-family homes, particularly with respect to home size. However, investor demand for single-family homes, both existing and new, has cooled with higher interest rates.
Given the relatively small size of this market segment, the quarter-to-quarter movements typically are not statistically significant. The current four-quarter moving average of market share (7%) is nonetheless higher than the historical average of 2.7% (1992-2012).
Importantly, as measured for this analysis, the estimates noted above include only homes built and held by the builder for rental purposes. The estimates exclude homes that are sold to another party for rental purposes, which NAHB estimates may represent another three to five percent of single-family starts based on industry surveys.
The Census data notes an elevated share of single-family homes built as condos (non-fee simple), with this share averaging more than 4% over recent quarters. Some, but certainly not all, of these homes will be used for rental purposes. Additionally, it is theoretically possible some single-family built-for-rent units are being counted in multifamily starts, as a form of “horizontal multifamily,” given these units are often built on a single plat of land. However, spot checks by NAHB with permitting offices indicate no evidence of this data issue occurring.
With the onset of the Great Recession and declines for the homeownership rate, the share of built-for-rent homes increased in the years after the recession. While the market share of SFBFR homes is small, it has clearly expanded. Given affordability challenges in the for-sale market, the SFBFR market will likely retain an elevated market share. However, in the near-term, SFBFR construction is likely to slow until the return on new deals improves.
This article was originally published by a eyeonhousing.org . Read the Original article here. .
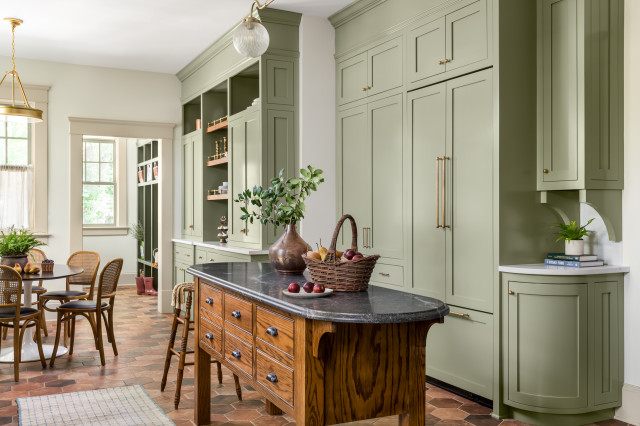
“The client really liked that this tile looked lived-in from the start, because they didn’t want to be concerned about it not looking pristine all of the time,” she says. They also chose unlacquered brass for the perimeter cabinet hardware and lighting “to lean into that patinaed look,” she says.
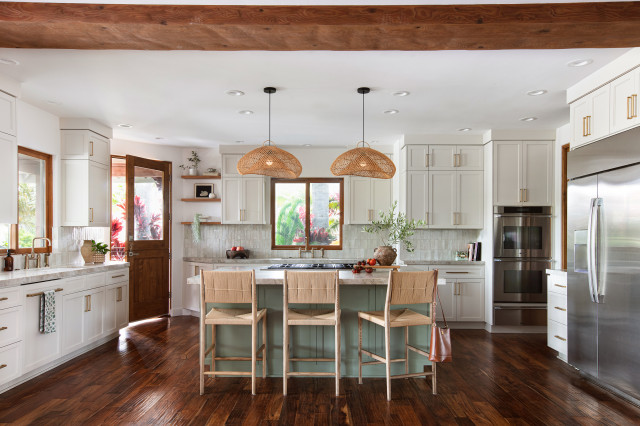
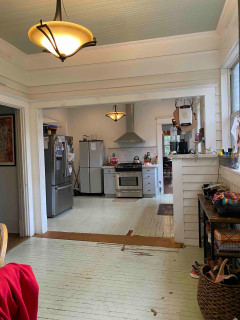
The previous layout of the major appliances worked well, so Flake was able to save on costs by keeping them in the same locations. Above the new JennAir gas range is a custom hood wrapped in red oak with a gray granite trim, both of which match the new island, which is in the foreground of the photo. The perimeter cabinetry now stretches to meet the 10-foot ceiling, emphasizing its height and updating its look.
Paint colors: Green Earth (perimeter cabinets), Alabaster (walls), Accessible Beige (trim), Sherwin-Williams
Perimeter countertops: Calacatta Lavasa quartz, MSI; island countertop: Silver Gray leathered granite
This article was originally published by a www.houzz.com . Read the Original article here. .
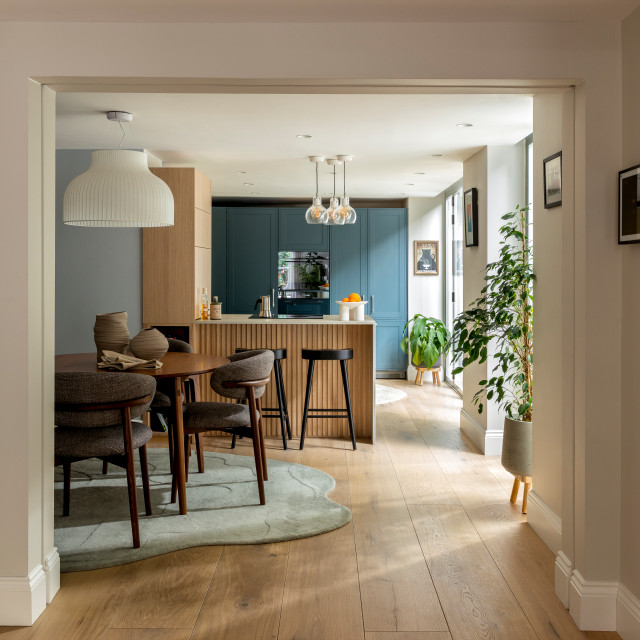
A soft pendant lamp over the table provides a warm glow in the evening.
The team used Houzz Pro tools to share the design with their clients, as well as the products they specified.
“We use Houzz to manage all our projects and, in particular, the Selections boards, where clients can see all the items we’ve proposed,” Matthews says.
The Selections boards allow professionals to present items they’re considering for the project in a simple format that helps clients feel in control. They can see an image of each product and all of the information at a glance, then quickly press Approve or Decline.
Wall paint: Slate ll and Lead IV, both Paint & Paper Library
See why you should hire a professional who uses Houzz Pro software
This article was originally published by a www.houzz.com . Read the Original article here. .
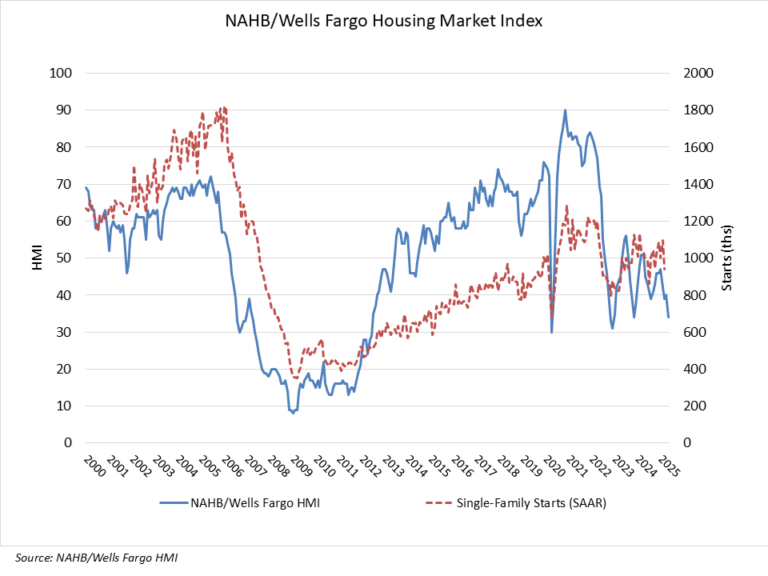
Builder confidence fell sharply in May on growing uncertainties stemming from elevated interest rates, tariff concerns, building material cost uncertainty and the cloudy economic outlook. However, 90% of the responses received in May were tabulated prior to the May 12 announcement that the United States and China agreed to slash tariffs for 90 days to allow trade talks to continue.
Builder confidence in the market for newly built single-family homes was 34 in May, down six points from April, according to the National Association of Home Builders (NAHB)/Wells Fargo Housing Market Index (HMI). This ties the November 2023 reading and is the lowest since the index hit 31 in December 2022.
The spring home buying season has gotten off to a slow start as persistent elevated interest rates, policy uncertainty and building material cost factors hurt builder sentiment in May. Builders expect future trade negotiations and progress on tax policy will help stabilize the economic outlook and strengthen housing demand. Initial trade arrangements with the United Kingdom and China are a welcome development for the macroeconomy. Still, the overall actions on tariffs in recent weeks have had a negative impact on builders, as 78% reported difficulties pricing their homes recently due to uncertainty around material prices.
The latest HMI survey also revealed that 34% of builders cut home prices in May, up from 29% in April and the highest level since December 2023 (36%). Meanwhile, the average price reduction was 5% in May, unchanged from the previous month. The use of sales incentives was 61% in May, the same rate as the previous month.
All three of the major HMI indices posted losses in May. The HMI index gauging current sales conditions fell eight points in May to a level of 37, the component measuring sales expectations in the next six months edged one-point lower to 42 while the gauge charting traffic of prospective buyers dropped two points to 23.
Derived from a monthly survey that NAHB has been conducting for more than 35 years, the NAHB/Wells Fargo HMI gauges builder perceptions of current single-family home sales and sales expectations for the next six months as “good,” “fair” or “poor.” The survey also asks builders to rate traffic of prospective buyers as “high to very high,” “average” or “low to very low.” Scores for each component are then used to calculate a seasonally adjusted index where any number over 50 indicates that more builders view conditions as good than poor.
Looking at the three-month moving averages for regional HMI scores, the Northeast fell three points to 44, the Midwest moved one point lower to 40, the South dropped two points to 37 and the West posted a two-point decline to 33.
The HMI tables can be found at nahb.org/hmi.
Discover more from Eye On Housing
Subscribe to get the latest posts sent to your email.
This article was originally published by a eyeonhousing.org . Read the Original article here. .

Bathroom at a Glance
Who lives here: A couple with three kids; this bathroom is used by the oldest daughter
Location: Portola Valley, California
Size: 84 square feet (7.8 square meters)
Design-build team: Roi Omer (builder) and Ofir Omer (designer) of Valley Boutique Builders
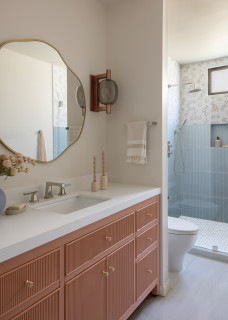
The new en suite bathroom complements the rest of the home while expressing its own personality. “The mom told me she was looking for something modern but not too modern,” Ofir says. “A space that felt eclectic but also fresh and warm. We have color but we were looking for the right combination for the girl, who loves blue and also pink.”
A prefabricated white oak vanity with a reeded front and gold knobs offers ample storage and a timeless look. “Also, the panel fronts fit with the home’s modern Italian look,” Ofir says.
“The vanity is painted a terra-cotta pink, which is a warm, earthy and muted shade that falls between clay orange and dusty rose,” Roi says. “It’s a sophisticated blush tone, not a bright pink, and it leans more toward a refined clay or salmon rose.”
A partition wall to the right creates privacy for the toilet. “In the beginning, we weren’t going to have a wall there, but we wanted to create that separation between the vanity and toilet,” Ofir says.
Walls, ceiling and trim are painted a custom mushroom hue in a satin finish selected for its durability and easy maintenance. “It’s easy to clean, that’s the most important thing,” Ofir says. “I wanted to create good flow and not create any separation between the ceiling and walls.”
Vanity: Sonoma collection, Willow Bath and Vanity
Find home design and building pros on Houzz