Tag

Rates

Browsing


Higher mortgage rates, worsening labor shortages and rising material costs are weighing on builder sentiment.

Builder confidence in the market for newly built single-family homes fell three points to 32 in September, according to the National Association of Home Builders (NAHB)/Wells Fargo Housing Market Index (HMI) released today.

Buyer traffic has weakened across much of the country, largely because of rising mortgage rates. Builders also continue to face higher material costs, rising gas and diesel prices and persistent labor shortages. In some markets, builders report that increased immigration enforcement is discouraging legal workers from reporting to job sites.

The HMI shows builder confidence at its lowest level since September 2025, as tight lending conditions and elevated land, labor and construction costs persist. Notably, 42% of builders rated current lot availability as poor and 38% as fair.

The latest HMI survey found that 38% of builders cut prices in September, up from 35% in August. The average price cut remained at 6% for the sixth consecutive month. Meanwhile, 66% of builders reported using sales incentives in September, up from 63% in August and the highest share since 67% posted in December.

Derived from a monthly survey that NAHB has been conducting for more than 40 years, the NAHB/Wells Fargo HMI gauges builder perceptions of current single-family home sales and sales expectations for the next six months as “good,” “fair” or “poor.” The survey also asks builders to rate traffic of prospective buyers as “high to very high,” “average” or “low to very low.” Scores for each component are then used to calculate a seasonally adjusted index where any number over 50 indicates that more builders view conditions as good than poor.

The index measuring current sales conditions in September fell four points to 35, the index gauging future sales expectations dropped six points to 37 and the index charting prospective buyer traffic held steady at 23.

Looking at the three-month moving averages for regional HMI scores, the Midwest dropped one point to 44, the Northeast fell five points to 39, the South fell one point to 31 and the West posted a one-point gain to 28.

The HMI tables can be found at nahb.org/hmi.


This article was originally published by a eyeonhousing.org . Read the Original article here. .


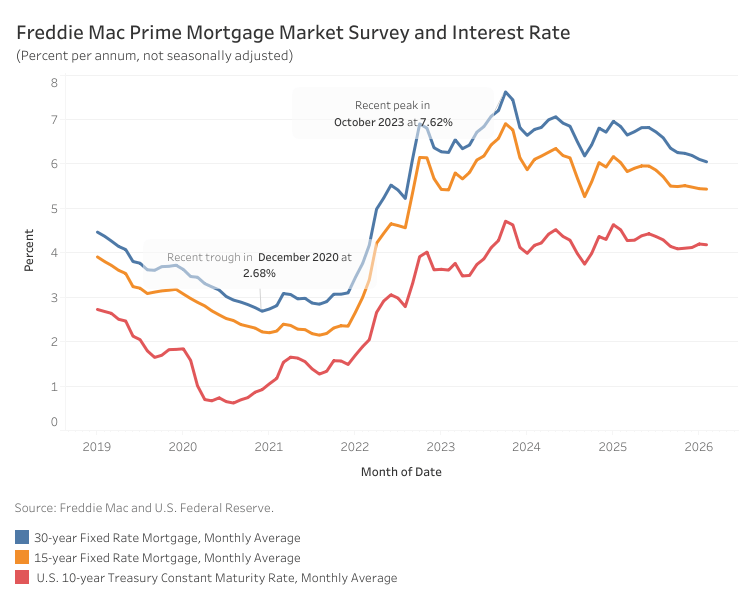
Mortgage rates increased in August as Treasury yields remained elevated amid persistent inflation concerns. According to Freddie Mac, the 30-year fixed-rate mortgage averaged 6.67% in August, up 13 basis points (bps) over July. Since the conflict in the Middle East began, the 30-year mortgage rate has jumped by more than 60 bps. The average 15-year rate averaged 5.98% in July, up 7 bps from July and 55 bps from the end of February. Mortgage rates are now roughly on par with their levels a year ago, with the 30-year rate 6 bps higher and the 15-year rate 24 bps higher.

The 10-year Treasury yield, a key benchmark for long-term borrowing, rose 10 bps to an average of 4.68% in August, Yields rose in the later part of the month amid a broader selloff in global government bonds. Long-term government bond yields across several major economics climbed to multi-year highs in August, with the 30-year US Treasury yield reaching its highest level since 2007 and long-term yields in Japan and parts of Europe reaching levels not seen in decades. The global selloff reflected growing investor concerns about persistent inflation, rising government debt and heavy sovereign borrowing. Higher oil prices from the ongoing Iran conflict also added to inflation concerns.

Domestically, Treasury yields faced additional upward pressure following the Federal Reserve’s (Fed) annual Jackson Hole symposium. Federal Reserve Chair Kevin Warsh emphasized that inflation remained above the Fed’s 2% target, and that restoring price stability remained the Fed’s primary focus. His remarks reinforced market expectations that monetary policy could tighten later in the year.


This article was originally published by a eyeonhousing.org . Read the Original article here. .


After three consecutive quarters of modest improvement, housing affordability worsened in the second quarter as higher mortgage rates, rising construction costs and economic uncertainty weighed on the market, according to the latest data from the National Association of Home Builders (NAHB)/Wells Fargo Cost of Housing Index (CHI).

The CHI results from the second quarter of 2026 show that a family earning the nation’s median income of $106,800 needed 34% of its income to cover the mortgage payment on a median-priced new home. Low-income families, defined as those earning only 50% of median income, would have to spend 67% of their earnings to pay for the same new home.

The percentage of a family’s income needed to purchase a new home rose from 32% in the first quarter of 2026 to 34% in the second quarter, driven by a more than 30-basis point rise in the average mortgage rate and a 2% increase in the median price of a new home. The low-income CHI also rose 65% to 67% over that period.

The figures are higher for the purchase of existing homes in the U.S. A typical family would have to pay 36% of their income for a median-priced existing home while a low-income family would need to pay 71% of their earnings to make the same mortgage payment.

The U.S. data for the percentage of earnings needed to purchase a new home in the second quarter is based on a national median new home price of $410,700 and median income of $106,800. The second quarter median new home price is up 2% from $403,200 in the first quarter. Meanwhile, the corresponding price for an existing home rose much more sharply (8%) in the second quarter to $434,900 from $404,300 in the previous quarter. The average 30-year mortgage rate moved higher from 6.20% in the first quarter to 6.51% in the second quarter.

CHI is also available for 175 metropolitan areas, calculating the percentage of a family’s income needed to make the mortgage payment on an existing home based on the local median home price and median income in those markets.

In eight out of 175 markets in the second quarter, the typical family is severely cost-burdened (must pay more than 50% of their income on a median-priced existing home). In 77 other markets, such families are cost-burdened (need to pay between 31% and 50%). There are 90 markets where the CHI is 30% of earnings or lower.

The Top 5 Severely Cost-Burdened Markets

San Jose-Sunnyvale-Santa Clara, Calif., was the most severely cost-burdened market on the CHI, where 82% of a typical family’s income is needed to make a mortgage payment on an existing home. This was followed by:

San Francisco-Oakland-Fremont, Calif. (71%)
Urban Honolulu, Hawaii (70%)
San Diego-Chula Vista-Carlsbad, Calif. (68%)
Naples-Marco Island, Fla. (60%)

Low-income families would have to pay between 121% and 164% of their income in all five of the above markets to cover a mortgage.

The Top 5 Least Cost-Burdened Markets

By contrast, Decatur, Ill., was the least cost-burdened market on the CHI, where typical families needed to spend just 16% of their income to pay for a mortgage on an existing home. Rounding out the least burdened markets are:

Elmira, N.Y. (17%)
Peoria, Ill. (18%)
Springfield, Ill. (20%)
Davenport-Moline-Rock Island, Iowa-Ill. (20%)

Low-income families in these markets would have to pay between 31% and 39% of their income to cover the mortgage payment for a median-priced existing home.

Visit nahb.org/chi for tables and details.


This article was originally published by a eyeonhousing.org . Read the Original article here. .


Re-escalation of the conflict in Iran pushed mortgage rates higher in July. According to Freddie Mac, the 30-year fixed-rate mortgage averaged 6.54% in July, up 5 basis points (bps) over June. Since the conflict in the Middle East began, the 30-year mortgage rate has climbed by almost 50 bps. The average 15-year rate averaged 5.91% in July, up 9 bps from June, and up 48 basis points since the end of February. Compared to a year ago, the 30-year rate remains lower by 18 bps, however, the 15-year rate is now higher by 5 bps.

The 10-year Treasury yield, a key benchmark for long-term borrowing, rose 10 bps to an average of 4.58% in July as renewed attacks in the Strait of Hormuz heightened concerns about energy supplies and inflation. The yield rose sharply, ending July at 4.67%, 23 bps above its June closing level.

With the conflict unresolved and global oil supply still constraint, inflation remained a key concern among policymakers. At its July meeting, the Federal Reserve (Fed) held the federal funds rate within its target range of 3.50% to 3.75%. However, three Fed officials dissented in favor of a quarter-point rate increase to curtail inflation. The July monetary policy hold marked the fifth consecutive hold, following 75 basis points of cuts at the end of 2025.


This article was originally published by a eyeonhousing.org . Read the Original article here. .


The Q3 2026 U.S. Houzz Pro Industry Barometer survey of nearly 1,000 residential construction, architecture and design firms reveals a wave of renewed confidence heading into the third quarter of 2026. Construction firms expect business activity to rise over the next quarter due to an uptick in project inquiries, despite a slight dip in recent months. And the design sector enters the quarter with significant momentum, fueled by gains in both inquiries and new committed projects.

Their optimism comes with a reality check, however. To protect against higher costs, labor shortages and cautious homeowners, businesses are focusing on three key areas: managing immediate overhead spikes, being choosier about the jobs they take, and changing where and how they look for work. Here’s a closer look at how construction and design professionals are navigating the current landscape.


This article was originally published by a www.houzz.com . Read the Original article here. .


Mortgage rates continued to increase in June as markets priced in a rate hike due to high inflation and stronger-than-expected labor market. According to Freddie Mac, the 30-year fixed-rate mortgage averaged 6.49% in June, up 8 basis points (bps) over May. Since the conflict in the Middle East began, the 30-year mortgage rate has increased by 44 basis points. The average 15-year rate averaged 5.82% in June, up 8 bps from May, and up 39 basis points since the end of February. Even so, both rates remain lower than a year ago by 33 bps and 13 bps, respectively.

The 10-year Treasury yield, a key benchmark for long-term borrowing, held steady at an average of 4.48% in June. The 10-year yield surpassed 4.5% in the second week of the month following reports of persistent high inflation and a surprisingly resilient labor market. Furthermore, the latest Federal Open Market Committee (FOMC) meeting revealed that nine out of 18 Fed officials indicated at least one rate hike within the year.

Nonetheless, the 10-year Treasury yield eased later in the month, ending June at around 4.44%, as the United States and Iran reached a preliminary agreement and signed a Memorandum of Understanding (MoU). The agreement temporarily reopened the Strait of Hormuz to commercial shipping on a “toll-free” basis through mid-August to facilitate further negotiations over Iran’s nuclear program.


This article was originally published by a eyeonhousing.org . Read the Original article here. .


Mortgage rates continued to increase in May as inflation accelerated. According to Freddie Mac, the 30-year fixed-rate mortgage averaged 6.41% in May, up 7 basis points (bps) over April. Since the conflict in the Middle East began, the 30-year mortgage rate has increased by 36 basis points. The average 15-year rate averaged 5.76% in May, up 7 bps from April, and up 33 basis points since the end of February. Even so, both rates remain lower than a year ago by 41 bps and 19 bps, respectively.

The 10-year Treasury yield, a key benchmark for long-term borrowing, averaged 4.47% in May, 16 bps higher than the previous month. Stronger-than-expected inflation pushed yields upward, with the 10-year yield reaching as high as 4.6% during the month. Rising energy prices kept inflation high, as fuel oil prices increased 5.8% and gasoline prices rose 5.4%.

Persistently high inflation has also strained household budgets. As people used more of their disposable income or drew down on savings to cover everyday expenses, the personal saving rate fell to 2.6% in April. The rate was the lowest since June 2022 when CPI was at its peak.


This article was originally published by a eyeonhousing.org . Read the Original article here. .


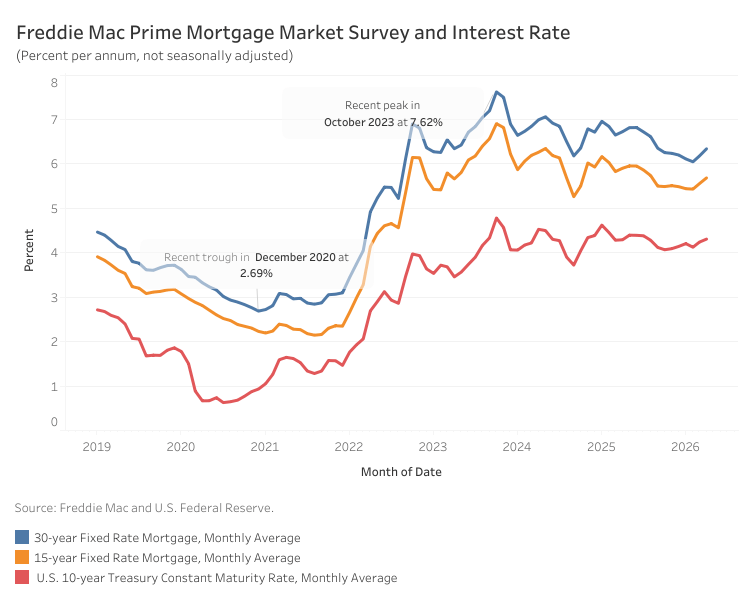
Mortgage rates continued to increase in April as ceasefire negotiations remain inconclusive. According to Freddie Mac, the 30-year fixed-rate mortgage averaged 6.34% in April, 16 basis points (bps) higher than March. The average 15-year rate also increased by 13 bps to 5.69%. Despite the recent increase, both rates remain lower than a year ago by 39 bps and 21 bps, respectively.

The 10-year Treasury yield, a key benchmark for long-term borrowing, averaged 4.31%, up 7 bps from the previous month. Ongoing blockades in the Strait of Hormuz have kept oil prices above $100 per barrel. This has passed through to inflation which climbed to 3.3%, nearing a two-year high. Energy components led the increase with fuel oil prices rising 30.7% and gasoline up 21.2% in March.

At its latest meeting, the Federal Reserve held the federal funds rates unchanged at 3.5% to 3.75% as inflation remains elevated alongside continued economic expansion. Jerome Powell’s term as Chair will end next month but has announced that he will remain on the Board of Governors. Kevin Warsh, President Trump’s pick as the next Fed Chair, indicated during a Senate Banking Committee hearing a preference for alternative inflation measures, including “trimmed averages”, which removes outliers above and below a certain threshold. For example, by stripping out outsized swings like a 50.8% annualized drop in telecom equipment and a 384.6% jump in moving and freight services, the Dallas Fed’s trimmed-mean measure last February registered 2.3%, below the 2.8% headline PCE and 3.0% core PCE.


This article was originally published by a eyeonhousing.org . Read the Original article here. .


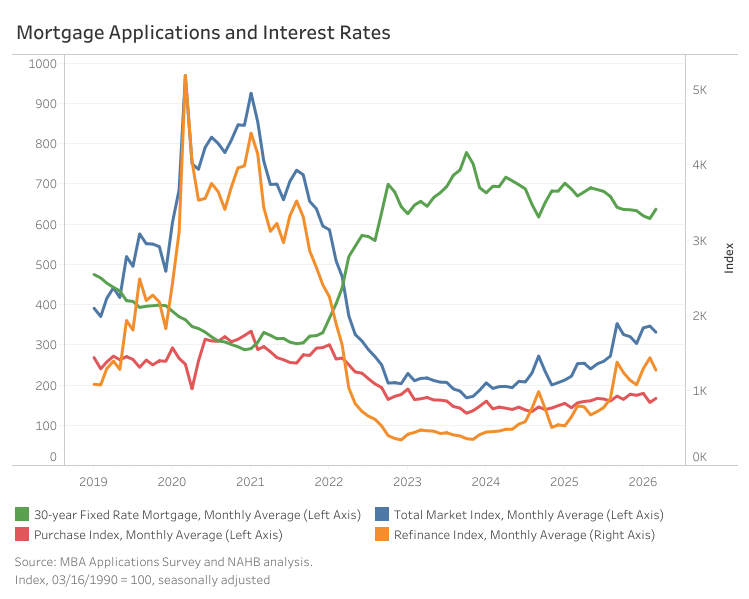
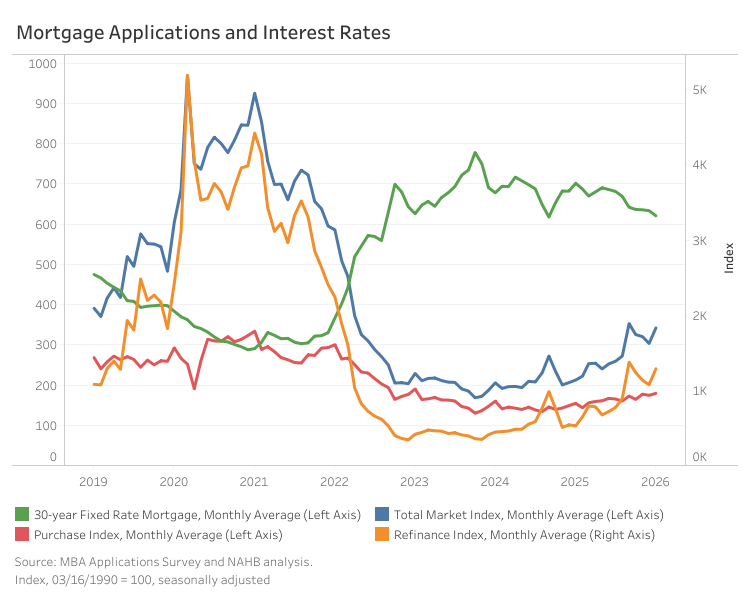
Mortgage application activity decreased month-over-month as the 30-year fixed mortgage rate rose. The Mortgage Bankers Association’s (MBA) Market Composite Index, a measure of total mortgage application volume, declined 4.3% from February on a seasonally adjusted basis but remained 30.8% higher than a year earlier. Applications for adjustable-rate mortgages (ARM) also decreased 4.5% month-over-month, while their share of total applications was unchanged at 8.3%.

The average contract rate for a 30-year fixed-rate mortgage increased 13 basis points (bps) to 6.37%, setting back the improvement seen over the last five months. Nonetheless, the rate remained 33 bps lower than its level a year ago. The increase in mortgage rates diminished refinance activity, which fell 11.4%. Purchase applications, on the other hand, increased 6.4%, driven by growth in both FHA and VA segments. Relative to March 2025, refinance and purchase activities were up 60.4% and 6.4%, respectively.

By loan type, applications for both adjustable-rate mortgages (ARMs) and fixed-rate mortgages (FRMs) both decreased 4.5% month-over-month. On a year-over-year basis, FRM applications were up 28.6%, while ARM applications rose 62.4%. As of March 2026, ARMs applications–including both purchase and refinance loans–accounted for 8.3% of total applications on a non-seasonally adjusted basis, unchanged from last month and 1.6 percentage points higher than a year earlier. The average contract interest rate for 5/1 ARMs was 5.6% in March.

Loan sizes declined across all categories except purchase loans in March, pulling the overall average loan size down 3.3% to $401,300. The average purchase loan size rose 1.0% to $450,800, while the average refinance loan size fell 10.4% to $351,000. The average ARM loan size declined 4.0% to $929,500.


This article was originally published by a eyeonhousing.org . Read the Original article here. .


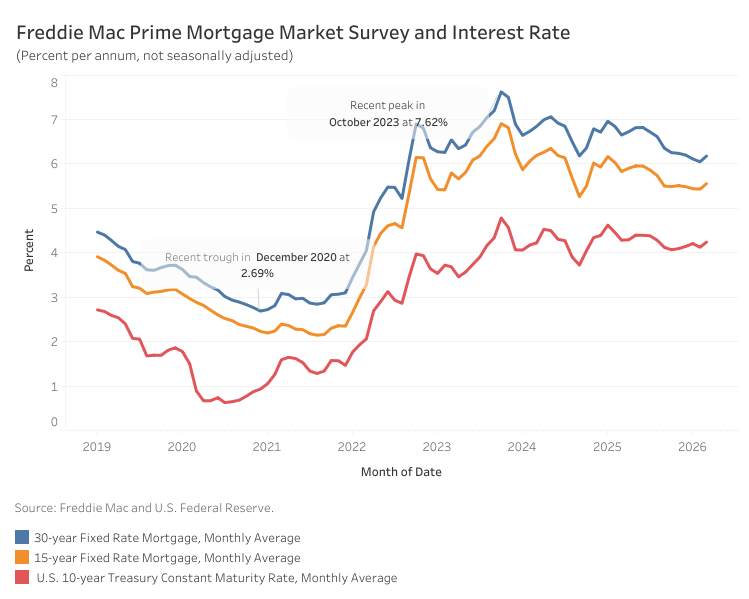
Mortgage rates, which dipped below 6% in February, climbed back up to end the month just under 6.4%. According to Freddie Mac, the 30-year fixed-rate mortgage averaged 6.18% in March, 13 points (bps) higher than February. The average 15-year rate also increased by the same amount to 5.56%. Despite the recent increase, both rates remain lower than a year ago by 47 bps and 27 bps, respectively.

The rebound in mortgage rates was driven primarily by movements in the 10-year Treasury yield, which jumped 11 bps to 4.24% as tensions in the Middle East escalated. The ongoing Iran conflict has disrupted oil markets, pushing oil prices higher and reigniting fears that inflation could pick up again.

Amid this uncertainty, the Federal Reserve held the federal funds rates unchanged at 3.5% to 3.75%. They revised their inflation expectations higher from 2.4% last December to 2.7% but maintained that one rate cut is still possible in 2026.


This article was originally published by a eyeonhousing.org . Read the Original article here. .

Pin It