Tag

Material

Browsing


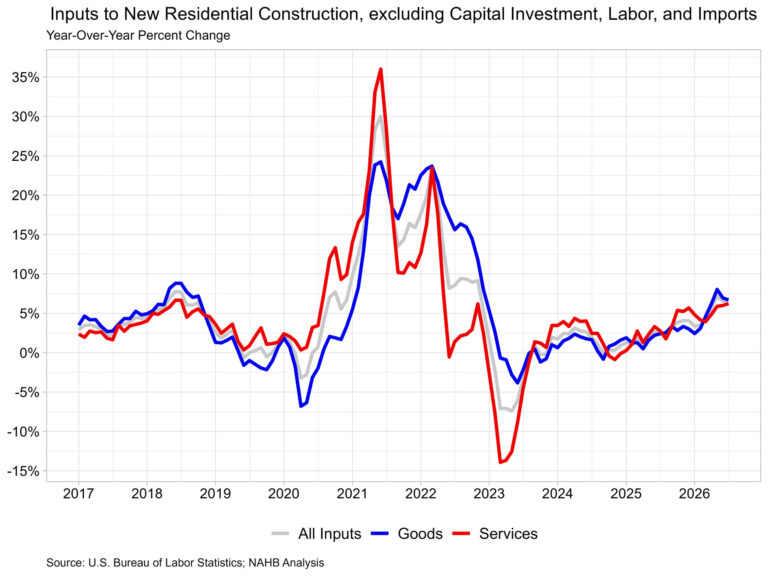
Residential building material prices, excluding energy, rose 0.4% in July and were up 5.0% from a year ago. Energy prices fell again in July but remained significantly higher than a year ago. Meanwhile, prices for services were down 0.3% over the month but were 6.2% higher than a year ago.

The Producer Price Index for final demand was unchanged in July, after falling 0.1% in June. Compared to a year ago, final demand prices were up 4.7%.  The index for final demand services rose 0.2% in July, while the index for final demand goods fell 0.7% over the month.

The price index for inputs to new residential construction fell 0.1% in July and was up 6.5% from last year. The price of goods used in new residential construction (including energy) was up 0.1% over the month and up 6.7% from last year, while the price of services was down 0.3% over the month and up 6.2% from last year.

Input Goods

The goods component has a larger importance to the inputs to residential construction price index, representing around 60% of the total. On a monthly basis, the price of input goods to new residential construction was up 0.1% in July after falling 0.7% in June.

The input goods to residential construction index can be further broken down into two separate components, one measuring energy inputs with the other measuring remaining goods. The latter of these two components simply represents building materials used in residential construction, which makes up around 93% of the goods index.

Energy input prices fell 2.4% in July but were 33.1% higher than a year ago. Building material prices were up 0.4% in July and up 5.0% compared to one year ago. The year-over-year percentage increase in building materials was the highest since December 2022.

Among building materials, softwood lumber prices rose significantly in July, as they were up 7.4% over the month. Softwood lumber prices were up 17.3% from one year ago. Ready-mix concrete prices were down 0.4% over the month and have only risen 2.2% from a year ago.

Input Services

Prices for service inputs to residential construction fell 0.3% in July. On a year-over-year basis, service input prices were up 6.2%. The price index for service inputs to residential construction can be broken out into three separate components: a trade services component, a transportation and warehousing services component, and a services excluding trade, transportation, and warehousing component (other services).

The most significant component is trade services (around 60%), followed by other services (around 29%), and finally transportation and warehousing services (around 11%). The largest component, trade services, was up 7.0% from a year ago. The price of transportation and warehousing services rose 10.9%, while prices for other services were up 2.5% over the year.


This article was originally published by a eyeonhousing.org . Read the Original article here. .
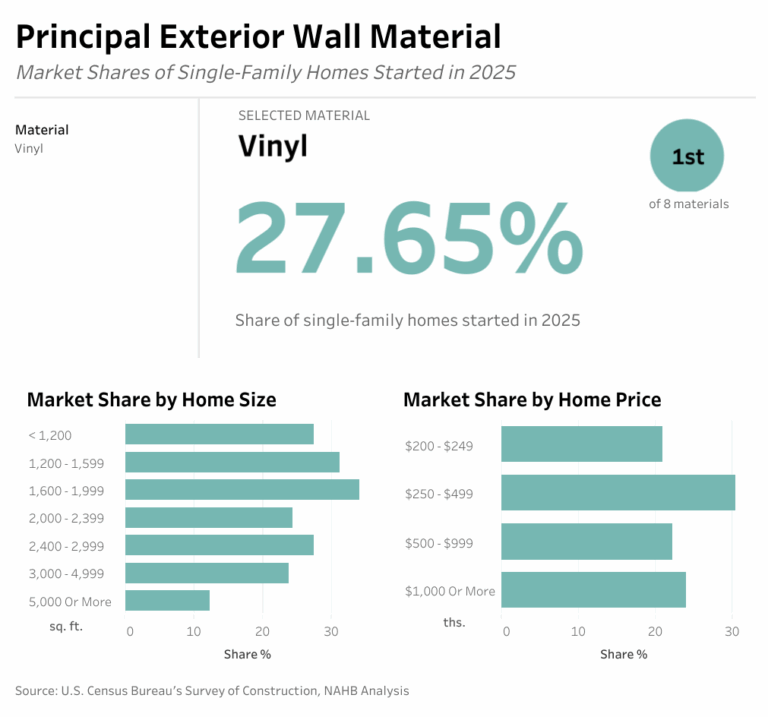

Vinyl siding was the most used principle exterior wall material for homes started construction in 2025. This material held just over a quarter share of homes, surpassing stucco for the second time since 2018. The declining share for stucco reflected the slowdown for home building in parts of the Sun Belt.

For homes started in 2025, 27.7% had vinyl siding as the principal exterior wall material. Vinyl siding was followed closely by stucco at 24.1%, and by fiber cement siding (such as Hardiplank or Hardiboard) at 22.6%. Each of these materials held about a quarter share of the market, with another sliver held by brick or brick veneer at 16.8%. Far smaller shares of single-family homes started last year had wood or wood products (5.9%) as the principal exterior wall material, while all other materials had a less than 2% share.

As shown in the graph above, while vinyl has historically held a much larger share, at a high of almost 40% in 2001, the share fell rapidly between 2010 to 2015 by over 10 percentage points. However, this share has remained fairly steady since, at around 25%. Meanwhile, stucco rose rapidly from 17% in 2010 until recently peaking at 28% in 2021.  

However, the strongest trend has been the growing popularity in fiber cement siding, growing in share by almost 20 percentage points in the past 25 years. Also notable is the decline of brick siding, from almost a quarter of homes in 2012, to just under 17% in 2025.

As shown in the dashboard above, exterior material preferences varied by both home size and price. Vinyl siding had the largest market share among smaller homes (under 2,000 square feet), while fiber cement was most common in larger homes (3,000 square feet or more). Stucco was widely used across all home sizes but was most prevalent in midsized homes (2,000–2,999 square feet).

A majority of homes started in 2025 were priced between $250,000-$499,000, where vinyl was most prevalent. Meanwhile, stucco was the most common material in home priced above $500,000.  Interestingly, although brick siding was most common in lower-priced homes, it also had a relatively high market share among larger homes. This apparent contradiction highlights the most important factor influencing exterior material choices: geography.

Climate, regional building practices, material availability, and architectural styles create substantial differences in siding preferences across the country. In 2025, brick or brick veneer was the most common exterior siding material in the West South Central division at 54%. As the South tends to build larger and more affordable homes, this helps explain why brick siding is associated with both larger and lower-priced homes. 

In 2025, vinyl siding was the most widely used primary exterior material in five out of nine census divisions. Vinylsidingwas used on 73% of the new homes started in the Middle Atlantic, 72% in New England, 71% in the East North Central, 47% in the West North Central and the East South Central at 39%. Notably, this was the first time since 2020 that vinyl siding surpassed brick siding in the East South Central division.

Stucco was the most used primary exterior wall material in the Pacific and South Atlantic divisions in 2025, at 65% and 33% of the new single-family homes started in those areas. Fiber Cement siding slightly surpassed stucco this year in the Mountain division with a 42% market share for the first time based on data available back to 2000.

The highest market share for wood exterior siding was in the West North Central division at 23% of homes started in 2025. Meanwhile, stone, concrete block, and other siding materials held similary small shares across all divisions.


This article was originally published by a eyeonhousing.org . Read the Original article here. .


Residential building material prices, excluding energy, rose 0.5% in June and were up 4.6% from a year ago. Lower energy prices were apparent in June, as energy input prices fell 10.3% over the month. Meanwhile, prices for services rose 5.2% over the year, and were up 1.0% from the previous month.

The Producer Price Index for final demand declined 0.3% in June, after rising 0.6% in May. Compared to a year ago, final demand prices were up 5.5%. The index for final demand services rose 0.3% in June, while the index for final demand goods fell 1.4% over the month.

The price index for inputs to new residential construction fell 0.1% in June and was up 6.2% from last year. The price of goods used in new residential construction (including energy) was down 0.8% over the month and up 6.9% from last year, while the price of services was up 1.0% over the month and up 5.2% from last year. The decline in the overall residential input price index was largely driven by lower goods prices, particularly energy-related inputs.

Input Goods

The goods component has a larger importance to the inputs to residential construction price index, representing around 60% of the total. On a monthly basis, the price of input goods to new residential construction was down 0.8% in June, the first monthly decline since December of last year.

The input goods to residential construction index can be further broken down into two separate components, one measuring energy inputs with the other measuring remaining goods. The latter of these two components simply represents building materials used in residential construction, which makes up around 93% of the goods index. Energy input prices fell 10.3% in June but were 40.9% higher than a year ago. Building material prices were up 0.5% in June and up 4.6% compared to one year ago.

Among input goods, energy costs continue to show the largest price increase from a year ago. Diesel fuel costs were up 65.7% from a year ago in June. Outside of energy products, roofing asphalt product prices were up 9.2% from a year ago and rose 4.0% in June alone. Softwood lumber prices showed upward movement in June, with prices 7.0% higher than a year ago. Ready-mix concrete prices were up 1.9% from a year ago, while gypsum building material prices were down 1.1% from a year ago.

Input Services

Prices for service inputs to residential construction rose 1.0% in June. On a year-over-year basis, service input prices were up 5.2%. The price index for service inputs to residential construction can be broken out into three separate components: a trade services component, a transportation and warehousing services component, and a services excluding trade, transportation, and warehousing component (other services).

The most significant component is trade services (around 60%), followed by other services (around 29%), and finally transportation and warehousing services (around 11%). The largest component, trade services, was up 4.7% from a year ago. The price of transportation and warehousing services rose 16.0%, while prices for other services were up 2.0% over the year.


This article was originally published by a eyeonhousing.org . Read the Original article here. .


Wholesale prices of goods used in residential construction rose in May as energy prices continued to climb. In May, residential building material prices, excluding energy, rose at their highest yearly rate since January 2023, as prices were up 4.4% from a year ago and up 0.7% over the month. Meanwhile, prices for services rose 4.7% over the year, but were unchanged from the previous month.

The Producer Price Index for final demand increased 1.1% in May, after rising 1.1% in April. Compared to a year ago, final demand prices were up 6.5%. The index for final demand services rose 0.3% in May, while the index for final demand goods rose 2.8% over the month.

The price index for inputs to new residential construction rose 1.3% in May and was up 6.9% from last year. The price of goods used in new residential construction (including energy) was up 2.1% over the month and up 8.3% from last year, while the price of services was unchanged over the month and up 4.7% from last year.

Input Goods

The goods component has a larger importance to the inputs to residential construction price index, representing around 60% of the total. On a monthly basis, the price of input goods to new residential construction was up 2.1% in May. This monthly increase was the largest since it rose 3.3% back in March of 2022.

The input goods to residential construction index can be further broken down into two separate components, one measuring energy inputs with the other measuring remaining goods. The latter of these two components simply represents building materials used in residential construction, which makes up around 93% of the goods index.

Energy input prices rose 17.2% in May and were 62.8% higher than a year ago. Building material prices were up 0.7% in May and up 4.4% compared to one year ago.

Among input goods, the largest year-over-year increase was for No. 2 diesel fuel as prices were 105.9% higher than a year ago. Metal molding and trim prices remained higher, with prices up 42.9% from a year ago. Softwood lumber prices were up 5.6% from a year ago in May while ready-mix concrete prices were up 1.7% from a year ago. Gypsum building materials prices were down 1.1% from a year ago.

Input Services

Prices for service inputs to residential construction reported no price change in May. On a year-over-year basis, service input prices were up 4.7%. The price index for service inputs to residential construction can be broken out into three separate components: a trade services component, a transportation and warehousing services component, and a services excluding trade, transportation, and warehousing component (other services).

The most significant component is trade services (around 60%), followed by other services (around 29%), and finally transportation and warehousing services (around 11%). The largest component, trade services, was up 3.8% from a year ago. The price of transportation and warehousing services rose 17.3%, while prices for other services were up 1.7% over the year.


This article was originally published by a eyeonhousing.org . Read the Original article here. .


Residential building material price growth accelerated in February after slowing a month prior, according to the latest Producer Price Index release from the Bureau of Labor Statistics. Since the BLS collects pricing data during the week of the 13th, these figures were finalized before the onset of the conflict in Iran.

The Producer Price Index for final demand increased 0.7% in February, after rising 0.5% in January. The index for final demand services rose 0.5% in February, while the index for final demand goods rose 1.1% over the month. The monthly increase in the index for final demand goods was the largest since it rose 1.6% back in August of 2023.

The price index for inputs to new residential construction rose 0.7% in February and was up 3.4% from last year. The price of goods used in new residential construction was up 1.1% over the month and 3.0% from last year, while the price of services was up 0.1% over the month and up 4.2% from last year.

Input Goods

The goods component has a larger importance to the inputs to residential construction price index, representing around 60%. On a monthly basis, the price of input goods to new residential construction was up 1.1% in February. The last time this index increased over 1.0% on a monthly basis was January of 2025.

The input goods to residential construction index can be further broken down into two separate components, one measuring energy inputs with the other measuring remaining goods. The latter of these two components simply represents building materials used in residential construction, which makes up around 93% of the goods index.

Energy input prices rose 9.3% in February but were 3.5% lower than one year ago. Building material prices were up 0.6% in February and up 3.5% compared to one year ago.

The largest year-over-year price increases continue to show in metal products with the largest being for metal molding and trim, as prices are now up 61.7% from a year ago. Metal windows price growth has continued to accelerate with prices up 20.2% from last year. Across all metals and metal products, prices are up 16.6% from last year. Yearly price declines were prevalent among energy products, due to the timing of the survey. For building materials, particleboard and fiberboard prices were down 17.4%, while softwood veneer and plywood prices were down 4.0%.

Input Services

Prices for service inputs to residential construction reported an increase of 0.1% in February. On a year-over-year basis, service input prices were up 4.2%. The price index for service inputs to residential construction can be broken out into three separate components: a trade services component, a transportation and warehousing services component, and a services excluding trade, transportation, and warehousing component (other services).

The most significant component is trade services (around 60%), followed by other services (around 29%), and finally transportation and warehousing services (around 11%). The largest component, trade services, was up 5.8% from a year ago. The transportation and warehousing services rose 3.0%, while prices for other services were up 1.3% over the year.

Expanded Inputs to New Construction Data

Within the PPI that BLS publishes, new experimental data was recently published regarding inputs to new construction. The data expands existing inputs to industry indexes by incorporating import prices with prices for domestically produced goods and services. With this additional data, users can track how industry input costs are changing among domestically produced products and imported products. This data focuses on new construction, but the complete dataset includes indices across numerous industries that can be found here on BLS website.

New construction input prices are primarily influenced by domestically produced goods and services, with domestic products accounting for 90% of the weight of the industry index for new construction. Imported goods make up the remaining 10% of the index.

The latest available data, for December 2025, showed that domestically produced goods continue to show price growth compared to imported goods used in new construction. On a year-over-year basis, the index for domestic goods increased 3.0%, while prices for imported goods have fallen 3.2%.


This article was originally published by a eyeonhousing.org . Read the Original article here. .


Residential building material prices continued to experience elevated growth, according to the latest Producer Price Index release from the Bureau of Labor Statistics. Price growth has been above 3.0% since June this year, despite continued weakness in the new residential construction market. Across building materials, metal products continue to experience price increases, while ready-mix concrete and softwood lumber have experienced price declines over the past year.

The Producer Price Index for final demand increased 0.2% in November, after rising 0.1% in October. The index for final demand goods increased 0.9% in November. Over 80% of the November increase is due to prices for final demand energy, which was up 4.6% in November. This index for final demand for services was unchanged in November.

The price index for inputs to new residential construction rose 0.1% in November and was up 4.2% from last year. The price of goods used in new residential construction was up 0.4% over the month and 3.4% from last year. Meanwhile, the price for services was down 0.4% over the month and up 5.5% from last year.

Input Goods

The goods component has a larger importance to the inputs to residential construction price index, representing around 60%. On a monthly basis, the price of input goods to new residential construction was up 0.4% in November.

The input goods to residential construction index can be further broken down into two separate components, one measuring energy inputs with the other measuring remaining goods. The latter of these two components simply represents building materials used in residential construction, which makes up around 93% of the goods index.

Energy input prices rose 3.8% in November and were 2.0% higher than one year ago. Building material prices were up 0.2% in September and up 3.5% compared to one year ago. The 3.5% year-over-year increase is the largest increase since the 4.9% experienced back in January of 2023.

The largest year-over-year price increases continue to show in metal products. Topping the list in November was metal molding and trim, with prices up 48.2% from last year. Two key inputs, ready-mix concrete and softwood lumber, experienced price decreases from last year. Ready-mix concrete prices are down 0.7% compared to a year ago, likely a result of the recent stagnation in construction spending. Softwood lumber prices were down 8.0% in November from last year as prices continue to remain low.

Input Services

Prices for service inputs to residential construction reported a decline of 0.4% in November. On a year-over-year basis, service input prices were up 5.6%. The price index for service inputs to residential construction can be broken out into three separate components: a trade services component, a transportation and warehousing services component, and a services excluding trade, transportation and warehousing component (other services).

The most significant component is trade services (around 60%), followed by other services (around 29%), and finally transportation and warehousing services (around 11%). The largest component, trade services, was up 7.7% from a year ago. The transportation and warehousing services rose 4.2% while prices for other services were up 1.5% over the year.

Expanded Inputs to New Construction Data

Within the PPI that BLS publishes, new experimental data was recently published regarding inputs to new construction. The data expands existing inputs to industry indexes by incorporating import prices with prices for domestically produced goods and services. With this additional data, users can track how industry input costs are changing among domestically produced products and imported products. This data focuses on new construction, but the complete dataset includes indices across numerous industries that can be found here on BLS website. 

New construction input prices are primarily influenced by domestically produced goods and services, with domestic products accounting for 90% of the weight of the industry index for new construction. Imported goods make up the remaining 10% of the index.  

The latest available data, for August 2025, showed that domestically produced goods continue to have faster price growth compared to imported goods used in new construction. On a year-over-year basis, the index for domestic goods increased 2.5%, while prices for imported goods fell 0.7% over the same period.


This article was originally published by a eyeonhousing.org . Read the Original article here. .
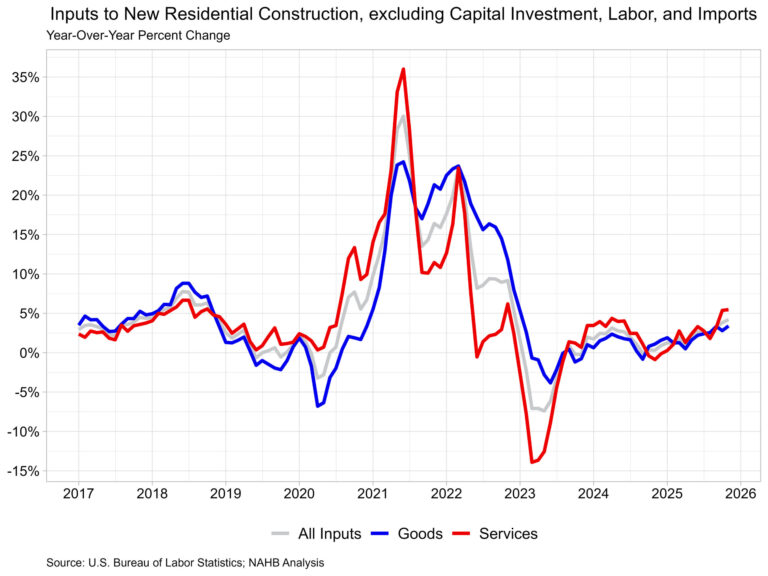

Aggregate residential building material prices rose at their fastest pace since January 2023 in the latest Producer Price Index release from the Bureau of Labor Statistics. Input energy prices increased for the first time in over a year, while service price growth remained lower than goods.

The Producer Price Index for final demand increased 0.3% in September, after falling 0.1% in August. The index for final demand goods increased 0.9% in September, the largest monthly increase since February 2024. Final demand energy prices were responsible for most of the goods index increase, as they rose 3.5% in September. This index for final demand for services was unchanged in September.

The price index for inputs to new residential construction rose 0.2% in September and was up 3.1% from last year. The price of goods inputs was up 0.1% over the month and 3.5% from last year, while prices for services were up 0.3% over the month and 2.5% from last year.

Input Goods

The goods component has a larger importance to the inputs to residential construction price index, representing around 60%. On a monthly basis, the price of input goods to new residential construction was up 0.1% in September.

The input goods to residential construction index can be further broken down into two separate components, one measuring energy inputs with the other measuring remaining goods. The latter of these two components simply represents building materials used in residential construction, which makes up around 93% of the goods index.

Energy input prices rose 1.0% in September and were 3.0% higher than one year ago. Building material prices were up 0.1% in September and up 3.5% compared to one year ago. The 3.5% year-over-year increase is the largest increase since the 4.9% experienced back in January 2023. Residential building material price inflation slowly accelerated over the year, after starting around 2.0%.

The largest year-over-year price changes continue to be parts for construction machinery and equipment, sold separately, up 41.3% compared to September of last year. Metal molding and trim prices are up 31.0% from last year. Ready-mix concrete, a key input to new residential construction, has shown little price growth in 2025, up only 0.4% from last year. Additionally, softwood lumber prices were down 2.3% in September from last year. Lumber prices have experienced declines over the past few months despite higher tariffs now in place. Ongoing weaknesses during 2025 in new residential construction have led to an acute oversupply of lumber on the market, with demand below expectations.

Input Services

Prices for service inputs to residential construction reported an increase of 0.3% in September. On a year-over-year basis, service input prices were up 2.5%. The price index for service inputs to residential construction can be broken out into three separate components: a trade services component, a transportation and warehousing services component, and a services excluding trade, transportation and warehousing component (other services).

 The most significant component is trade services (around 60%), followed by other services (around 29%), and finally transportation and warehousing services (around 11%). The largest component, trade services, was up 3.1% from a year ago. The other services component was up 1.3% over the year.  Lastly, prices for transportation and warehousing services rose 2.6% compared to August of last year.


This article was originally published by a eyeonhousing.org . Read the Original article here. .
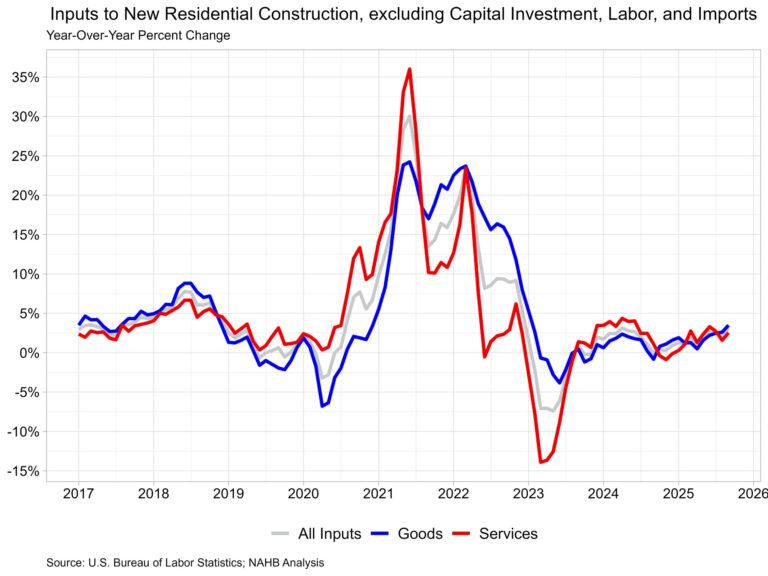

Prices for residential building materials rose again in July, marking the largest year-over-year increase in over two years. The underlying price growth trend remained the same, with service prices continuing to grow at a faster pace than goods prices. Similar to last month, parts for construction machinery and metal molding/trim experienced significant price growth, as both increased over 25% compared to last year.

Prices for inputs to new residential construction—excluding capital investment, labor, and imports—rose 0.2% in July, following a 0.8% increase in June. These figures are taken from the most recent Producer Price Index (PPI) report published by U.S. Bureau of Labor Statistics. The PPI measures prices that domestic producers receive for their goods and services; this differs from the Consumer Price Index which measures what consumers pay and includes both domestic products as well as imports.

The inputs to the new residential construction price index grew 2.8% from July of last year. The index can be broken into two components­—the goods component increased 2.4% over the year, while services increased 3.3%. For comparison, the total final demand index, which measures all goods and services across the economy, increased 3.3% over the year, with final demand with respect to goods up 1.9% and final demand for services up 4.0%.

Input Goods

The goods component has a larger importance to the total residential construction inputs price index, representing around 60%. On a monthly basis, the price of input goods to new residential construction was up 0.4% in July.

The input goods to residential construction index can be further broken down into two separate components, one measuring energy inputs with the other measuring remaining goods. The latter of these two components simply represents building materials used in residential construction, which makes up around 93% of the goods index.

Energy input prices jumped up 3.9% between June and July but were 8.1% lower than one year ago. Building material prices were up 0.2% between June and July and up 3.3% compared to one year ago.

Tariffs on building materials do not directly show up in the PPI data because the PPI measures prices for domestically produced goods and services. In fact, tariffs and taxes are explicitly excluded from the PPI. Despite this, price changes in reaction to tariffs are included in the PPI, meaning price increases to pass on increased costs of materials will show up in this pricing data.  Announced tariffs in recent months have resulted in material increases across a few different goods, specifically certain metal products and equipment.

In July, the largest year-over-year input price increase was for construction machinery and equipment parts, reporting a 31.4% increase over the year. Meanwhile, metal molding and trim prices were up 25.6%, fabricated steel plate prices were up 14.3%, and nonferrous wire/cable up 10.5%. Metal commodities have been the primary targets of tariffs, with 50% tariffs in effect on steel and aluminum products and a 50% tariff on semifinished products of copper.

Input Services

Prices for service inputs to residential construction reported a decrease of 0.2% in July. On a year-over-year basis, service input prices are up 3.3%. The price index for service inputs to residential construction can be broken out into three separate components: a trade services component, a transportation and warehousing services component, and a services excluding trade, transportation and warehousing component (other services).

 The most significant component is trade services (around 60%), followed by other services (around 29%), and finally transportation and warehousing services (around 11%). The largest component, trade services, was up 5.2% from a year ago. The other services component was up 1.2% over the year.  Lastly, prices for transportation and warehousing services fell 0.6% compared to July of last year.

Inputs to New Construction Satellite Data

Within the PPI that BLS publishes, new experimental data was recently published regarding inputs to new construction. The data expands existing inputs to industry indexes by incorporating import prices with prices for domestically produced goods and services. With this additional data, users can track how industry input costs are changing among domestically produced products and imported products. This data focuses on new construction, but the complete dataset includes indices across numerous industries that can be found here on the BLS website.

New construction input prices are primarily influenced by domestically produced goods and services, with domestic products accounting for 90% of the weight of the industry index for new construction. Imported goods make up the remaining 10% of the index.

The latest available data, for May 2025, showed that domestically produced goods have experienced faster price growth compared to imported goods used in new construction. On a year-over-year basis, the index for domestic goods increased 1.6%, while prices for imported goods rose 0.1% over the same period. Comparatively, service prices have risen more than good prices over the past year, rising 2.7% year-over-year. Across the three indexes, all inputs remain at higher levels compared to pre-pandemic prices.

Discover more from Eye On Housing

Subscribe to get the latest posts sent to your email.


This article was originally published by a eyeonhousing.org . Read the Original article here. .
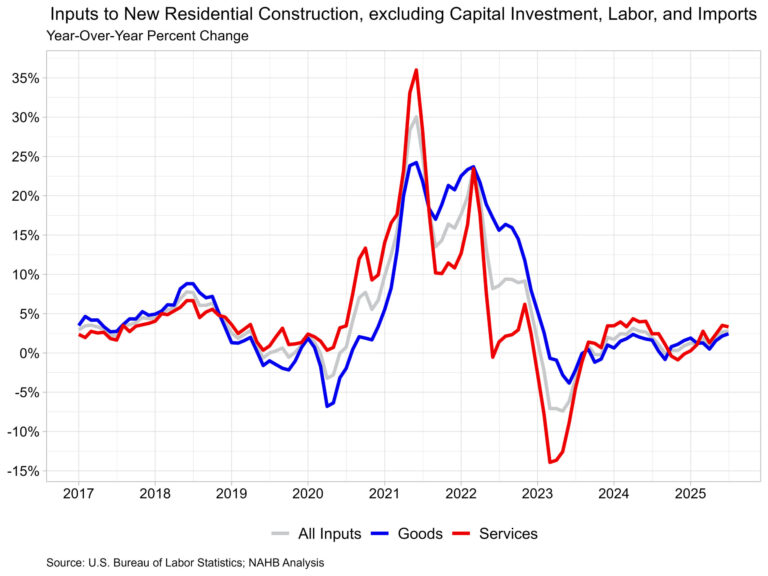

Prices for inputs to new residential construction—excluding capital investment, labor, and imports—fell 0.4% in April, following a (revised) increase of 0.8% in March. These figures are taken from the most recent Producer Price Index (PPI) report published by U.S. Bureau of Labor Statistics. The PPI measures prices that domestic producers receive for their goods and services; this differs from the Consumer Price Index which measures what consumers pay and includes both domestic products as well as imports.

The inputs to the New Residential Construction Price Index grew 0.6% from April of last year. The index can be broken into two components­—the goods component also increased 0.6% over the year, with services increasing 0.6% as well. For comparison, the total final demand index, which measures all goods and services across the economy, increased 2.4% over the year, with final demand with respect to goods up 0.5% and final demand for services up 3.3% over the year.

Input Goods Prices

The goods component has a larger importance to the total residential construction inputs price index, representing around 60%. For the month, the price of input goods to new residential construction was down 0.2% in April.

The input goods to residential construction index can be further broken down into two separate components, one measuring energy inputs with the other measuring goods less energy inputs. The latter of these two components simply represents building materials used in residential construction, which makes up around 93% of the goods index.

Energy input prices were up 0.1% between March and April but were 17.6% lower than one year ago. Building material prices were down 0.3% between March and April but up 2.2% compared to one year ago. Energy costs have continued to fall on a year-over-year basis, as this marks the ninth consecutive month of lower input energy costs.

Input Services Prices

Prices for service inputs to residential construction reported its first monthly decline in five months, down 0.6% in April. On a year-over-year basis, service input prices are up 0.6%.

The price index for service inputs to residential construction can be broken out into three separate components: a trade services component, a transportation and warehousing services component, and a services excluding trade, transportation and warehousing component (other services). The most significant component is trade services (around 60%), followed by other services (around 29%), and finally transportation and warehousing services (around 11%). The largest component, trade services, was up 0.2% from a year ago. The other services component was up 1.4% over the year. Lastly, prices for transportation and warehousing services advanced 0.6% compared to April last year.

Discover more from Eye On Housing

Subscribe to get the latest posts sent to your email.


This article was originally published by a eyeonhousing.org . Read the Original article here. .
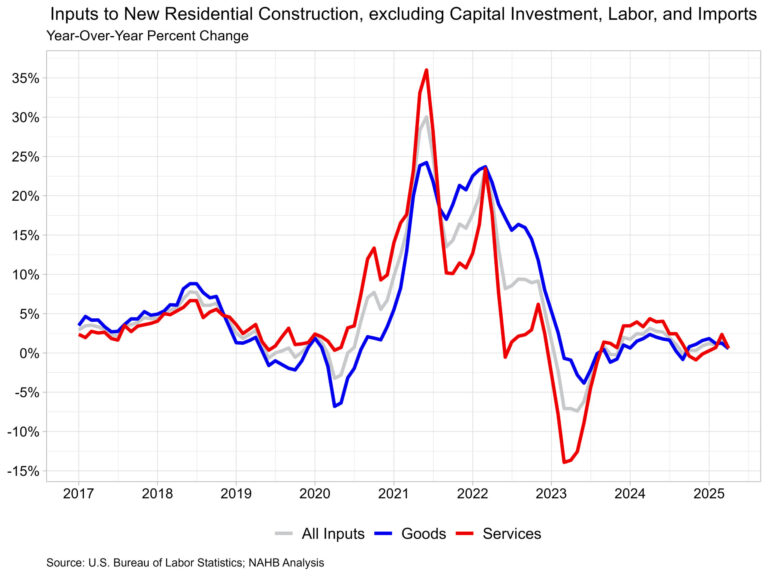

Prices for inputs to new residential construction—excluding capital investment, labor, and imports—were up 0.6% in March according to the most recent Producer Price Index (PPI) report published by the U.S. Bureau of Labor Statistics. The increase in February was revised upward to 0.7%. The Producer Price Index measures prices that domestic producers receive for their goods and services; this differs from the Consumer Price Index which measures what consumers pay and includes both domestic products as well as imports.

The inputs to the New Residential Construction Price Index grew 1.3% from March of last year. The index can be broken into two components—the goods component also increased 1.3% over the year, with services increasing 1.3% as well. For comparison, the total final demand index, which measures all goods and services across the economy, increased 2.7% over the year, with final demand with respect to goods up 0.9% and final demand for services up 3.6% over the year.

Input Goods

The goods component has a larger importance to the total residential construction inputs price index, representing around 60%. For the month, the price of input goods to new residential construction was up 0.5% in March.

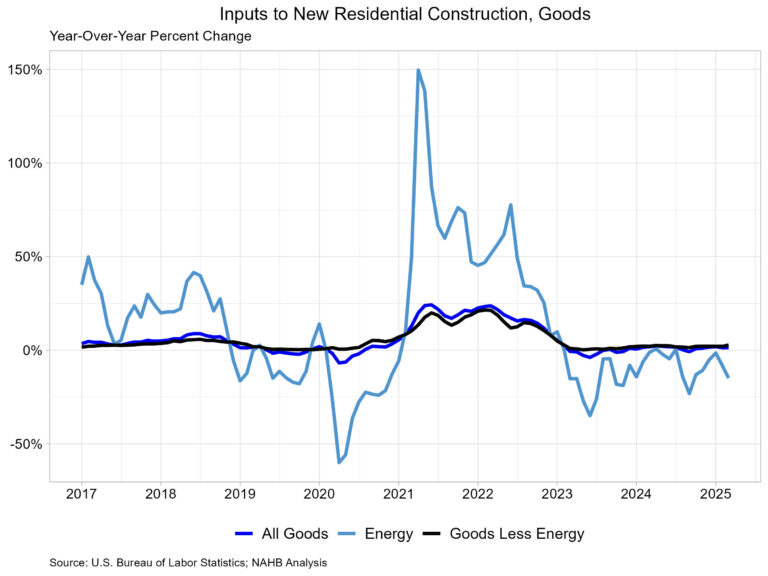
The input goods to residential construction index can be further broken down into two separate components, one measuring energy inputs with the other measuring goods less energy inputs. The latter of these two components simply represents building materials used in residential construction, which makes up around 93% of the goods index.

Energy input prices fell 3.9% between February and March and were 14.9% lower than one year ago. Building material prices were up 0.8% between February and March and up 2.7% compared to one year ago. Energy costs have continued to fall on a year-over-year basis, as this marks the eighth consecutive month of lower input energy costs.

Metal products used in residential construction saw the largest price increases in the month of March. Across all inputs to new residential construction, ornamental and architectural metal work increased the most, up 21.0%. Ornamental and architectural metal work products increased 11.2% on a month-to-month basis, by far their largest monthly increase for the product, with the next closes being 7.9% back in October of 2021.

Input Services

While prices of inputs to residential construction for services were down 0.1% over the year, they were up 1.1% in March from February. The price index for service inputs to residential construction can be broken out into three separate components: a trade services component, a transportation and warehousing services component, and a services excluding trade, transportation and warehousing component (other services). The most significant component is trade services (around 60%), followed by other services (around 29%), and finally transportation and warehousing services (around 11%). The largest component, trade services, was up 0.7% from a year ago. The other services component was up 1.6% over the year. Lastly, prices for transportation and warehousing services advanced 3.6% compared to March last year.

Discover more from Eye On Housing

Subscribe to get the latest posts sent to your email.


This article was originally published by a eyeonhousing.org . Read the Original article here. .
Pin It
