Tag

June

Browsing


State labor market conditions softened in June as hiring slowed across much of the country. While a majority of states recorded payroll employment gains during the month, national job growth moderated and employment declines remained widespread in several states. Construction employment continued to expand modestly, though performance varied considerably by state, reflecting ongoing differences in regional economic activity and building conditions.

In June, nonfarm payroll employment increased in 33 states and District of Columbia (D.C.). compared to May, while 17 states recorded declines. According to the Bureau of Labor Statistics, total U.S. nonfarm payroll employment rose by 57,000 jobs in June, following an increase of 129,000 jobs in May.

On a month-over-month basis, employment gains were led by Texas (+43,400), followed by Minnesota (+13,200), and Florida (+11,100). In contrast, the 17 states that recorded losses collectively shed 38,400 jobs, with Georgia posting the largest decline (-10,100). In percentage terms, New Hampshire recorded the strongest increase (+0.6%), while West Virginia experienced the largest decrease (-1.2%) between May and June.

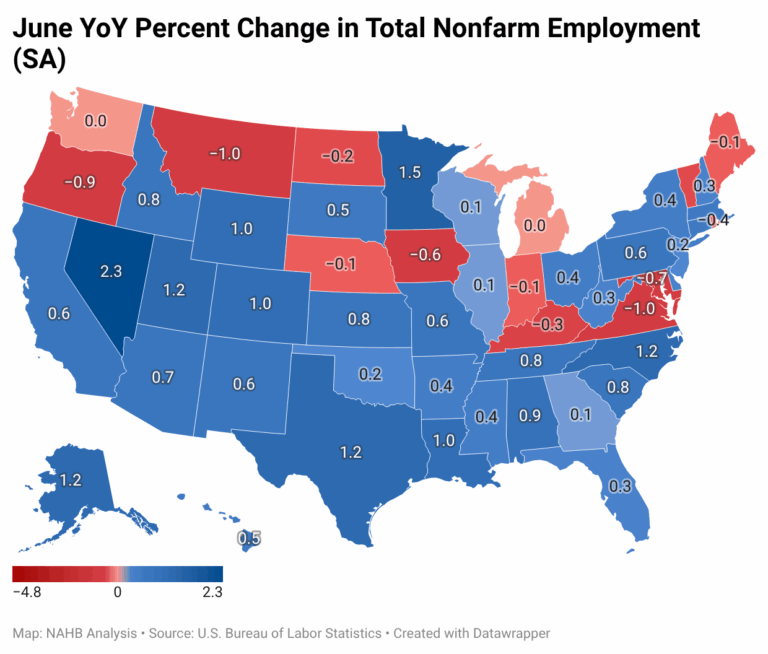
Over the 12 months ending in June, total nonfarm employment increased by 506,000 jobs nationwide, representing a 0.3% gain. Job gains ranged from 500 in Michigan to 177,900 in Texas. Collectively, 12 states and D.C. lost 147,500 jobs over the past 12 months, with Virginia recording the largest decline (-43,600).

In percentage terms, job growth ranged from 0.1% in Illinois, Georgia, and Wisconsin to 2.3% in Nevada. Washington and Michigan reported no change during the past 12 months. Among states experiencing employment declines, losses ranged from 0.1% in Maine, Nebraska, and Indiana to 1.0% in Virginia and Montana. D.C., however, recorded a substantially larger decline of 4.8%.

Construction Employment

Construction employment —which includes both residential and non-residential construction, posted gains in June. Twenty-eight states and D.C. added construction jobs compared to May, while 20 states lost jobs; two states reported no change. Texas recorded the largest monthly gain (+5,200), while California recorded the largest loss (-4,100). Overall, the construction sector added a net 11,000 jobs nationwide in June. In percentage terms, New Mexico recorded the strongest monthly increase (+3.2%), while Montana experienced the steepest decline (-1.6%).

Year-over-year, construction employment increased by 64,000 jobs nationwide, a 0.8% gain compared to June 2025. Texas led all states with an increase of 24,800 construction jobs, while California recorded the largest loss (-15,400). In percentage terms, Louisiana posted the strongest annual growth in construction employment (+7.7%), while New Hampshire experienced the largest decline (-2.5%).

State Unemployment Rate

The state unemployment rate is a key indicator of labor market conditions, measuring the share of the labor force that is actively seeking work but unable to find employment. Higher unemployment rates generally signal weaker economic conditions, while lower rates indicate tighter labor markets that may contribute to upward wage pressures.

South Dakota recorded the nation’s lowest unemployment rate at 2.0%, while D.C. posted the highest rate at 6.0%. The elevated unemployment rate in D.C. reflects significant federal workforce reductions and layoffs that occurred during 2025. North Dakota, Hawaii, Vermont, New Hampshire, and Nebraska also reported unemployment rates below 3.0%. Meanwhile, Michigan, Illinois, Nevada, California, Connecticut, Oregon, and Washington recorded unemployment rates of 5.0% or higher.


This article was originally published by a eyeonhousing.org . Read the Original article here. .
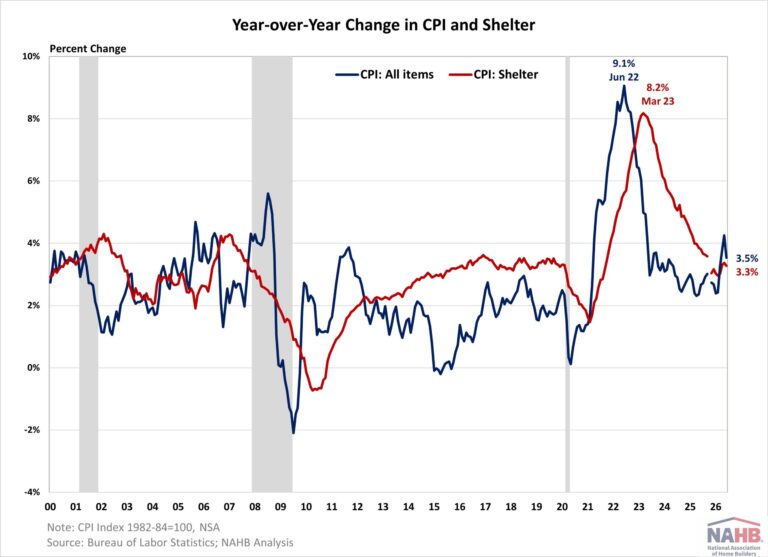

Inflation slowed to 3.5% in June from a three-year high last month, driven by a mid-June ceasefire agreement that stabilized oil markets and lowered energy prices. The decline in energy prices offset increases in shelter and food, resulting in a monthly decrease in inflation for the first time since April 2020. However, the relief could be short-lived as the ceasefire collapsed in early July has pushed oil prices up by 12% and renewed inflation concerns. 

On a non-seasonally adjusted basis, the Consumer Price Index (CPI) rose by 3.5% in June from a year ago, following a 4.2% increase last month, according to the BLS latest report. The “core” CPI, excluding the volatile food and energy components, increased by 2.6% over the past twelve months, following a 2.9% increase in May. The housing shelter index, which makes up a large portion of “core” CPI, rose 3.3% over the year, following a 3.4% increase last month. Meanwhile, the component index for food rose by 3.0%, and the energy component index increased by 15.7%.

On a monthly basis, the CPI fell by 0.4% in June (seasonally adjusted), while the “core” CPI remained unchanged.

The price index for a broad set of energy sources decreased by 5.7% in June, with decreases in gasoline (-9.7%), fuel oil (-9.2%), and electricity (-1.0%), with a minor increase in natural gas (+0.5%). Meanwhile, both food at home and food away from home indexes rose by 0.2 in June.

Outside of energy, other top contributors that fell in June included indexes for motor vehicle insurance (-2.0%), communication (-1.5%), apparel (-0.6%), medical care (-0.1%) and used cars and trucks (-0.2%). Meanwhile, the index for recreation (+0.5%), household furnishings and operations (+0.2%), and personal care (+0.2%) were among the few major indexes that increased over the month.

The index for shelter, which makes up more than 40% of the “core” CPI, rose by 0.1% in June, the smallest monthly increase since January 2021. The index for owners’ equivalent rent (OER) rose by 0.2%, while the index for rent of primary residence (RPR) increased by 0.1% over the month.

NAHB constructs a “real” rent index to indicate whether inflation in rents is faster or slower than core inflation. It provides insight into the supply and demand conditions for rental housing. When inflation in rents is rising faster than core inflation, the real rent index rises and vice versa. The real rent index is calculated by dividing the price index for rent by the core CPI (to exclude the volatile food and energy components). In June, the Real Rent Index rose by 0.1%.


This article was originally published by a eyeonhousing.org . Read the Original article here. .


After reaching a five-month high last month, existing home sales pulled back in June as record-high home prices and elevated mortgage rates weighed on buyers. This monthly volatility reflects the sensitivity of home buyer demand to mortgage rate changes. Mortgage rates, though lower than a year ago, have increased more than 50 basis points since the Iran war began in late February and remain stuck around 6.5% in recent weeks. Energy shock has reaccelerated inflation, which has outpaced wage growth, further weighing on housing affordability.

Total existing home sales, including single-family homes, townhomes, condominiums, and co-ops, fell 2.4% to a seasonally adjusted annual rate of 4.09 million in June, according to the National Association of Realtors (NAR). On a year-over-year basis, sales were 2.8% higher from a year ago.

The existing home inventory level was 1.56 million units in June, down 0.6% from May but up 1.3% from a year ago. At the current sales rate, June unsold inventory sits at a 4.6-months’ supply, up from 4.5-months in May and unchanged from a year ago. Inventory between 4.5 to 6 months’ supply is generally considered a balanced market.

Homes stayed on the market for a median of 28 days in June, down from 29 days in the previous month but up from 27 days in June 2025.

The first-time buyer share was 33% in June. The share was down from 35% in May but up from 30% a year ago.

The June all-cash sales share was 25% of transactions, unchanged from last month but down from 29% in June 2025. All-cash buyers are less affected by changes in interest rates.

The June median sales price of all existing homes was $440,600, up 1.8% from last year. This marks the 36th consecutive month of year-over-year increases and reaches an all-time high. The median condominium/co-op price in June was up 1.6% from a year ago at $380,000. Recent gains for home inventory will put downward pressure on resale home prices in most markets in 2026.

Existing home sales in June were mixed across the four major regions. Sales fell in the South (-3.6%), Midwest (-3.0%) and West (-1.3%) but rose in the Northeast (+2.1%). On a year-over-year basis, sales increased in the South (+3.8%), West (+2.8%) and Midwest (+2.1%) but remained unchanged in Northeast.

The Pending Home Sales Index (PHSI) is a forward-looking indicator based on signed contracts. The PHSI rose from 74.0 to 76.8 in May, the highest level since November 2025. On a year-over-year basis, pending sales were 4.8% higher than a year ago, according to the National Association of Realtors’ data.


This article was originally published by a eyeonhousing.org . Read the Original article here. .


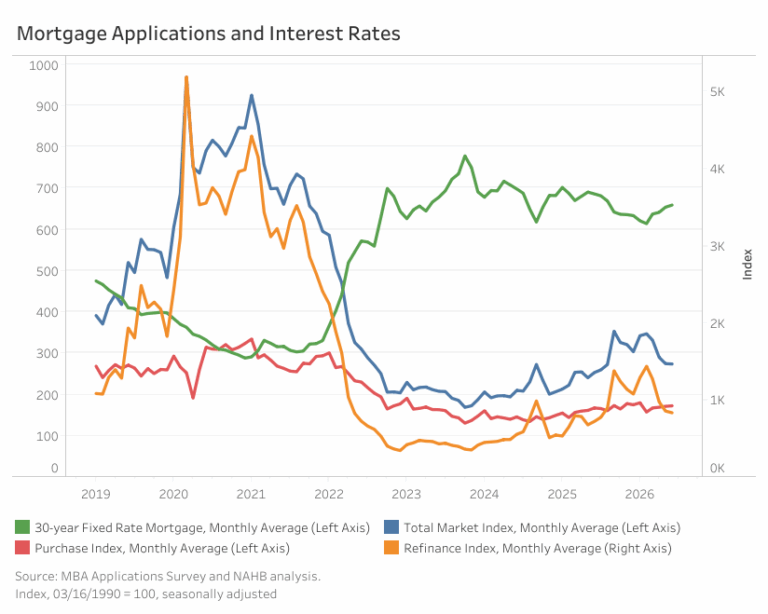
Mortgage applications stalled in June as higher mortgage rates dampened market activity. The Mortgage Bankers Association’s (MBA) Market Composite Index, a measure of total mortgage application volume, stayed relatively unchanged with a marginal decrease of 0.3% month-over-month on a seasonally adjusted basis. The decline was driven by a 2.5% decline in refinancing applications, which offset a modest 0.7% gain in purchase applications. Compared with a year earlier, however, total mortgage application activity remained 7.9% higher, with refinance applications up 15.6% and purchase applications rising 3.1%. Meanwhile, applications for adjustable-rate mortgages (ARM) decreased 9.4% over the month, bringing the ARM share of total applications to 8.2%.

The average contract rate for a 30-year fixed-rate mortgage increased 5 basis points (bps) to 6.59% in June, as markets priced in inflation risks and the possibility of the Federal Reserve increasing rates this year. Nonetheless, the rate remained 27 bps lower than its level a year ago.

By loan type, applications for ARMs decreased 9.4%, while fixed-rate mortgages (FRMs) increased about 0.4% from the previous month. On a year-over-year basis, applications for FRM and ARMs were up 6.9% and 22.4%, respectively. As of June 2026, the share of ARMs applications was down 0.8 percentage points from the prior month to 8.2% on a non-seasonally adjusted basis (NSA). Compared to a year ago, ARMs share were 0.6 percentage points higher. The average contract interest rate for 5/1 ARMs was 5.8% in June.

Loan sizes decreased across most categories in June, with ARM loans being the only exception. Consequently, the overall average loan size declined 3.4% to $393,800. The average purchase and refinance loan sizes decreased 1.8% to $456,500, and 5.8% to $302,500, respectively. The average ARM loan size edged up 0.8% to $944,800.


This article was originally published by a eyeonhousing.org . Read the Original article here. .


Mortgage rates continued to increase in June as markets priced in a rate hike due to high inflation and stronger-than-expected labor market. According to Freddie Mac, the 30-year fixed-rate mortgage averaged 6.49% in June, up 8 basis points (bps) over May. Since the conflict in the Middle East began, the 30-year mortgage rate has increased by 44 basis points. The average 15-year rate averaged 5.82% in June, up 8 bps from May, and up 39 basis points since the end of February. Even so, both rates remain lower than a year ago by 33 bps and 13 bps, respectively.

The 10-year Treasury yield, a key benchmark for long-term borrowing, held steady at an average of 4.48% in June. The 10-year yield surpassed 4.5% in the second week of the month following reports of persistent high inflation and a surprisingly resilient labor market. Furthermore, the latest Federal Open Market Committee (FOMC) meeting revealed that nine out of 18 Fed officials indicated at least one rate hike within the year.

Nonetheless, the 10-year Treasury yield eased later in the month, ending June at around 4.44%, as the United States and Iran reached a preliminary agreement and signed a Memorandum of Understanding (MoU). The agreement temporarily reopened the Strait of Hormuz to commercial shipping on a “toll-free” basis through mid-August to facilitate further negotiations over Iran’s nuclear program.


This article was originally published by a eyeonhousing.org . Read the Original article here. .


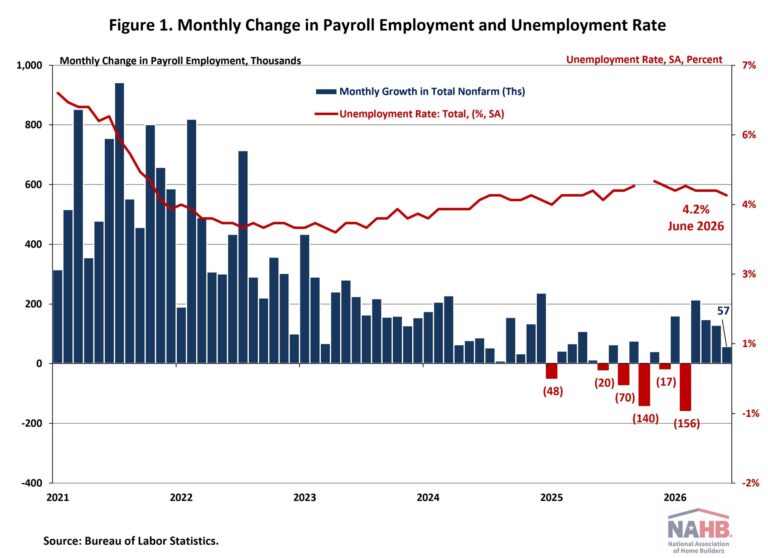
The U.S. labor market lost momentum in June, with total nonfarm payroll employment rising by just 57,000, the smallest gain since February’s outright decline. Downward revisions to April and May payroll estimates subtracted a combined 74,000 jobs from previously reported totals, reversing the sizable upward revisions reported a month earlier and suggesting underlying hiring momentum was weaker than initially reported. The unemployment rate edged down to 4.2%, essentially unchanged from a year ago, but the decline reflected a shrinking labor force rather than stronger hiring, as both overall and prime-age labor force participation fell notably in June.

Wage growth accelerated modestly in June. Average hourly earnings rose 3.5% from a year earlier to $37.64, up from a 3.4% year-over-year pace in May. This pace is 0.3 percentage points lower than a year ago. Importantly, wage growth has been outpacing inflation for nearly two years, which typically occurs as productivity increases.

National Employment

According to the Employment Situation Summary reported by the Bureau of Labor Statistics (BLS), total nonfarm payroll employment increased by 57,000 in June, following a downwardly revised gain of 129,000 in May. Revisions to prior months were broadly negative this month, a reversal from May’s positive trend. The change for April was revised down by 31,000, from +179,000 to +148,000, while the change for May was revised down by 43,000, from a preliminary +172,000 to +129,000. Combined, these revisions subtracted 74,000 jobs from previously reported totals, compared with the 93,000 upward revisions reported in the prior month.

Job growth in 2026 has moderated following a stronger spring. Through June, monthly payroll gains have averaged 92,000 on the current data vintage, down from the 114,000 pace reported through May, reflecting both June’s soft print and the downward revisions to April and May. This compares with an average of just 10,000 per month in 2025 and 122,000 per month in 2024. Over the past 12 months, total nonfarm employment has grown by 506,000, a considerably slower pace of expansion than earlier in the cycle.

The unemployment rate declined to 4.2% in June from 4.3% in May, essentially matching its year-ago level of 4.1%. However, the improvement was driven by a shrinking labor force rather than stronger hiring. Over the month, the number of unemployed persons fell by 213,000 to 7.1 million, while the number of employed persons declined by 507,000. Combined, the civilian labor force contracted by 720,000 in June.

Meanwhile, the labor force participation rate—the proportion of the population either looking for a job or already holding a job—fell 0.3 percentage points to 61.5% in June. This marks the lowest level since March 2021 and remains well below its pre-pandemic level of 63.3% recorded at the start of 2020. Among prime working-age individuals (aged 25 to 54), the participation rate dropped 0.6 percentage points to 83.3%, one of the sharpest single-month declines of this cycle and an indication that June’s pullback in labor force participation was not confined to either younger or older workers.

Job gains in June were concentrated in a handful of sectors. Employment increased by 36,000 in professional and business services, 25,000 in social assistance, and 22,000 in health care. In contrast, leisure and hospitality shed 61,000 jobs, reflecting weaker than usual seaonal hiring.

Construction Employment

Employment in the overall construction sector rose by 11,000 jobs in June, following a gain of 6,000 in May. Within the industry, residential construction employment declined by 8,600, while non-residential construction added approximately 19,900 jobs.

Residential construction employment now stands at 3.3 million in June, including 916,000 workers employed by builders and remodelers and 2.4 million residential specialty trade contractors.

The six-month moving average of job gains for residential construction employment remains negative, reflecting an average monthly loss of 3,517 jobs and declines in four of the past six months. Over the last 12 months, residential construction has shed a net of 48,800 jobs, marking the sixteenth consecutive month of annual decline and the longest stretch of annual losses since the Great Recession. However, residential construction has gained 1,283,400 positions from its post-Great Recession low.

Meanwhile, the unemployment rate for construction workers rose to 6.2% in June on a seasonally adjusted basis, up from 5.2% in May and 3.7% in April. This marks the second consecutive monthly increase and the highest reading since July 2021. A year earlier, the construction unemployment rate stood at 4.5%. The continued increase suggests softness in construction labor market conditions.


This article was originally published by a eyeonhousing.org . Read the Original article here. .


Consumer confidence inched up in June due to improved views of business conditions and recent declines in oil prices easing inflation fears. However, the consumers’ view of the labor market continued to weaken, despite recent strong job reports; The share of respondents saying jobs are ‘hard to get’ reached a five-and-a-half-year high. The labor market differential, which measures the gap between consumers viewing jobs as plentiful and hard-to-get, remained narrow and reached its lowest level since February 2021. Overall, consumer confidence remains well below pre-pandemic levels.

The Consumer Confidence Index, reported by the Conference Board, is a survey measuring how optimistic or pessimistic consumers feel about their financial situation. This index rose from 90.6 to 91.2 in June. The Consumer Confidence Index consists of two components: how consumers feel about their present situation and their expected situation. In June, the Present Situation Index decreased 3.0 points to 116.4, the lowest level since February 2021; the Expectation Situation Index increased 3.0 points  to 74.4, the highest level this year. This is the seventeenth consecutive month for which the Expectation Index has been below 80, a threshold that often signals a recession within a year.

Consumers’ assessment of current business conditions improved in June. The share of respondents rating business conditions as “good” increased by 0.8 percentage points to 20.0%, while those claiming business conditions as “bad” fell by 0.2 percentage points to 16.5%. Meanwhile, consumers’ assessments of the labor market were mixed in June. The share of respondents reporting that jobs were “plentiful” rose by 0.1 percentage points to 24.9%; meanwhile, those who saw jobs as “hard to get” increased by 2.7 percentage points to 22.5%, the highest level since January 2021.

Consumers were more optimistic about the short-term outlook. The share of respondents expecting business conditions to improve rose from 18.8% to 19.0%, while those expecting business conditions to deteriorate decreased from 23.2% to 20.3%. However, expectations of employment over the next six months were unchanged. The share of respondents expecting “more jobs” fell from 16.6% to 15.2%, and those anticipating “fewer jobs” declined by 1.4 percentage points to 25.6%.

The Conference Board also reported the share of respondents planning to buy a home within six months. The share of respondents planning to buy a home rose slightly to 6.6% in June. Of those, the shares planning to buy a newly constructed home and an existing home were unchanged at 0.7% and 3.0%, respectively. The remaining 2.9% were planning to buy a home but were undecided between new or existing homes.


This article was originally published by a eyeonhousing.org . Read the Original article here. .


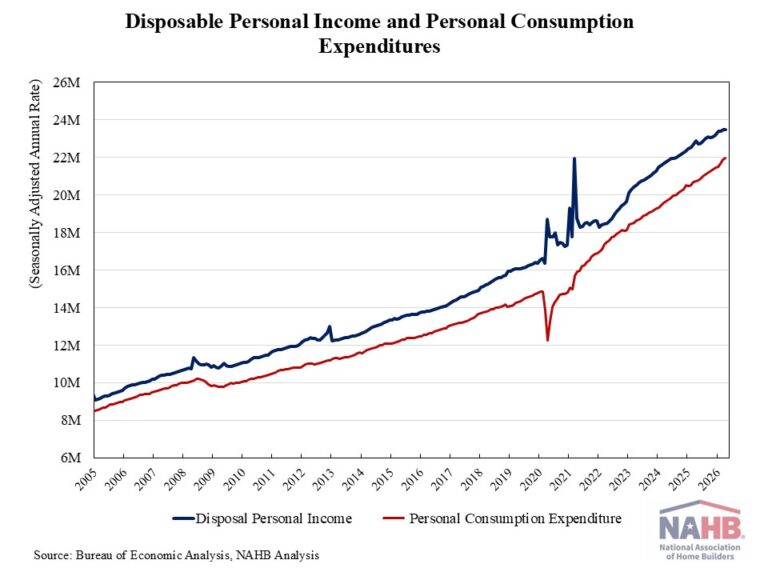
Personal income was essentially unchanged in April 2026, following a 0.5% gain in March, according to the latest data from the Bureau of Economic Analysis. On a year-over-year basis, personal income was 2.5% higher than in April 2025. As consumer spending outpaced income growth, the personal saving rate fell to 2.6%, the lowest level since June 2022. This data point implies households are drawing more heavily on savings to support spending.

Real disposable income, the amount remaining after adjusted for taxes and inflation, was down 0.5% in April, the third consecutive monthly decline. On a year-over-year basis, real (inflation-adjusted) disposable income fell 1.1%, reversing the positive trend seen earlier this year. The Iran war pushed up energy prices, while inflation surged to nearly two-year high in March.

Personal consumption expenditure rose 0.5% in April, following a 1% increase in March. Real spending (adjusted to remove inflation) increased 0.1% in April, with expenditure goods declining 0.2% and spending on services up 0.2%.

With spending growth outpacing income growth, the personal saving rate decreased to 2.6% in April, the lowest level since late 2022, when core CPI was around the peak. With inflation eroding compensation gains, households are dipping into savings to support spending, especially amid higher energy costs following the start of the Iran war.


This article was originally published by a eyeonhousing.org . Read the Original article here. .


Single-family housing permits continued a downhill trend for the sixth month in a row. The continuous decline in single-family permits highlights persistently weak housing demand, tied to affordability challenges like high mortgage rates. Builders appear cautious amid economic uncertainty, labor constraints, and rising inventories. The uptick in multi-family permits suggests a potentially stabilizing trend, though it’s important to note its volatility. The housing market’s mixed signals—weak single-family coupled with some resilience in multi-family—could mean continued drag on residential investment and the broader economy this year.

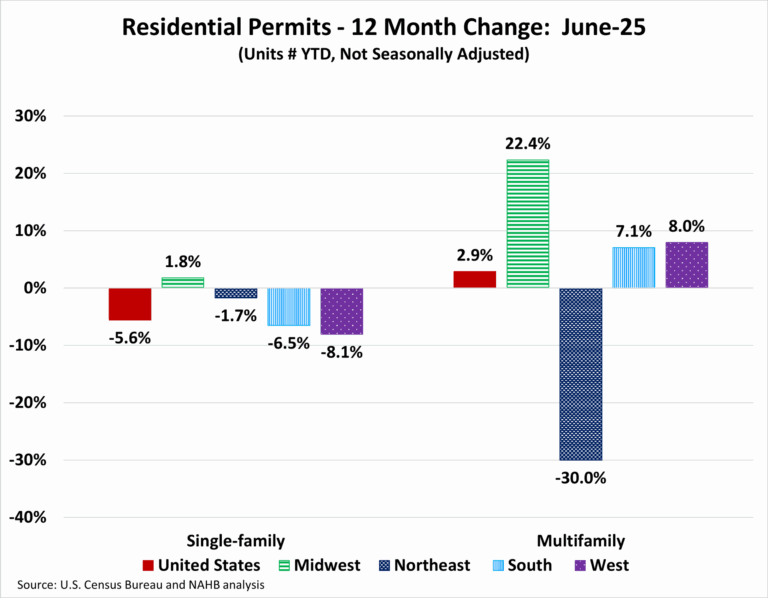
Over the first six months of 2025, the total number of single-family permits issued year-to-date (YTD) nationwide reached 485,935. On a year-over-year (YoY) basis, this is a decline of 5.6% over the June 2024 level of 514,728. For multifamily, the total number of permits issued nationwide reached 244,812. This is 2.9% higher compared to the June 2024 level of 237,935.

Year-to-date ending in June, single-family permits were up in one out of the four regions. The Midwest posted a small increase of 1.8%. The Northeast was 1.7% lower, the South was down by 6.5%, and the West was down by 8.1% in single-family permits during this time. For multifamily permits, three out of the four regions posted increases. The Midwest was up by 22.4%, the West was up by 8.0%, and the South was up by 7.1%, Meanwhile, the Northeast declined steeply by 30.0%, driven by the New York-Newark-Jersey City, NY-NJ MSA which declined by 40.0%.

Between June 2025 YTD and June 2024 YTD, 15 states posted an increase in single-family permits. The range of increases spanned 19.9% in Hawaii to 0.2% in Kentucky. The remaining 35 states and the District of Columbia reported declines in single-family permits with the District of Columbia reporting the steepest decline of 24.2%.

The ten states issuing the highest number of single-family permits combined accounted for 63.0% of the total single-family permits issued. Texas, the state with the highest number of single-family permits, issued 78,104 permits over the first six months of 2025; this is a decline of 8.0% compared to the same period last year. The second highest state, Florida, decreased by 10.6%, while the third highest, North Carolina, posted a decline of 0.9%.

Between June 2025 YTD and June 2024 YTD, 29 states recorded growth in multifamily permits, while 21 states and the District of Columbia recorded a decline. Iowa (+165.5%) led the way with a sharp rise in multifamily permits from 1,178 to 3,128, while Alabama had the largest decline of 49.6% from 1,788 to 901.

The ten states issuing the highest number of multifamily permits combined accounted for 61.8% of the multifamily permits issued. Over the first six months of 2025, Florida, the state with the highest number of multifamily permits issued, experienced an increase of 25.0%. Texas, the second-highest state in multifamily permits, saw an increase of 14.1%. California, the third largest multifamily issuing state, increased by 11.5%.

At the local level, below are the top ten metro areas that issued the highest number of single-family permits.

For multifamily permits, below are the top ten local areas that issued the highest number of permits.

Discover more from Eye On Housing

Subscribe to get the latest posts sent to your email.


This article was originally published by a eyeonhousing.org . Read the Original article here. .

Private residential construction spending fell by 0.7% in June, marking the sixth straight month of decreases. This decline was primarily driven by reduced spending on single-family construction. Compared to a year ago, total spending was down 6.2%, as the housing sector continues to navigate the economic uncertainty stemming from ongoing tariff concerns and elevated mortgage rates. 

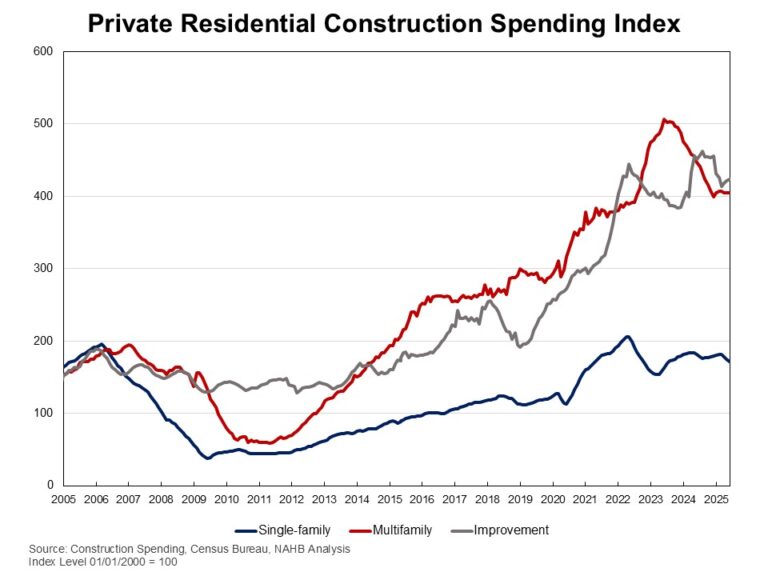
According to the latest U.S. Census Construction Spending data, single-family construction spending declined by 1.8% in June. This decrease aligns with the weak single-family starts in June and the third lowest reading of NAHB/Wells Fargo Housing Market Index (HMI) since 2012. Compared to a year ago, single-family construction spending decreased by 5.3%. Meanwhile, multifamily construction spending stayed flat for the month but continued to follow the downward trend that began in mid-2023. Compared to June 2024, multifamily spending was down 9.5%. Improvement spending (remodeling) was up 0.5% in June but was 6.1% lower on a year-over-year basis.  

The NAHB construction spending index is shown in the graph below. The index illustrates how   spending on single-family construction has slowed since early 2024 under the pressure of elevated interest rates and concerns over building material tariffs. Multifamily construction spending growth has also slowed down after the peak in July 2023. Additionally, improvement spending has been weakening since the beginning of 2025.


Meanwhile, spending on private nonresidential construction was down 4% over a year ago. The annual private nonresidential spending decrease was primarily driven by a $14.7 billion drop in the manufacturing category, followed by a $13.7 billion decrease in commercial construction spending.

Discover more from Eye On Housing

Subscribe to get the latest posts sent to your email.


This article was originally published by a eyeonhousing.org . Read the Original article here. .

Pin It