Tag

Increased

Browsing


Mortgage rates continued to increase in June as markets priced in a rate hike due to high inflation and stronger-than-expected labor market. According to Freddie Mac, the 30-year fixed-rate mortgage averaged 6.49% in June, up 8 basis points (bps) over May. Since the conflict in the Middle East began, the 30-year mortgage rate has increased by 44 basis points. The average 15-year rate averaged 5.82% in June, up 8 bps from May, and up 39 basis points since the end of February. Even so, both rates remain lower than a year ago by 33 bps and 13 bps, respectively.

The 10-year Treasury yield, a key benchmark for long-term borrowing, held steady at an average of 4.48% in June. The 10-year yield surpassed 4.5% in the second week of the month following reports of persistent high inflation and a surprisingly resilient labor market. Furthermore, the latest Federal Open Market Committee (FOMC) meeting revealed that nine out of 18 Fed officials indicated at least one rate hike within the year.

Nonetheless, the 10-year Treasury yield eased later in the month, ending June at around 4.44%, as the United States and Iran reached a preliminary agreement and signed a Memorandum of Understanding (MoU). The agreement temporarily reopened the Strait of Hormuz to commercial shipping on a “toll-free” basis through mid-August to facilitate further negotiations over Iran’s nuclear program.


This article was originally published by a eyeonhousing.org . Read the Original article here. .


A new NAHB study shows that, on average, regulations imposed by government at all levels account for $131,734, or 26.4%, of the final price of a new single-family home built for sale. Of this amount, $46,795 is due to a higher price for the finished lot, attributable to regulations imposed during the lot’s development. The remaining $84,939 is the result of regulatory costs imposed on the builder during construction, after the builder purchases the finished lot.

The individual line items in the above figure range from under $2,000 per home for the pure cost of delay during the construction phase of the project, to more than $40,000 for changes in building codes over the past 10 years.

Results show that the cost of regulation climbed at its fastest rate between consecutive surveys. The current estimate of $131,734 is over 40% higher than the $93,871 figure from the 2021 study, and more than double the NAHB’s initial estimate of $65,224 back in 2011.

The estimate of $46,795 in regulatory costs incurred during lot development is based largely on the “Land Developer Survey on Regulatory Costs” conducted by NAHB in March of 2026. The $84,939 estimate of regulatory costs during the construction phase is based largely on questions in the March 2026 survey for the NAHB/Wells Fargo Housing Market Index (HMI). Data from the two surveys were combined with information on average construction times, interest rates, profit margins etc. to produce estimates of regulatory costs as a percentage—either of the price of a lot purchased by a builder, or of the builder’s narrowly defined cost of construction. The percentages were then converted to dollars using the January 2026 average new home price of $499,500 from the first release of the U.S. Census Bureau’s New Residential Sales report. For more information on the methodology, including both survey questionnaires and a complete documentation of all other information incorporated into the estimates, please consult the full study.

Regulatory costs are one of several factors, including record increases of tariff rates on building materials, ongoing skilled labor shortage, a dearth of available lots and tighter lending conditions, currently limiting the supply of housing—particularly housing for the entry-level market, where additional inventory is most needed.


This article was originally published by a eyeonhousing.org . Read the Original article here. .


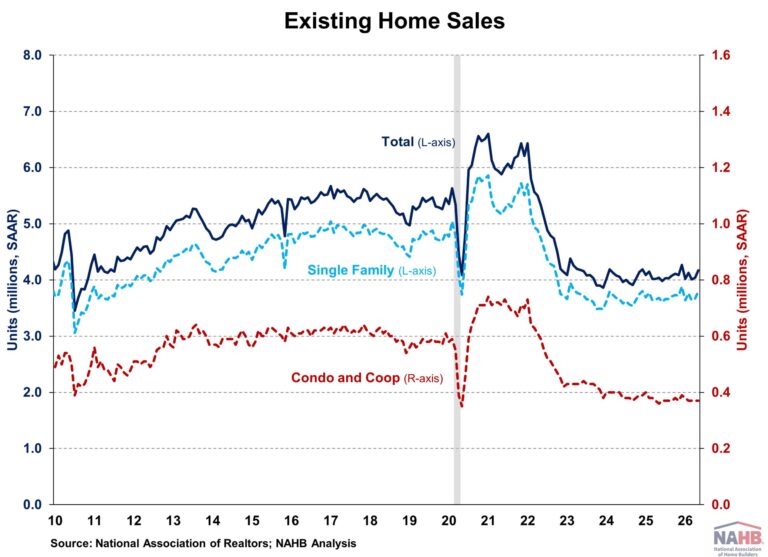
Existing home sales rose to a five-month high in May as more first-time buyers stepped back into the market. The share of first-time buyer reached 35% in May, the highest since June 2020. However, sales remained weak compared to historical norms, with still-tight inventory continued to push up home prices. Mortgage rates, though lower than a year ago, have increased more than 50 basis points since the Iran war began in late February and remain stuck around 6.5% in recent weeks. Energy shock has reaccelerated inflation, which has outpaced wage growth, further weighing on housing affordability.

Total existing home sales, including single-family homes, townhomes, condominiums, and co-ops, rose 3.2% to a seasonally adjusted annual rate of 4.17 million in May, the highest since December 2025, according to the National Association of Realtors (NAR). On a year-over-year basis, sales were 3.2% higher from a year ago.

The existing home inventory level was 1.55 million units in May, up 3.3% from April and 0.6% from a year ago. At the current sales rate, May unsold inventory sits at a 4.5-months’ supply, unchanged from April but lower than 4.6-months a year ago. Inventory between 4.5 to 6 months’ supply is generally considered a balanced market.

Homes stayed on the market for a median of 29 days in May, down from 32 days in the previous month but up from 27 days in May 2025.

The first-time buyer share was 35% in May, the highest share in nearly six years. The share was up from 33% in April and 30% a year ago.

The May all-cash sales share was 25% of transactions, unchanged from last month but down from 27% in May 2025. All-cash buyers are less affected by changes in interest rates.

The May median sales price of all existing homes was $429,300, up 1.3% from last year. This marks the 35th consecutive month of year-over-year increases. The median condominium/co-op price in March was up 1.7% from a year ago at $378,200. Recent gains for home inventory will put downward pressure on resale home prices in most markets in 2026.

Existing home sales in May were mixed across the four major regions. Sales rose in the Midwest (+6.4%), South (+3.2%) and Northeast (+2.2%) but remained unchanged in the West. On a year-over-year basis, sales declined in the Northeast (-8.0%) but increased in the South (+5.9%), West (5.6%) and Midwest (2.0%).

The Pending Home Sales Index (PHSI) is a forward-looking indicator based on signed contracts. The PHSI rose from 73.8 to 74.8 in April. PHSI data is typically released about a week after existing home sales reports. On a year-over-year basis, pending sales were 3.2% higher than a year ago, according to the National Association of Realtors’ data. However, resurgence in mortgage rates driven by the Iran war could reverse the increase.


This article was originally published by a eyeonhousing.org . Read the Original article here. .


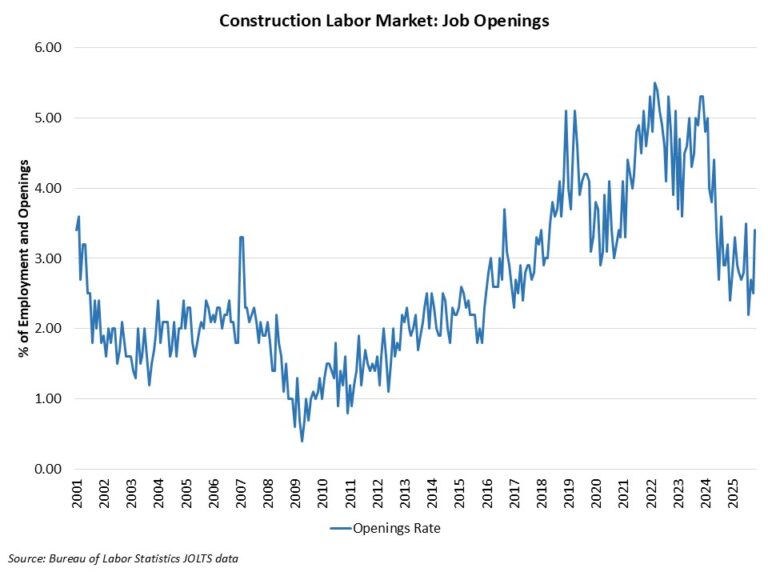
The count of open, unfilled positions in the construction industry increased in November, per the delayed Bureau of Labor Statistics Job Openings and Labor Turnover Survey (JOLTS). The current level of open jobs is down measurably from two years ago due to declines in construction activity, particularly in housing.

The number of open jobs for the overall economy declined as the labor market weakened at the end of 2025, falling from 7.449 million in October to 7.146 million in November. The November reading was down from a year ago (8.031 million).

Previous NAHB analysis indicated that this number had to fall below eight million on a sustained basis for the Federal Reserve to move forward on interest rate reductions. With estimates remaining below eight million for national job openings, the Fed, in theory, should be able to cut further.

The number of open construction sector jobs increased from 202,000 in October to 292,000 in November. This total is relatively stable compared to a year ago (272,000), although the reading is notably lower than two years ago. The chart below notes the declining trend that has been in place for unfilled construction jobs since the Fed raised the federal funds rate and home building weakened. While home building employment was declining during the second half of 2025, other subsectors of the construction industry have expanded (e.g. data centers).

The construction job openings rate increased to 3.4% in November, higher than the 3.2% rate estimated a year ago.

The layoff rate in construction declined to 1.7% in November. The quits increased to 1.5% for the month.


This article was originally published by a eyeonhousing.org . Read the Original article here. .


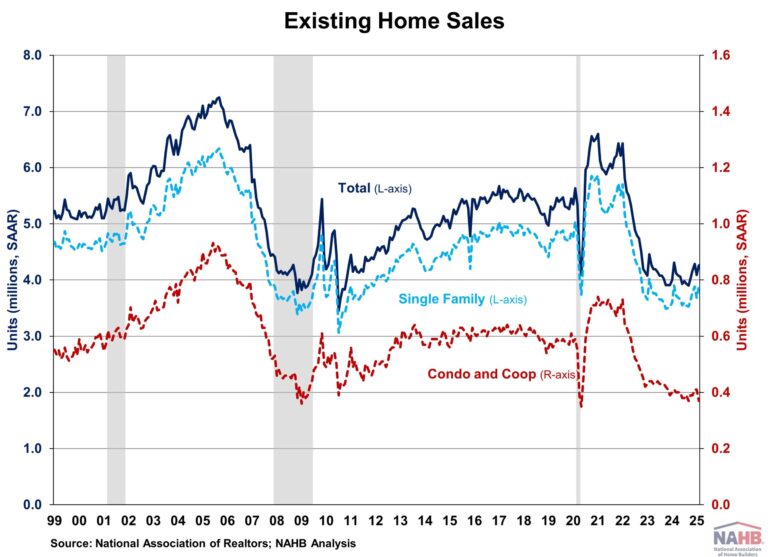
Existing home sales in February increased to the second highest level since March 2024, according to the National Association of Realtors (NAR). This rebound suggests buyers are slowly entering the market as inventory improves and mortgage rates decline from recent high in January. Despite rates easing, economic uncertainty may continue to constrain buyer activity.

While existing home inventory improves and the Fed continues lowering rates, the market faces headwinds as mortgage rates are expected to stay above 6% for longer due to an anticipated slower easing pace in 2025. These prolonged rates may continue to discourage homeowners from trading existing mortgages for new ones with higher rates, keeping supply tight and prices elevated. As such, sales are likely to remain limited in the coming months due to elevated mortgage rates and home prices.

Total existing home sales, including single-family homes, townhomes, condominiums, and co-ops, rose 4.2% to a seasonally adjusted annual rate of 4.26 million in February. On a year-over-year basis, sales were 1.2% lower than a year ago.

The first-time buyer share was 31% in February, up from 28% in January and 26% from a year ago.

The existing home inventory level was 1.24 million units in February, up from 1.18 million in January, and up 17.0% from a year ago. At the current sales rate, February unsold inventory sits at a 3.5-months’ supply, unchanged from last month but up from 3.0-months’ supply a year ago. This inventory level remains low compared to balanced market conditions (4.5 to 6 months’ supply) and illustrates the long-run need for more home construction.

Homes stayed on the market for an average of 42 days in February, up from 41 days in January and 38 days in February 2024.

The February all-cash sales share was 32% of transactions, up from 29% in January but down from 33% a year ago. All-cash buyers are less affected by changes in interest rates.

The February median sales price of all existing homes was $398,400, up 3.8% from last year. This marked the 20th consecutive month of year-over-year increases. The median condominium/co-op price in February was up 3.5% from a year ago at $355,100. This rate of price growth will slow as inventory increases.

Existing home sales in February were mixed across the four major regions. Sales rose in the South (4.4%) and West (13.3%), fell in the Northeast (-2.0%), and remained unchanged in the Midwest. On a year-over-year basis, sales increased in the Northeast (4.2%) and Midwest (1.0%), decreased in the South (-4.0%), and were unchanged in the West.

The Pending Home Sales Index (PHSI) is a forward-looking indicator based on signed contracts. The PHSI fell from 74.0 to an all-time low of 70.6 in January. This decline suggests elevated home prices and higher mortgage rates continue to constrain affordability. On a year-over-year basis, pending sales were 5.2% lower than a year ago, per National Association of Realtors data.

Discover more from Eye On Housing

Subscribe to get the latest posts sent to your email.



This article was originally published by a eyeonhousing.org . Read the Original article here. .


Nationwide, the share of non-conventional financing for new home sales accounted for 32.4% of the market per NAHB analysis of the 2023 Census Bureau Survey of Construction (SOC) data. This is a significant 4.3 percentage point increase from the 2022 share of 28.1%. As in previous years, conventional financing dominated the market at 67.6% of sales, albeit lower than the 2022 share of 71.9%.

Non-conventional forms of financing, as opposed to conventional mortgage loans, include loans insured by the Federal Housing Administration (FHA), VA-backed loans, cash purchases and other types of financing such as the Rural Housing Service, Habitat for Humanity, loans from individuals, or state or local government mortgage-backed bonds. The reliance on non-conventional forms of financing varied across the United States, with its share at almost 40% in West South Central but only 17.1% of new single-family home starts in the Middle Atlantic division.

Nationwide, cash purchases were the majority share of non-conventional financing of new home purchases, accounting for 14% of the market share, slightly up from 13% in 2022. NAHB survey based on builders reported that for 2024, all-cash sales are a higher share at 22%. FHA-backed loans accounted for 12%, whereas in 2022, it was only 8% of the market share. The share of VA-backed loans was at 4% market share in 2023, while Other Financing was 3% of market share.

Regionally, cash financing held the highest share in East South Central, where 24.6% of all homes started were purchased with cash. Except for the South Atlantic, West South Central, and the Pacific, cash purchases led non-conventional financing in the remaining six census regions. Cash purchases accounted for 22.0% in East North Central, 16.9% in New England, 12.3% in Mountain, 12.0% in Middle Atlantic, and 10.6% in West North Central region.   

FHA-backed loans accounted for the majority of all non-conventional financing in the West South Central division accounting for 20.8% of the homes started. This share has gone up considerably  from 12.9% in 2022. The New England division reported the lowest FHA-backed loans with only a share of 1.2% of the homes started in 2023.

VA-backed loans were most used in the South Atlantic division, which accounted for 5.9% of non-conventional forms of financing. In New England, none of the homes started used VA-backed loans in 2023.  

Other financing such as the Rural Housing Service, Habitat for Humanity, loans from individuals, state or local government mortgage-backed bonds was highest in East North Central where it was collectively 5.6% of market share, while Middle Atlantic division reported the lowest share at 0.9%.

Discover more from Eye On Housing

Subscribe to get the latest posts sent to your email.



This article was originally published by a eyeonhousing.org . Read the Original article here. .

Pin It