Tag

February

Browsing


February’s labor market data point to a notable pullback in employment, with job losses concentrated across a majority of states and only modest gains elsewhere. While January showed solid momentum, February’s decline reflects emerging softness in hiring conditions, alongside uneven performance across the country.

In February, nonfarm payroll employment increased in 14 states compared to January, while 36 states recorded declines. The District of Columbia reported no change. According to the Bureau of Labor Statistics, total U.S. nonfarm payroll employment fell by 133,000 in February, following a robust 160,000 job gain in January.

On a month-over-month basis, employment gains were led by Arizona (+11,000), followed by Indiana (+3,600). Louisiana and New Mexico tied for third place with 2,700 job gains each. In contrast, a total of 217,200 jobs were lost across 36 states, with New York posting the largest decline (-22,000). In percentage terms, Wyoming recorded the strongest increase (+0.4 percent), while Nebraska experienced the largest decrease (-0.6 percent) between January and February.

On a year-over-year basis ending in February, total nonfarm employment increased by 149,000 jobs nationwide, representing a 0.1 percent gain relative to February 2025. Job gains ranged from 500 in New Mexico to 120,500 in California. Twenty-seven states and the District of Columbia collectively lost 342,400 jobs over the past 12 months, with Maryland experiencing the largest decline (-52,700). In percentage terms, job growth ranged from 0.1 percent in North Dakota, New York, Ohio, Kansas, Connecticut, New Mexico, and Missouri to 2.2 percent in Nevada. Among states with losses, declines ranged from 0.1 percent in Delaware, Mississippi, Louisiana, New Jersey, Georgia, and Kentucky to 1.9 percent in Maryland; the District of Columbia, however, recorded a substantially larger decline of 5.5 percent.

Construction Employment

Construction employment —which includes both residential and non-residential construction, showed job losses in February. Twenty-two states added construction jobs compared to January, while 27 states and the District of Columbia experienced declines; South Dakota reported no change. Florida posted the largest monthly gain, adding 1,100 jobs, while New Jersey recorded the largest loss (-5,900). Overall, the construction sector lost a net 13,000 jobs nationwide in February. In percentage terms, Montana recorded the strongest monthly increase (+1.3 percent), while Delaware experienced the steepest decline (-4.4 percent).

Year-over-year, construction employment increased by 37,000 jobs nationwide, a 0.4 percent gain compared to February 2025. Texas led all states with an increase of 24,000 construction jobs, while California recorded the largest loss (-10,300). In percentage terms, Montana posted the strongest annual growth in construction employment (+8.8 percent), while Alaska experienced the largest decline (-5.6 percent).

State Unemployment Rate

The state unemployment rate is a key economic indicator that reflects the health of local labor markets, measuring the percentage of the workforce actively seeking work but unable to find it. High unemployment signals a weakening state economy, while low unemployment suggests a tight labor market that may contribute to rising wage pressures.

Hawaii and South Dakota had the lowest unemployment rates at 2.3 percent, while the District of Columbia had the highest rate at 6.5 percent. This elevated rate reflects significant federal workforce reductions and layoffs, exceeding 300,000 positions, which disproportionately affected the District in 2025. Vermont, North Dakota, and Alabama reported unemployment rates below 3.0 percent. South Carolina, Michigan, Illinois, Washington, New Jersey, Oregon, Nevada, California, and Delaware all recorded unemployment rates at or above 5.0 percent.


This article was originally published by a eyeonhousing.org . Read the Original article here. .
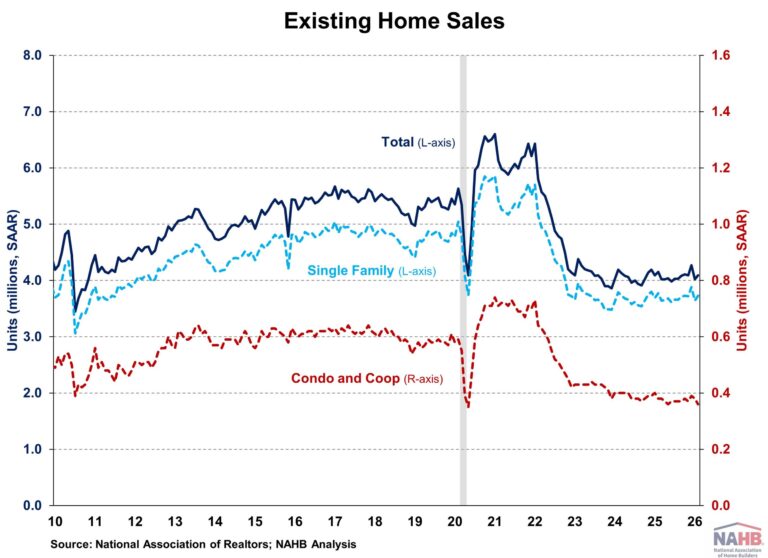

Following the sharp decline last month, existing home sales bounced back in February as housing affordability improved. Lower mortgage rates and moderating home price growth helped pull buyers back to the market. However, tight inventory will likely continue to push home prices higher if demand outpaces supply growth.

Total existing home sales, including single-family homes, townhomes, condominiums, and co-ops, rose 1.7% to a seasonally adjusted annual rate of 4.09 million in February, according to the National Association of Realtors (NAR). On a year-over-year basis, sales were 1.4% lower than a year ago.

The existing home inventory level was 1.3 million units in February, up 2.4% from January and 4.9% from a year ago. At the current sales rate, February unsold inventory sits at a 3.8-months’ supply, unchanged from last month but up from 3.6-months in February. Inventory between 4.5 to 6 months’ supply is generally considered a balanced market.

Homes stayed on the market for a median of 47 days in February, up from 46 days in the previous month and 42 days in February 2025.

The first-time buyer share was 34% in February, up from 31% in January and one year ago.

The February all-cash sales share was 31% of transactions, up from 27% in January but down from 32% a year ago. All-cash buyers are less affected by changes in interest rates.

The February median sales price of all existing homes was $398,000, up 0.3% from last year. This marks the 32nd consecutive month of year-over-year increases. However, the year-over-year growth has moderated since peaking in December 2024, suggesting that price appreciation may continue to slow. The median condominium/co-op price in February was up 0.9% from a year ago at $358,100. Recent gains for home inventory will put downward pressure on resale home prices in most markets in 2026.

Three of the four major regions saw sales increases in February, ranging from 1.1% in the Midwest to 8.2% in the West. Sales in the Northeast fell 6.0%. On a year-over-year basis, sales rose only in the South (+0.5%), while sales in the West, Midwest, and Northeast all declined (-1.3%, -4.1%, and -4.1%, respectively). 

The Pending Home Sales Index (PHSI) is a forward-looking indicator based on signed contracts. The PHSI fell from 71.5 to 70.9 in January. On a year-over-year basis, pending sales were 0.4% lower than a year ago, according to the National Association of Realtors’ data. The decline suggests buyers are holding back due to limited inventory choices.


This article was originally published by a eyeonhousing.org . Read the Original article here. .
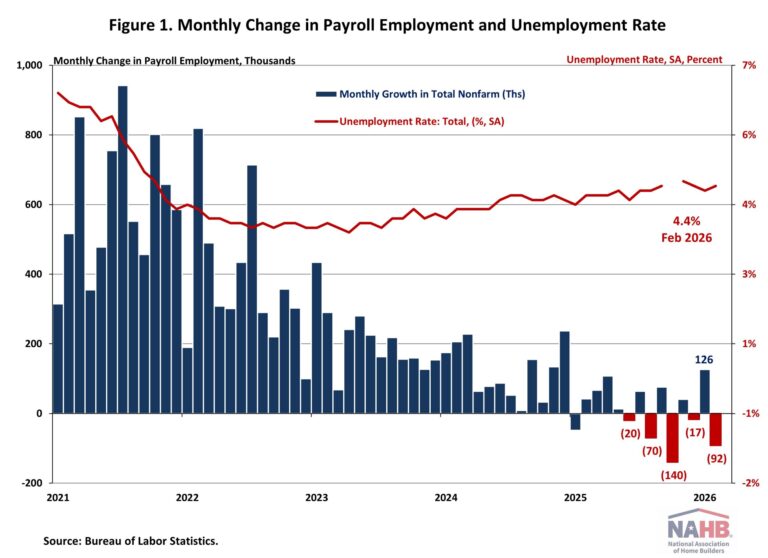

The U.S. labor market weakened in February, as payroll employment declined and the unemployment rate rose to 4.4%. The cooling labor market could place the Federal Reserve in a challenging position as policymakers weigh slower job growth against inflation pressures from rising oil prices.

Wage growth accelerated slightly in February, with average hourly earnings rising 3.8% year-over-year. This pace is 0.3 percentage points lower than a year ago. Importantly, wage growth has been outpacing inflation for nearly two years, which typically occurs as productivity increases.

National Employment

According to the Employment Situation Summary reported by the Bureau of Labor Statistics (BLS), total nonfarm payroll employment fell by 92,000 in February, following a downwardly revised gain of 126,000 jobs in January. This marks the sixth monthly decline since January 2025 and the second-largest monthly job loss during that period.

Estimates for the previous two months were revised lower. The monthly change in total nonfarm payroll employment for December was revised down by 65,000 from +48,000 to -17,000, while the change for January was revised down by 4,000 from +130,000 to +126,000. Combined, these revisions reduced previously reported employment by 69,000 jobs.

The unemployment rate ticked up to 4.4% in February from 4.3% in January. Over the month, the number of persons unemployed rose by 203,000, while the number of persons employed declined by 185,000.

Meanwhile, the labor force participation rate—the proportion of the population either looking for a job or already holding a job—declined 0.1 percentage points to 62.0%. This was the lowest rate since January 2022 and remains below its pre-pandemic level of 63.3% recorded at the beginning of 2020. Among prime working-age individuals (aged 25 to 54), the participation rate decreased to 83.9%.

Health care, which has been the primary growth driver of payroll growth in recent months, lost 28,000 jobs in February, largely due to a strike at Kaiser Permanente during the BLS survey period. Employment in the information sector also trended down, shredding 11,000 jobs, while federal government cut another 10,000 jobs.  Meanwhile, the social assistance sector added 9,000 jobs, driven by gains in individual and family services (+12,000).

Construction Employment

Employment in the overall construction sector declined by 11,000 jobs in February, following an upwardly revised gain of 48,000 in January. Within the industry, residential construction shed 7,100 jobs, while non-residential construction lost 3,800 positions.

Residential construction employment now stands at 3.3 million in February, including 929,000 workers employed by builders and remodelers and nearly 2.4 million residential specialty trade contractors.

The six-month moving average of job gains for residential construction remains negative, at a loss of 533 per month, reflecting losses in three of the past six months. Over the last 12 months, residential construction has seen a net loss of 46,100 jobs, marking the twelfth consecutive annual decline and the longest stretch of annual losses since the Great Recession. Since the low point following the Great Recession, residential construction has gained 1,306,900 positions.

In February, the unemployment rate for construction workers edged down slightly to 4.6% on a seasonally adjusted basis, remaining relatively low compared with historical norms.


This article was originally published by a eyeonhousing.org . Read the Original article here. .
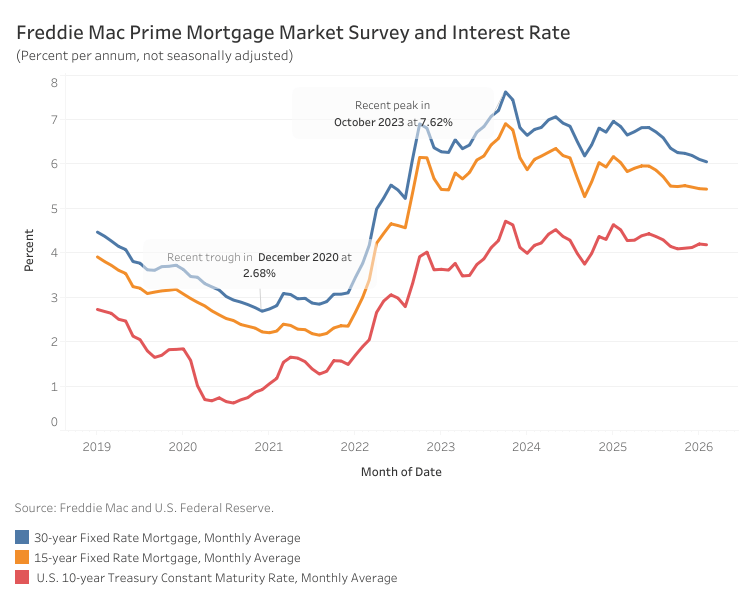

Mortgage rates continued to decline in February, dipping below 6% in the last week of February. According to Freddie Mac, the 30-year fixed-rate mortgage averaged 6.05% last month, 5 basis points (bps) lower than January. Meanwhile, the average 15-year rate declined only a basis point to 5.43%. Compared to a year ago, the 30-year and 15-year rates are lower by 79 bps and 60 bps, respectively.

The 10-year Treasury yield, a key benchmark for long-term borrowing, held relatively steady for most of February with an average 4.18% – a marginal decrease of 2 bps from the previous month. However, yields fell significantly in the final week of February as investors moved to secure U.S. Treasuries amid rising risk aversion in corporate credit markets, widening the spread between corporate bond yields and U.S. Treasuries. Investor concerns centered on the large capital expenditures by major technology firms to finance artificial intelligence infrastructure, much of which has been funded through corporate bond issuance, contributing to rising debt levels among these “hyperscalers”.

Following the recent escalation of conflict in the Middle East, the 10-year Treasury yield has shown signs of reversing course. Investors are closely monitoring how protracted the conflict may become and its potential implications for global energy markets. If oil prices rise significantly or remain elevated, inflation pressures could intensify, potentially pushing Treasury yields higher.


This article was originally published by a eyeonhousing.org . Read the Original article here. .
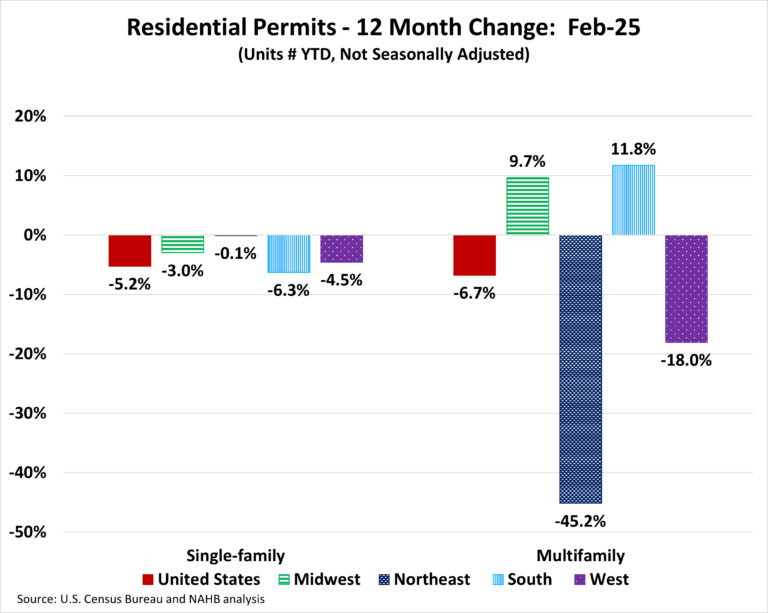

Permits continue the downward trend for the second month in a row. Over the first two months of 2025, the total number of single-family permits issued year-to-date (YTD) nationwide reached 147,119. On a year-over-year (YoY) basis, this is a decline of 5.2% over the February 2024 level of 155,236. For multifamily, the total number of permits issued nationwide reached 72,979. This is 6.7% below the February 2024 level of 78,259.

Year-to-date ending in February, single-family permits were down in all four regions. The Northeast posted the smallest decline of 0.1%, the Midwest was down by 3.0%, the West was down by 4.5% and the South was down by 6.3% in single-family permits during this time. For multifamily permits, two out of the four regions posted increases. The South was up by 11.8% and the Midwest was up by 9.7%. Meanwhile, the West posted a decline of 18.0% and the Northeast declined steeply by 45.2%.

Between February 2025 YTD and February 2024 YTD, 19 states and the District of Columbia posted an increase in single-family permits. The range of increases spanned 133.3% in the District of Columbia to 0.1% in New Jersey. The remaining 31 states reported declines in single-family permits with West Virginia reporting the steepest decline of 21.1%.

The ten states issuing the highest number of single-family permits combined accounted for 65.6% of the total single-family permits issued. Texas, the state with the highest number of single-family permits, issued 24,960 permits over the first two months 2025, which is a decline of 5.6% compared to the same period last year. The second highest state, Florida, was down by 8.3%, while the third highest, North Carolina, posted a decline of 4.5%.

Between February 2025 YTD and February 2024 YTD, 26 states and the District of Columbia recorded growth in multifamily permits, while 24 states recorded a decline. Iowa (+177.4%) led the way with a sharp rise in multifamily permits from 354 to 982, while Arizona had the biggest decline of 67.5% from 3,209 to 1,044.

The ten states issuing the highest number of multifamily permits combined accounted for 63.2% of the multifamily permits issued. Over the first two months of 2025, Florida, the state with the highest number of multifamily permits issued, experienced an increase of 63.0%. Texas, the second-highest state in multifamily permits, saw a decline of 9.0%. California, the third largest multifamily issuing state, decreased by 21.7%.

At the local level, below are the top ten metro areas that issued the highest number of single-family permits.

For multifamily permits, below are the top ten local areas that issued the highest number of permits.

Discover more from Eye On Housing

Subscribe to get the latest posts sent to your email.


This article was originally published by a eyeonhousing.org . Read the Original article here. .
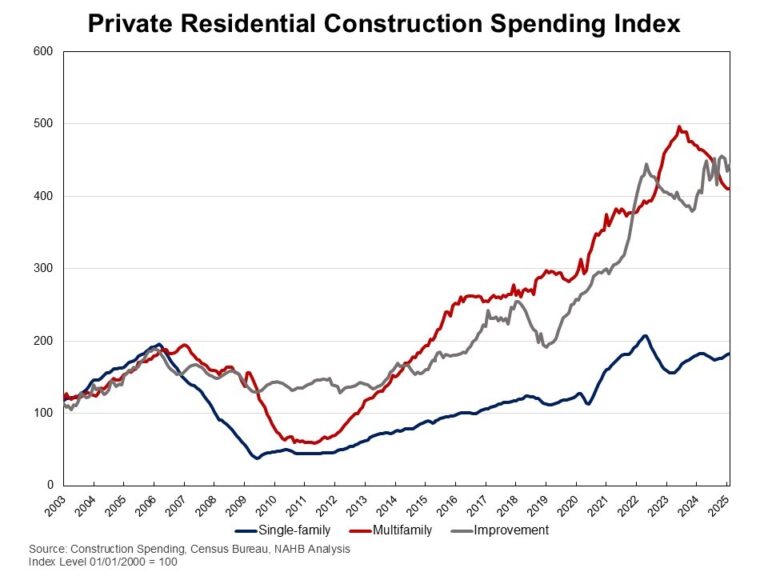

Private residential construction spending increased by 1.3% in February, rebounding from a 1.2% dip in January. The growth was largely driven by higher spending on single-family construction and residential improvements. On a year-over-year basis, the February report showed a 1.6% gain, indicating a modest growth in private residential construction spending during market uncertainties. 

The monthly increase in total private construction spending was primarily driven by gains in spending on single-family construction and residential improvements. Single-family construction spending was up 1% for the month, continuing to grow after a five-month decline from April to August 2024. This growth is consistent with strong single-family housing starts in February. However, single-family construction spending remained 0.1% lower than a year ago. Meanwhile, improvement spending rose by 2% in February and was 8.9% higher compared to the same period last year. In contrast, multifamily construction spending stayed flat in February, extending the downward trend that began in December 2023. Compared to a year ago, multifamily construction spending was down 11.6%. 

The NAHB construction spending index is shown in the graph below. The index illustrates how   spending on single-family construction has slowed since early 2024 under the pressure of elevated interest rates and concerns over building material tariffs. Multifamily construction spending growth has also slowed down after the peak in July 2023. Meanwhile, improvement spending has increased its pace since late 2023.  

Spending on private nonresidential construction was up 2.5% over a year ago. The annual private nonresidential spending increase was mainly due to higher spending for the class of manufacturing ($10.5 billion), followed by the power category ($6.4 billion). 

Discover more from Eye On Housing

Subscribe to get the latest posts sent to your email.


This article was originally published by a eyeonhousing.org . Read the Original article here. .
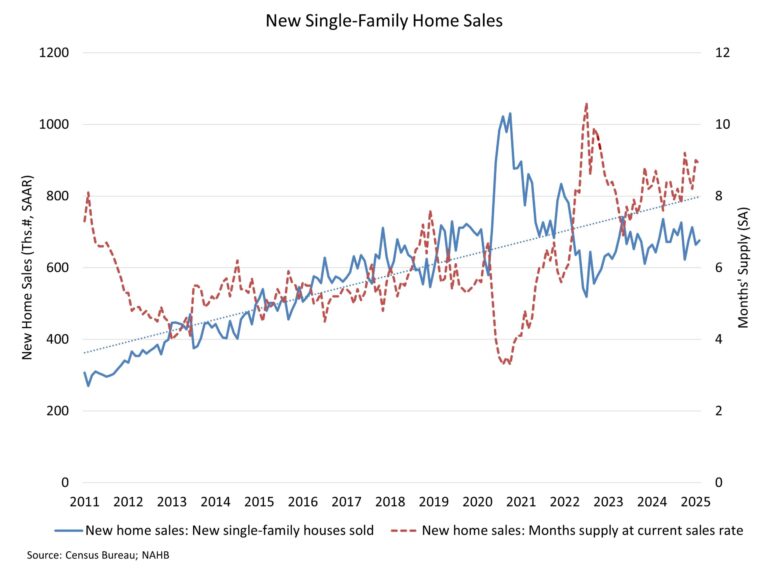

A slight decline in mortgage rates and limited existing inventory helped new home sales to edge higher in February even as housing affordability challenges continue to act as a strong headwind on the market.

Sales of newly built, single-family homes in February increased 1.8% to a 676,000 seasonally adjusted annual rate from a revised January number, according to newly released data from the U.S. Department of Housing and Urban Development and the U.S. Census Bureau. The pace of new home sales in February was up 5.1% compared to a year earlier.

New home sales have been roughly flat thus far in 2025, as ongoing limited inventory of existing homes in many markets continues to support the need for new homes. Lower mortgage rates helped to lift demand in February, despite other near-term risks such as tariff issues and affordability concerns.

A new home sale occurs when a sales contract is signed, or a deposit is accepted. The home can be in any stage of construction: not yet started, under construction or completed. In addition to adjusting for seasonal effects, the February reading of 676,000 units is the number of homes that would sell if this pace continued for the next 12 months.

New single-family home inventory in February continued to rise to a level of 500,000, up 7.5% compared to a year earlier. This represents an 8.9 months’ supply at the current building pace. The count of completed, ready-to-occupy homes available for sale increased again, rising to 119,000, up 35% from a year ago and marking the highest count since mid-2009. 

However, after accounting for a low 3.4 months’ supply for the existing single-family market, total market inventory (new and existing homes) stands at a lean 4.2 months’ supply per NAHB estimates. A balanced market is typically defined as a 6 month’s supply.

The median new home sale price in February was $414,500, down 1.5% from a year ago. The count of sales was supported by a gain of transactions priced between $300,000 and $400,000 in February.

Regionally, on a year-to-date basis, new home sales are up 12.4% in the South but down 6.7% in the West, 13.5% in the Midwest and 50.8% in the Northeast.

Discover more from Eye On Housing

Subscribe to get the latest posts sent to your email.


This article was originally published by a eyeonhousing.org . Read the Original article here. .
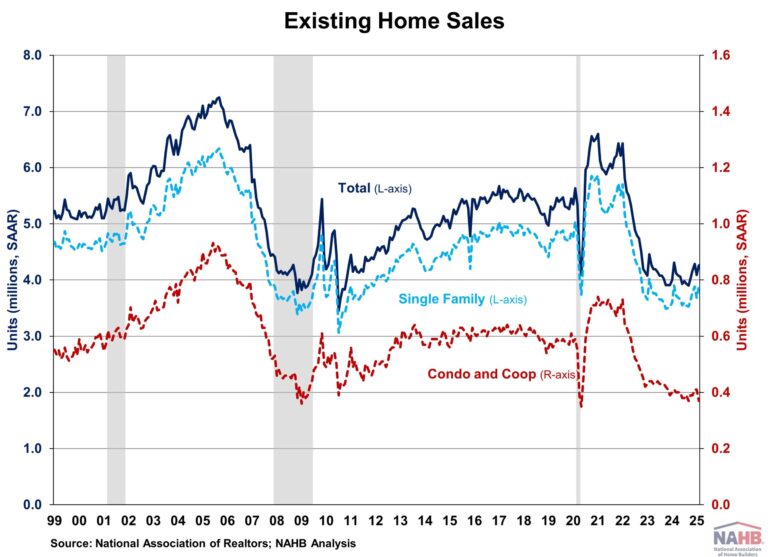

Existing home sales in February increased to the second highest level since March 2024, according to the National Association of Realtors (NAR). This rebound suggests buyers are slowly entering the market as inventory improves and mortgage rates decline from recent high in January. Despite rates easing, economic uncertainty may continue to constrain buyer activity.

While existing home inventory improves and the Fed continues lowering rates, the market faces headwinds as mortgage rates are expected to stay above 6% for longer due to an anticipated slower easing pace in 2025. These prolonged rates may continue to discourage homeowners from trading existing mortgages for new ones with higher rates, keeping supply tight and prices elevated. As such, sales are likely to remain limited in the coming months due to elevated mortgage rates and home prices.

Total existing home sales, including single-family homes, townhomes, condominiums, and co-ops, rose 4.2% to a seasonally adjusted annual rate of 4.26 million in February. On a year-over-year basis, sales were 1.2% lower than a year ago.

The first-time buyer share was 31% in February, up from 28% in January and 26% from a year ago.

The existing home inventory level was 1.24 million units in February, up from 1.18 million in January, and up 17.0% from a year ago. At the current sales rate, February unsold inventory sits at a 3.5-months’ supply, unchanged from last month but up from 3.0-months’ supply a year ago. This inventory level remains low compared to balanced market conditions (4.5 to 6 months’ supply) and illustrates the long-run need for more home construction.

Homes stayed on the market for an average of 42 days in February, up from 41 days in January and 38 days in February 2024.

The February all-cash sales share was 32% of transactions, up from 29% in January but down from 33% a year ago. All-cash buyers are less affected by changes in interest rates.

The February median sales price of all existing homes was $398,400, up 3.8% from last year. This marked the 20th consecutive month of year-over-year increases. The median condominium/co-op price in February was up 3.5% from a year ago at $355,100. This rate of price growth will slow as inventory increases.

Existing home sales in February were mixed across the four major regions. Sales rose in the South (4.4%) and West (13.3%), fell in the Northeast (-2.0%), and remained unchanged in the Midwest. On a year-over-year basis, sales increased in the Northeast (4.2%) and Midwest (1.0%), decreased in the South (-4.0%), and were unchanged in the West.

The Pending Home Sales Index (PHSI) is a forward-looking indicator based on signed contracts. The PHSI fell from 74.0 to an all-time low of 70.6 in January. This decline suggests elevated home prices and higher mortgage rates continue to constrain affordability. On a year-over-year basis, pending sales were 5.2% lower than a year ago, per National Association of Realtors data.

Discover more from Eye On Housing

Subscribe to get the latest posts sent to your email.


This article was originally published by a eyeonhousing.org . Read the Original article here. .
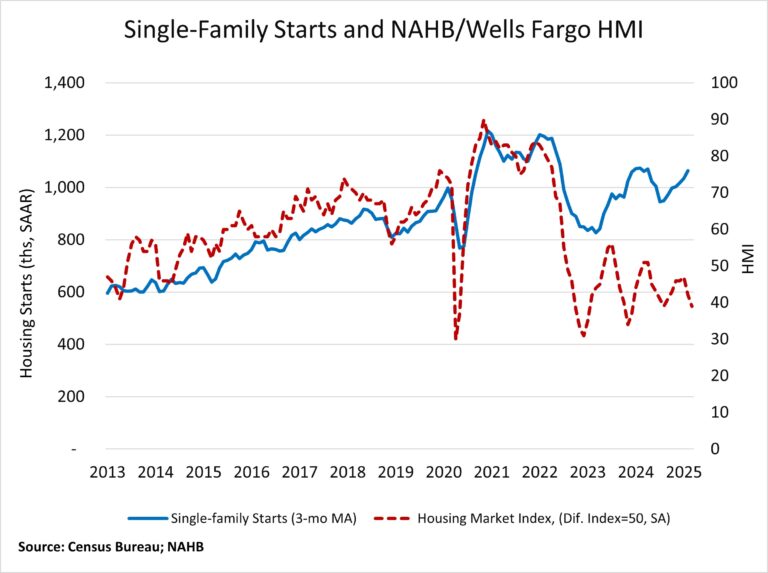

Limited existing inventory helped single-family starts to post a solid gain in February, but builders are still grappling with elevated construction costs stemming from tariff issues and persistent shortages related to buildable lots and labor.

Overall housing starts increased 11.2% in February to a seasonally adjusted annual rate of 1.50 million units, according to a report from the U.S. Department of Housing and Urban Development and the U.S. Census Bureau. The February reading of 1.50 million starts is the number of housing units builders would begin if development kept this pace for the next 12 months.

Within this overall number, single-family starts increased 11.4% to a 1.11 million seasonally adjusted annual rate, the highest pace since February 2024. The multifamily sector, which includes apartment buildings and condos, increased 10.7% to an annualized 393,000 pace.

While solid demand and a lack of existing inventory provided a boost to single-family production in February, our latest builder survey shows that builders remain concerned about challenging housing affordability conditions, most notably elevated financing and construction costs as well as tariffs on key building materials.

On a regional and year-to-date basis, combined single-family and multifamily starts were 4.7% lower in the Northeast, 21.5% lower in the Midwest, 8.3% lower in the South and 20.2% higher in the West.

Overall permits decreased 1.2% to a 1.46-million-unit annualized rate in February and were down 6.8% compared to February 2024. Single-family permits decreased 0.2% to a 992,000-unit rate and were down 3.4% compared to the previous year. Multifamily permits decreased 3.1% to a 464,000 pace.

Looking at regional permit data on a year-to-date basis, permits were 30.1% lower in the Northeast, 2.3% higher in the Midwest, 2.1% lower in the South and 12.5% lower in the West.

The number of single-family homes under construction in February was down 6.7% from a year ago, at 640,000 homes. In February, the count of apartments under construction increased 0.3% to an annualized 772,000 pace. It marks the first gain after 18 months of consecutive declines but was still down 20% from a year ago.

There were 526,000 multifamily completions in February, down 15% from the previous year. For each apartment starting construction, there are 1.5 apartments completing the construction process.

Discover more from Eye On Housing

Subscribe to get the latest posts sent to your email.


This article was originally published by a eyeonhousing.org . Read the Original article here. .
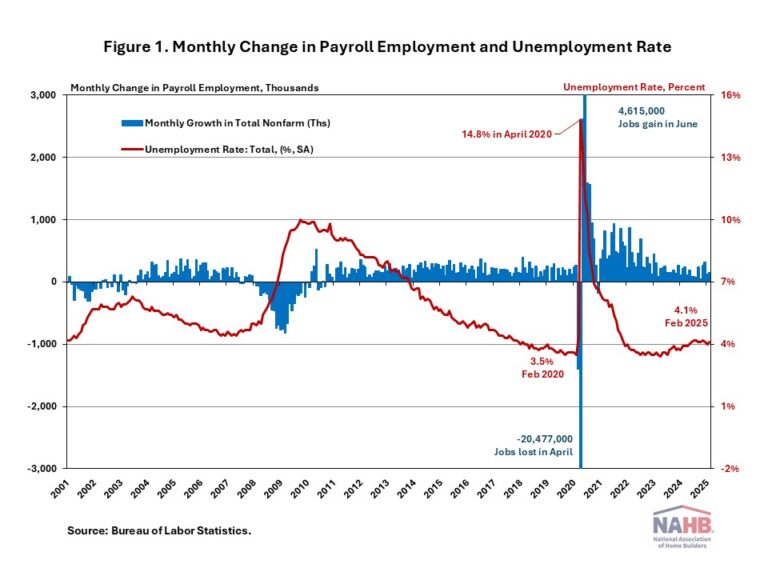

The U.S. job market continued to grow at a solid pace in February, with the unemployment rate edging up slightly to 4.1%. The labor market remains healthy overall, but there are signs of potential weakness in the coming months, driven by mass federal government layoffs and ongoing policy uncertainty.

This month’s jobs report may not fully reflect the impact of these layoffs in both the federal government and private sector, as the reference period for the monthly jobs report only covers the pay period that includes the 12th of the month. In fact, government job losses totaled only 10,000 workers for the February report.

In February, wage growth accelerated. Year-over-year, wages grew at a 4.0% rate, down 0.1 percentage points from a year ago. Wage growth has been outpacing inflation for nearly two years, which typically occurs as productivity increases.

National Employment

According to the Employment Situation Summary reported by the Bureau of Labor Statistics (BLS), total nonfarm payroll employment rose by 151,000 in February, following a downwardly revised increase of 125,000 jobs in January. Since January 2021, the U.S. job market has added jobs for 50 consecutive months, making it the third-longest period of employment expansion on record.

The estimates for the previous two months were revised. The monthly change in total nonfarm payroll employment for December was revised up by 16,000 from +307,000 to +323,000, while the change for January was revised down by 18,000 from +143,000 to +125,000. Combined, the revisions were 2,000 lower than previously reported.

The unemployment rate rose to 4.1% in February. While the number of employed persons decreased by 588,000, the number of unemployed persons increased by 203,000.

Meanwhile, the labor force participation rate—the proportion of the population either looking for a job or already holding a job—decreased two percentage points to 62.4%. For people aged between 25 and 54, the participation rate remained unchanged, at 83.5%. While the overall labor force participation rate remains below its pre-pandemic levels of 63.3% at the beginning of 2020, the rate for people aged between 25 and 54 exceeds the pre-pandemic level of 83.1%.

In February, employment rose in several sectors, including health care (+52,000), financial activities (+21,000), transportation and warehousing (+18,000), and social assistance (+11,000). However, within the government sector, federal government employment saw a decline of 10,000, marking the worst month of federal government net hiring since June 2022.

Construction Employment

Employment in the overall construction sector increased by 19,000 in February, after a 2,000 gain in January. While residential construction gained 12,700 jobs, non-residential construction employment added 6,200 jobs for the month.

Residential construction employment now stands at 3.4 million in February, broken down as 955,000 builders and 2.4 million residential specialty trade contractors. The 6-month moving average of job gains for residential construction was 2,600 a month. Over the last 12 months, home builders and remodelers added 50,500 jobs on a net basis. Since the low point following the Great Recession, residential construction has gained 1,387,000 positions.

In February, the unemployment rate for construction workers rose to 5.3% on a seasonally adjusted basis. The unemployment rate for construction workers has remained at a relatively lower level, after reaching 15.3% in April 2020 due to the housing demand impact of the COVID-19 pandemic.

Discover more from Eye On Housing

Subscribe to get the latest posts sent to your email.


This article was originally published by a eyeonhousing.org . Read the Original article here. .

Pin It