Tag

Consumer

Browsing


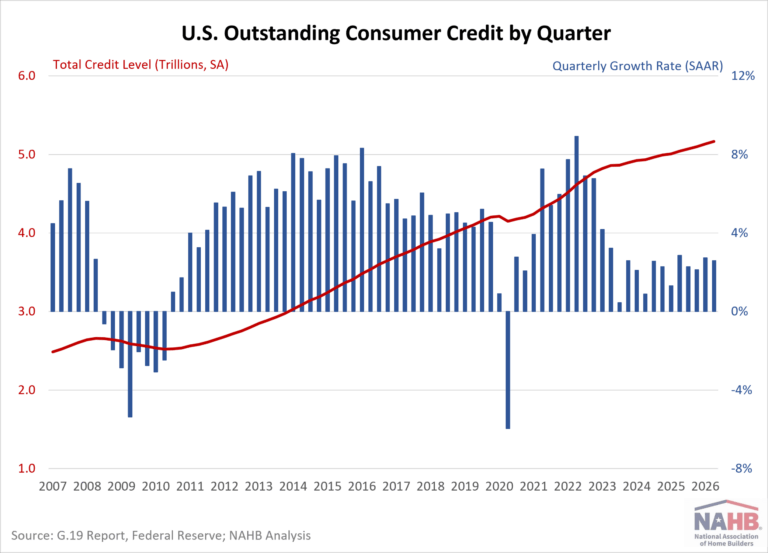
In the second quarter of 2026, consumer credit growth slowed over the quarter and was lower than a year ago. According to the Federal Reserve’s G.19 Consumer Credit Report, total outstanding U.S. consumer credit reached $5.17 trillion in the second quarter of 2026. This marked a 2.60% increase at a seasonally adjusted annual rate (SAAR) from the first quarter. Compared to a year ago, the total outstanding credit amount was 2.43% higher. 

Nonrevolving Credit  

Nonrevolving credit, which is primarily made up of student and auto loans (the G.19 report excludes mortgage loans), reached $3.82 trillion (SA) in the second quarter of 2026. This marks a 2.11% increase (SAAR) from the previous quarter, and a 1.96% increase from a year ago. 

Student loan credit outstanding was at $1.86 trillion (NSA) for the second quarter of 2026, up 3.08% from a year ago.

Auto loans reached a level of $1.57 trillion (NSA), showing a year-over-year increase of just 0.69%. Auto loan rates for a 60-month new car stood at 7.14% (NSA) for the second quarter of 2026, 53 basis points lower than a year ago. Auto loan rates have continued to decline year-over-year for the last seven quarters but remain higher than pre-pandemic levels. 

Revolving Credit 

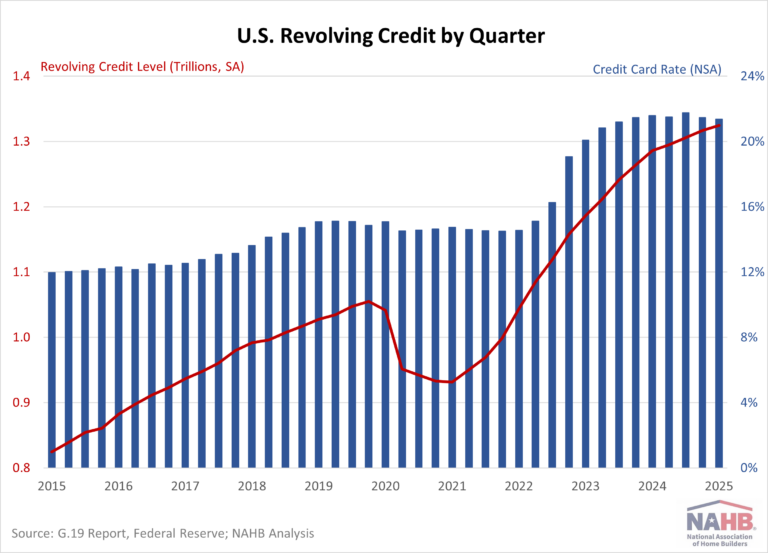
Revolving credit, which is primarily made up of credit card balances, rose to $1.35 trillion (SA) in the second quarter of 2026. This represents a 3.98% increase (SAAR) from the previous quarter and a 3.79% increase year-over-year. 

Although credit card rates have hovered near historic highs since Q4 2022, the past six quarters have shown modest year-over-year declines. The average credit card rate held by commercial banks (NSA) stood at 20.94% in the second quarter of 2026, a drop of 22 basis points from a year earlier.  


This article was originally published by a eyeonhousing.org . Read the Original article here. .


The housing market has changed greatly since the COVID-19 pandemic, along with consumer spending behaviors. During this period, housing demand surged, home prices appreciated rapidly, inflation increased, supply-chain disruptions happened, and mortgage rates moved from historic lows to elevated levels. These changes raise important questions about whether home buyer spending patterns have changed and how long the spending boosts associated with a home purchase last.

Using pooled Consumer Expenditure Survey (CES) microdata from 2020 to 2023, we find buyers of newly built and existing single-family detached homes generate almost the same increase in spending during the first year after purchase, about $8,750 and $8,674, respectively. The key difference is not the amount of additional spending, but its composition. Buyers of newly built homes spend more on furnishings, while buyers of existing homes spend more on property alterations and repairs. For both groups, most appliance purchases occur during the first year after buying a home.

Spending Attributable to Home Buying

Because these socio-economic characteristics also influence spending, comparing group averages alone overstates the effect of the home purchase itself. Therefore, it is worthwhile to estimate how much additional spending is associated with purchasing a home after taking these differences into account[1].  We then use the results to compare predicted spending for similar households under different homeownership situations.

Table 1 shows how purchasing a newly built home affects household spending after accounting for differences in household characteristics. The estimates compare the same household under two scenarios: if it purchases a newly built home and if it does not move. The Year 1, Year 2, and Year 3 columns show the predicted annual spending of a typical newly built home buyer in the first three years after purchasing a home, while the “If Not Moving” column shows the predicted spending for the same household had it remained in its current home in one year. The differences shown in parentheses represent the additional spending associated with buying a newly built home compared to a nonmoving counterpart.

If the typical new home buyer does not move, it is predicted to spend about $2,722 per year on appliances, $2,354 on furnishings, and $9,660 on property alterations and repairs. During the first year after purchasing a newly built home, spending increases in all three categories. The largest increase is in furnishings, where predicted spending rises to $7,236, about $4,882 more than for an otherwise identical non-moving homeowner. Appliance spending also increases substantially to $4,475 (+$1,752). Property alterations and repair spending rises to $11,776 (+$2,116), although this increase is not statistically significant.

The spending boost changes over time. Appliance spending is concentrated in the first year after purchase and returns close to the non-moving level thereafter. Furnishing spending also peaks in the first year but remains moderately higher in the second and third years, suggesting that households continue furnishing their homes over time. In contrast, property alterations and repair spending shows little evidence of a lasting increase. This pattern is consistent with newly built homes requiring fewer repairs and replacements, so post-purchase property alterations projects are generally more discretionary.

Table 2 presents a similar comparison for households with characteristics typical of an existing home buyer. During the first year after purchase, a typical buyer of existing homes spends significantly more than otherwise identical homeowners who does not move on appliances, furnishings, and property alterations and repair projects. The largest increase occurs in property alterations and repairs, with predicted annual spending of $13,882, approximately $5,498 more. A typical buyer of existing homes also spends more on furnishings (+$1,973) and appliances (+$1,202).

Typical existing home buyers spend more on appliances primarily during the first year after purchase. Furnishing expenditures decline after the first year but remain modestly elevated through the third year. Property alterations and repair spending exhibits the greatest persistence. Even in the second and third years after purchase, buyers of existing homes continue to spend substantially more on property alterations and repairs. This sustained spending reflects that existing homes often required renovations, repairs, and deferred maintenance that are completed over time after purchase.

[1] Tobit regression is used in this statistical analysis, because many households reports no spending in a given category.


This article was originally published by a eyeonhousing.org . Read the Original article here. .


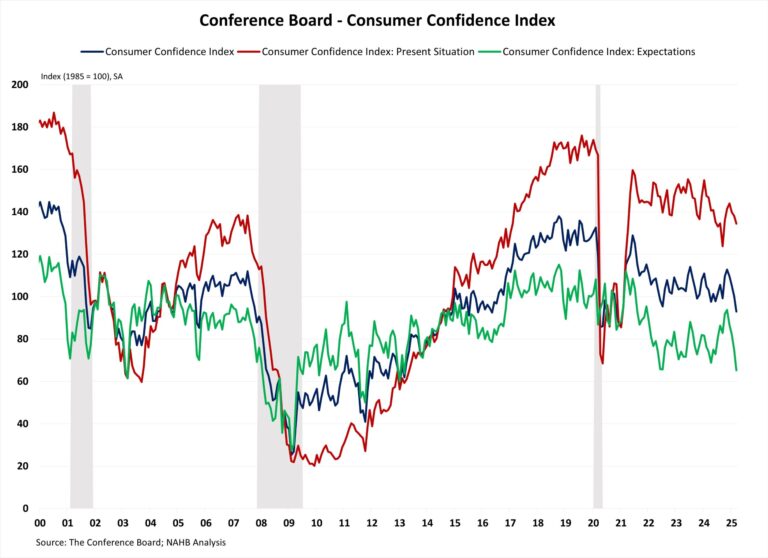
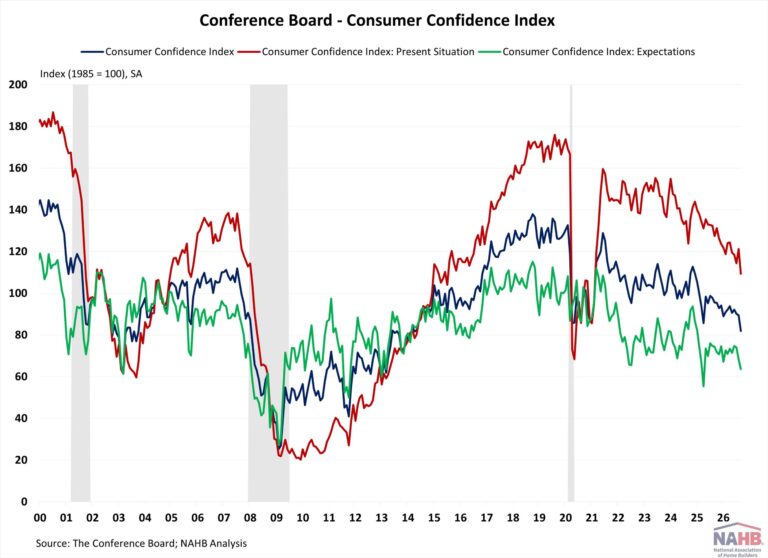
Consumer confidence inched up in June due to improved views of business conditions and recent declines in oil prices easing inflation fears. However, the consumers’ view of the labor market continued to weaken, despite recent strong job reports; The share of respondents saying jobs are ‘hard to get’ reached a five-and-a-half-year high. The labor market differential, which measures the gap between consumers viewing jobs as plentiful and hard-to-get, remained narrow and reached its lowest level since February 2021. Overall, consumer confidence remains well below pre-pandemic levels.

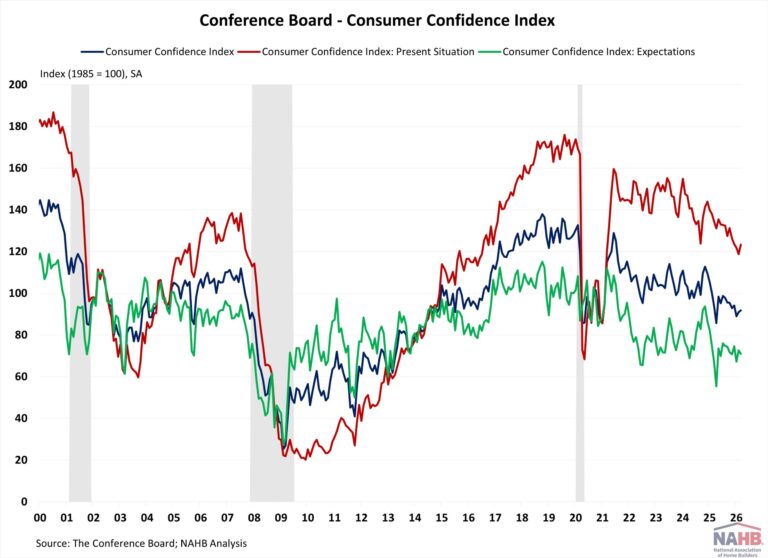
The Consumer Confidence Index, reported by the Conference Board, is a survey measuring how optimistic or pessimistic consumers feel about their financial situation. This index rose from 90.6 to 91.2 in June. The Consumer Confidence Index consists of two components: how consumers feel about their present situation and their expected situation. In June, the Present Situation Index decreased 3.0 points to 116.4, the lowest level since February 2021; the Expectation Situation Index increased 3.0 points  to 74.4, the highest level this year. This is the seventeenth consecutive month for which the Expectation Index has been below 80, a threshold that often signals a recession within a year.

Consumers’ assessment of current business conditions improved in June. The share of respondents rating business conditions as “good” increased by 0.8 percentage points to 20.0%, while those claiming business conditions as “bad” fell by 0.2 percentage points to 16.5%. Meanwhile, consumers’ assessments of the labor market were mixed in June. The share of respondents reporting that jobs were “plentiful” rose by 0.1 percentage points to 24.9%; meanwhile, those who saw jobs as “hard to get” increased by 2.7 percentage points to 22.5%, the highest level since January 2021.

Consumers were more optimistic about the short-term outlook. The share of respondents expecting business conditions to improve rose from 18.8% to 19.0%, while those expecting business conditions to deteriorate decreased from 23.2% to 20.3%. However, expectations of employment over the next six months were unchanged. The share of respondents expecting “more jobs” fell from 16.6% to 15.2%, and those anticipating “fewer jobs” declined by 1.4 percentage points to 25.6%.

The Conference Board also reported the share of respondents planning to buy a home within six months. The share of respondents planning to buy a home rose slightly to 6.6% in June. Of those, the shares planning to buy a newly constructed home and an existing home were unchanged at 0.7% and 3.0%, respectively. The remaining 2.9% were planning to buy a home but were undecided between new or existing homes.


This article was originally published by a eyeonhousing.org . Read the Original article here. .

In the first quarter of 2026, consumer credit grew at a slightly faster pace than in years prior amid positive yet sluggish economic growth and rising inflation pressure. According to the Federal Reserve’s G.19 Consumer Credit Report, total outstanding U.S. consumer credit reached $5.14 trillion in the first quarter of 2026. This marked a 3.25% increase at a seasonally adjusted annual rate (SAAR) from the previous quarter, the strongest quarterly growth in three years. Meanwhile, year-over-year growth rose 2.63%, the highest annual increase in nine quarters.

Nonrevolving Credit

Nonrevolving credit, largely driven by student and auto loans (the G.19 report excludes mortgage loans), reached $3.80 trillion (SA) in the first quarter of 2026. This marks a 3.02% increase (SAAR) from the previous quarter, and a 2.34% increase from a year ago.

Student loan credit stood at $1.87 trillion (NSA) for the first quarter of 2026, marking a 3.34% increase from a year ago and showing a return to growth from the COVID-19 Emergency Relief.

Auto loans reached a level of $1.56 trillion (NSA), showing a year-over-year increase of just 0.37%, following two declines in the quarters prior. Auto loan rates for a 60-month new car stood at 7.52% (NSA) for the first quarter of 2026, falling 52 basis points from a year ago. Auto loan rates have continued to decline year-over-year for the last five quarters but remain at elevated levels.

Revolving Credit

Revolving credit, primarily made up of credit card balances, rose to $1.34 trillion (SA) in the first quarter of 2026. This represents a 3.88% increase (SAAR) from the previous quarter and a 3.46% increase year-over-year, both representing an acceleration compared to recent quarters.

Although credit card rates have hovered near historic highs since Q4 2022, the past five quarters have shown modest year-over-year declines. The average credit card rate held by commercial banks (NSA) stood at 21.00% in the first quarter of 2026, a drop of 37 basis points from a year earlier.


This article was originally published by a eyeonhousing.org . Read the Original article here. .


Consumer confidence in March rose to a three-month high as consumers’ improved view of current business and labor market conditions outweighed weaker future expectations. Despite the increase, consumers remained concerned as inflation expectations surged to a seven-month high due to the Iran war and job worries from economic uncertainty. The labor market differential, which measures the gap between consumers viewing jobs as plentiful and hard-to-get, remained narrow and reached its second lowest level since February 2021.This is consistent with recent job reports showing fewer job openings and slower hiring.

The Consumer Confidence Index, reported by the Conference Board, is a survey measuring how optimistic or pessimistic consumers feel about their financial situation. This index rose from 91.0 to 91.8 in March, the highest level this year. The Consumer Confidence Index consists of two components: how consumers feel about their present situation and their expected situation. In March, the Present Situation Index increased 4.6 points from 118.7 to 123.3, the largest monthly increase since November 2024; the Expectation Situation Index dropped 1.7 points from 72.6 to 70.9. This is the fourteenth consecutive month for which the Expectation Index has been below 80, a threshold that often signals a recession within a year.

Consumers’ assessment of current business conditions improved in March. The share of respondents rating business conditions as “good” increased by 1.5 percentage points to 21.9%, while those claiming business conditions as “bad” fell by 2.7 percentage points to 16.3%. Meanwhile, consumers’ assessments of the labor market were mixed in March. The share of respondents reporting that jobs were “plentiful” rose by 0.6 percentage points to 27.3%; meanwhile, those who saw jobs as “hard to get” increased by 0.5 percentage points to 21.5%, the highest level since February 2021.

Consumers were more pessimistic about the short-term outlook. The share of respondents expecting business conditions to improve rose from 17.6% to 18.2%, while those expecting business conditions to deteriorate slightly increased from 21.2% to 21.3%. Similarly, expectations of employment over the next six months were more negative. The share of respondents expecting “more jobs” fell from 16% to 15.4%, and those anticipating “fewer jobs” rose by 1.7 percentage points to 27.9%.

The Conference Board also reported the share of respondents planning to buy a home within six months. The share of respondents planning to buy a home fell slightly to 5.7% in March. Of those, the shares planning to buy a newly constructed home and an existing home were unchanged at 0.7% and 2.6%, respectively. The remaining 2.4% were planning to buy a home but were undecided between new or existing homes.


This article was originally published by a eyeonhousing.org . Read the Original article here. .


Consumer confidence in December fell to the lowest level since April’s tariff implementation, reflective of growing concerns about reignited inflation and a weakening labor market affecting personal finances. The labor market differential, which measures the gap between consumers viewing job as plentiful and hard-to-get, continued to narrow and is now at its lowest level since February 2021. This is consistent with recent job reports showing fewer job openings and slower hiring. The decline in confidence stands in contrast to the recent solid GDP report for the third quarter.

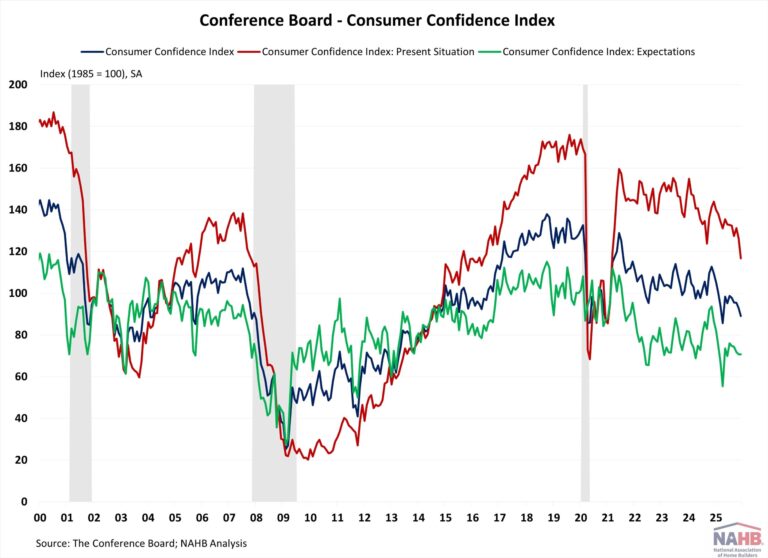
The Consumer Confidence Index, reported by the Conference Board, is a survey measuring how optimistic or pessimistic consumers feel about their financial situation. This index fell from 92.9 to 89.1 in December, the lowest level since April. The Consumer Confidence Index consists of two components: how consumers feel about their present situation and their expected situation. In September, the Present Situation Index decreased 9.5 points from 126.3 to 116.8, the largest monthly decline since September 2024; the Expectation Situation Index dropped remained unchanged at 70.7. This is the eleventh consecutive month that the Expectation Index has been below 80, a threshold that often signals a recession within a year.

Consumers’ assessment of current business conditions deteriorated in December. The share of respondents rating business conditions “good” decreased by 2.3 percentage points to 18.7%, while those claiming business conditions as “bad” rose by 3.3 percentage points to 19.1%. Meanwhile, consumers’ assessments of the labor market cooled further in December. The share of respondents reporting that jobs were “plentiful” fell by 1.5 percentage points to 26.7%, the lowest level since March 2021; meanwhile, those who saw jobs as “hard to get” rose by 0.7 percentage points to 20.8%, the highest since February 2021.

Consumers were more pessimistic about the short-term outlook. The share of respondents expecting business conditions to improve fell from 18.1% to 18.0%, while those expecting business conditions to deteriorate declined from 25.1% to 21.8%. Similarly, expectations of employment over the next six months were more negative. The share of respondents expecting “more jobs” remained unchanged at 16.5%, and those anticipating “fewer jobs” rose by 0.6 percentage points to 27.4%.

The Conference Board also reported the share of respondents planning to buy a home within six months. The share of respondents planning to buy a home fell slightly to 5.7% in December, the lowest level since August. Of those, respondents planning to buy a newly constructed home fell to 0.5%, and those planning to buy an existing home was unchanged at 2.4%. The remaining 2.8% were planning to buy a home but were undecided between new or existing homes.


This article was originally published by a eyeonhousing.org . Read the Original article here. .


After a strong rebound in May, consumer confidence resumed its downward trend in June. Consumers remain concerned about the economy and labor market amid ongoing uncertainty, especially around tariffs. This month’s decline erased almost half of last month’s sharp gain, suggesting continued volatility in consumer sentiment.

The Consumer Confidence Index, reported by the Conference Board, is a survey measuring how optimistic or pessimistic consumers feel about their financial situation. This index fell from 98.4 to 93.0 in June, the second lowest level since February of 2021. The Consumer Confidence Index consists of two components: how consumers feel about their present situation and their expected situation. In June, the Present Situation Index decreased 6.4 points from 135.5 to 129.1, the lowest since October 2024; and the Expectation Situation Index dropped 4.6 points from 73.6 to 69.0. This is the fifth consecutive month that the Expectation Index has been below 80, a threshold that often signals a recession within a year.

Consumers’ assessment of current business conditions turned negative in June. The share of respondents rating business conditions “good” decreased by 2.4 percentage points to 19.0%, while those claiming business conditions as “bad” rose by 1.6 percentage points to 15.3%. Meanwhile, consumers’ assessments of the labor market cooled somewhat in June. The share of respondents reporting that jobs were “plentiful” fell by 1.9 percentage points at 29.2%; meanwhile, those who saw jobs as “hard to get” decreased by only 0.3 percentage points to 18.1%.

Consumers were more pessimistic about the short-term outlook. The share of respondents expecting business conditions to improve fell from 19.9% to 16.7%, while those expecting business conditions to deteriorate declined from 25.4% to 24.0%. Similarly, expectations of employment over the next six months were more negative. The share of respondents expecting “more jobs” decreased by 3.2 percentage points to 15.4%, and those anticipating “fewer jobs” fell by 0.3 percentage points to 25.9%.

The Conference Board also reported the share of respondents planning to buy a home within six months. The share of respondents planning to buy a home fell slightly to 5.9% in June. Of those, respondents planning to buy a newly constructed home decreased to 0.2%, and those planning to buy an existing home dropped to 3.2%. The remaining 2.0% were planning to buy a home but were undecided between new or existing homes.

Discover more from Eye On Housing

Subscribe to get the latest posts sent to your email.


This article was originally published by a eyeonhousing.org . Read the Original article here. .


Consumer credit continued to rise in early 2025, but the pace of growth has slowed. Student loan balances rose year-over-year as borrowers resumed payments following the end of pandemic-era relief. However, growth remains modest. Credit card and auto loan debt also increased, though both experienced their slowest annual growth rates in years. Despite historically high interest rates, credit card and auto loan rates have begun to ease slightly, providing some relief for consumers facing elevated borrowing costs.

Total outstanding U.S. consumer credit reached $5.01 trillion for the first quarter of 2025, according to the Federal Reserve’s G.19 Consumer Credit Report. This is an increase of 1.53% at a seasonally adjusted annual rate (SAAR) compared to the previous quarter, and a 1.93% increase compared to last year. Both rates have slowed from the previous quarter.

Nonrevolving Credit

Nonrevolving credit, largely driven by student and auto loans (the G.19 report excludes mortgage loans), reached $3.68 trillion (SA) in the first quarter of 2025. This marks a 1.23% increase (SAAR) from the previous quarter, and a 1.56% increase from last year.

Student loan debt balances stood at $1.80 trillion (NSA) for the first quarter of 2025, marking a 2.48% increase from a year ago. The end of the COVID-19 Emergency Relief—which allowed 0% interest and halted payments until September 1, 2023—led year-over-year growth to decline for four consecutive quarters, from Q3 2023 through Q2 2024, as borrowers resumed payments and took on less new debt. While the past three quarters have shown a return to growth, the current pace of growth remains below pre-pandemic levels.

Auto loans reached a level of $1.56 trillion (NSA), showing a year-over-year increase of only 0.26%, marking the slowest growth rate since 2010. The deceleration in growth can be attributed to several factors, including stricter lending standards, elevated interest rates, and overall inflation. Auto loan rates for a 60-month new car stood at 8.04% (NSA) for the first quarter of 2025, a historically elevated level. However, auto rates have slowed modestly, decreasing by 0.18 percentage points compared to a year ago.

Revolving Credit

Revolving credit, primarily made up of credit card debt, rose to $1.32 trillion (SA) in the first quarter of 2025. This represents a 2.36% increase (SAAR) from the previous quarter and a 2.98% increase year-over-year. Both measures reflect a notable slowdown, marking the weakest growth in revolving credit in several years. This deceleration comes as credit card interest rates remain elevated, with the average rate held by commercial banks (NSA) at 21.37%. Although rates have hovered near historic highs since Q4 2022, the past two quarters have shown modest year-over-year declines, reflecting the impact of rate cuts that began in 2024.

Discover more from Eye On Housing

Subscribe to get the latest posts sent to your email.


This article was originally published by a eyeonhousing.org . Read the Original article here. .

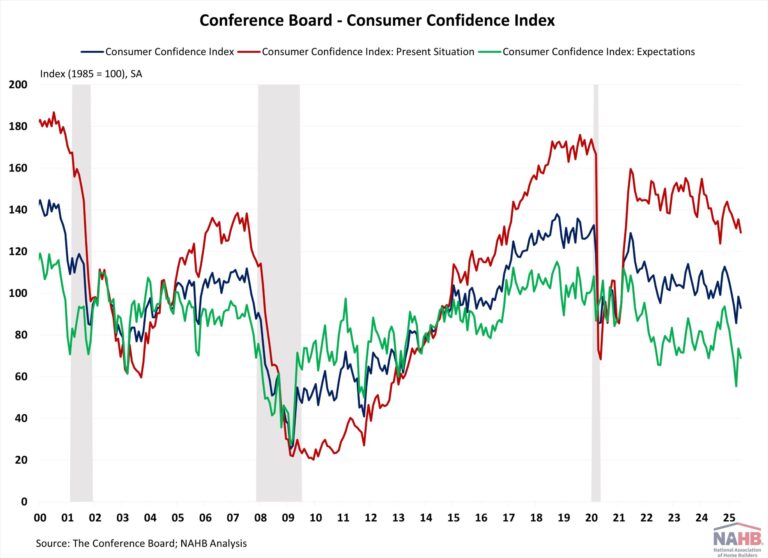
Consumer confidence fell for the fourth straight month amid growing concerns about the economic outlook and policy uncertainties, especially potential tariffs. Uncertainties continue to weigh on consumer sentiment as consumer confidence dropped to a 4-year low and expectations for the future economy fell to a 12-year low. The persistent decline in sentiment has raised recession concerns as consumers have grown pessimistic about economic conditions.

The Consumer Confidence Index, reported by the Conference Board, is a survey measuring how optimistic or pessimistic consumers feel about their financial situation. This index fell from 100 to 92.9 in March, the largest monthly decline since August 2021 and the lowest level since February 2021. The Consumer Confidence Index consists of two components: how consumers feel about their present situation and about their expected situation. The Present Situation Index decreased 3.6 points from 138.1 to 134.5, and the Expectation Situation Index dropped 9.6 points from 74.8 to 65.2, the lowest level since February 2013. This is the second consecutive month that the Expectation Index has been below 80, a threshold that often signals a recession within a year.

Consumers’ assessment of current business conditions turned negative in March. The share of respondents rating business conditions “good” decreased by 1.4 percentage points to 17.7%, while those claiming business conditions as “bad” rose by 1.8 percentage points to 16.7%. However, consumers’ assessments of the labor market improved slightly. The share of respondents reporting that jobs were “plentiful” remained unchanged at 33.6%, and those who saw jobs as “hard to get” decreased by 0.3 percentage points to 15.7%.

Consumers were pessimistic about the short-term outlook. The share of respondents expecting business conditions to improve fell from 20.8% to 17.1%, while those expecting business conditions to deteriorate rose from 25.5% to 27.3%. Similarly, expectations of employment over the next six months were less positive. The share of respondents expecting “more jobs” decreased by 2.1 percentage points to 16.7%, and those anticipating “fewer jobs” climbed by 1.9 percentage points to 28.5%.

The Conference Board also reported the share of respondents planning to buy a home within six months. The share of respondents planning to buy a home rose slightly to 5.4% in March. Of those, respondents planning to buy a newly constructed home increased to 0.5%, and those planning to buy an existing home dropped to 2.3%. The remaining 2.6% were planning to buy a home but undecided between new or existing homes.

Discover more from Eye On Housing

Subscribe to get the latest posts sent to your email.


This article was originally published by a eyeonhousing.org . Read the Original article here. .

Total outstanding U.S. consumer credit stood at $5.15 trillion for the fourth quarter of 2024, increasing at an annualized rate of 4.22% (seasonally adjusted), according to the Federal Reserve’s G.19 Consumer Credit Report. This is an uptick from the third quarter of 2024’s rate of 2.47%. 

The G.19 report excludes mortgage loans, so the data primarily reflects consumer credit in the form of student loans, auto loans, and credit card plans. As consumer spending has outpaced personal income, savings rates have been declining, and consumer credit has increased. Previously, consumer credit growth had slowed, as high inflation and rising interest rates led people to reduce their borrowing. However, in the last two quarters, growth rates have increased, reflecting the rate cuts that took place at the end of the third quarter.  

Nonrevolving Credit  

Nonrevolving credit, largely driven by student and auto loans, reached $3.76 trillion (SA) in the fourth quarter of 2024, marking a 3.11% increase at a seasonally adjusted annual rate (SAAR). This is an uptick from last quarter’s rate of 2.28%, and the highest in two years.  

Student loan debt balances stood at $1.78 trillion (NSA) for the fourth quarter of 2024. Year-over-year, student loan debt rose 2.77%, the largest yearly increase since the second quarter of 2021. This shift partially reflects the expiration of the COVID-19 Emergency Relief for student loans’ 0-interest payment pause that ended September 1, 2023. 

Auto loans reached a total of $1.57 trillion, showing a year-over-year increase of only 0.93%. This marks the second slowest growth rate since 2010, slightly above last quarter’s rate of 0.91%. The deceleration in growth can be attributed to several factors, including stricter lending standards, elevated interest rates, and overall inflation. Although interest rates for 5-year new car loans fell to 7.82% in the fourth quarter from a high of 8.40% in the third quarter, they remain at their highest levels in over a decade. 

Revolving Credit 

Revolving credit, primarily credit card debt, reached $1.38 trillion (SA) in the fourth quarter, rising at an annualized rate of 7.34%. This marked a significant increase from the third quarter’s 3.01% rate but was notably down from the peak growth rate of 17.58% seen in the first quarter of 2022. The surge in credit card balances in early 2022 was accompanied by an increase in the credit card rate which climbed by 4.51 percentage points over 2022. This was an exceptionally steep increase, as no other year in the past two decades had seen a rate jump of more than two percentage points.  

Comparatively, so far in 2024 the credit card rate decreased 0.12 percentage points. For the fourth quarter of 2024, the average credit card rate held by commercial banks (NSA) was 21.47%. 

Discover more from Eye On Housing

Subscribe to get the latest posts sent to your email.


This article was originally published by a eyeonhousing.org . Read the Original article here. .
Pin It