Tag

Concerns

Browsing


Economic uncertainty and persistent affordability challenges driven by rising material prices, high land costs, and elevated mortgage rates continue to weigh on builder sentiment.

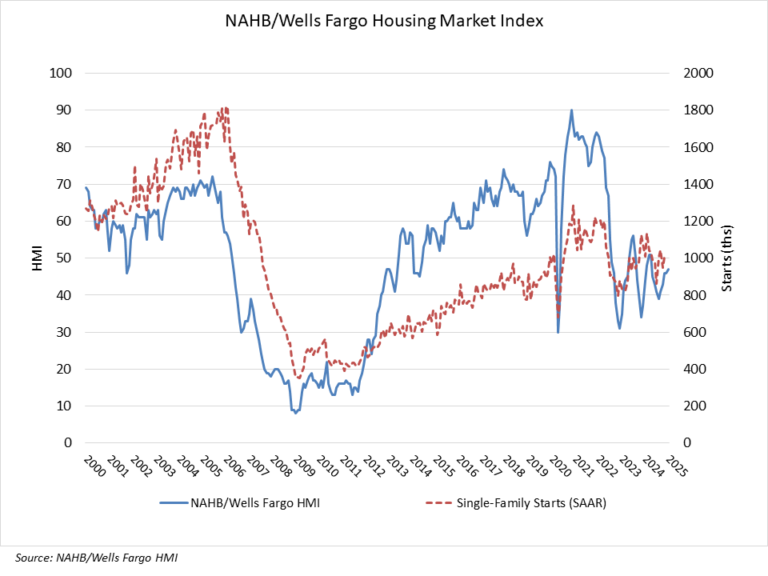
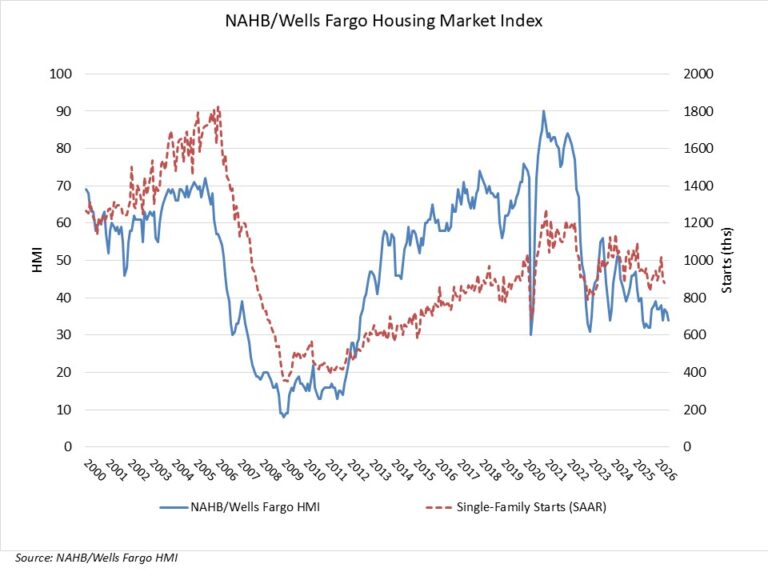
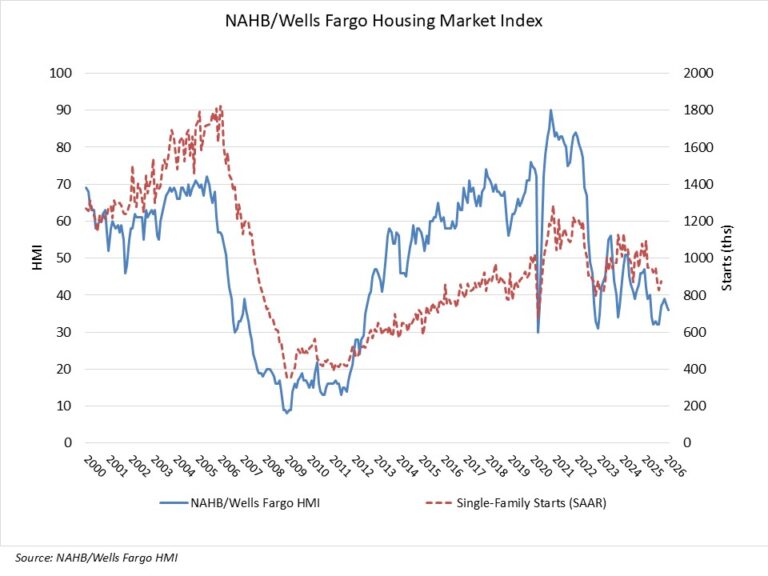
Builder confidence in the market for newly built single-family homes fell two points to 34 in July, down from an upwardly revised reading of 36 in June, according to the National Association of Home Builders (NAHB)/Wells Fargo Housing Market Index (HMI). Sentiment has remained below 40 for 15 consecutive months, the longest such stretch since 2012.

With the HMI below 40 for 15 straight months, affordability remains the home building industry’s primary challenge, as elevated mortgage rates, costly land, rising material prices, and persistent skilled labor shortages continue to affect the market. Looking ahead, the newly enacted 21st Century ROAD to Housing Act is a positive step that will help expand housing supply and lower overall housing costs, although more policy change is needed at the state and local level.

The latest HMI survey also revealed that 37% of builders cut prices in July, up from 35% in June and 32% in May. The average price reduction was 6% in July, the same rate as the previous month. The use of sales incentives was 63% in July, up slightly from 62% in June, and marking the 16th consecutive month this share has reached 60% or higher.

Derived from a monthly survey that NAHB has been conducting for more than 40 years, the NAHB/Wells Fargo HMI gauges builder perceptions of current single-family home sales and sales expectations for the next six months as “good,” “fair” or “poor.” The survey also asks builders to rate traffic of prospective buyers as “high to very high,” “average” or “low to very low.” Scores for each component are then used to calculate a seasonally adjusted index where any number over 50 indicates that more builders view conditions as good than poor.

All of the HMI sub-indices posted declines in July. The HMI index gauging current sales conditions fell one point to 37, the index measuring future sales dropped two points to 43 and the index charting traffic of prospective buyers posted a two-point decline to 23.

Looking at the three-month moving averages for regional HMI scores, the Northeast rose one point to 45, the Midwest increased two points to 45, the South fell one point to 33 and the West dropped one point to 26. The HMI tables can be found at nahb.org/hmi.


This article was originally published by a eyeonhousing.org . Read the Original article here. .

Elevated mortgage rates, rising inflation and economic uncertainty kept many buyers out of the market in May as consumers and builders continue to deal with challenging affordability conditions. While monthly sales activity softened, builders continue to operate in a market characterized by cautious buyers and persistent financing constraints.

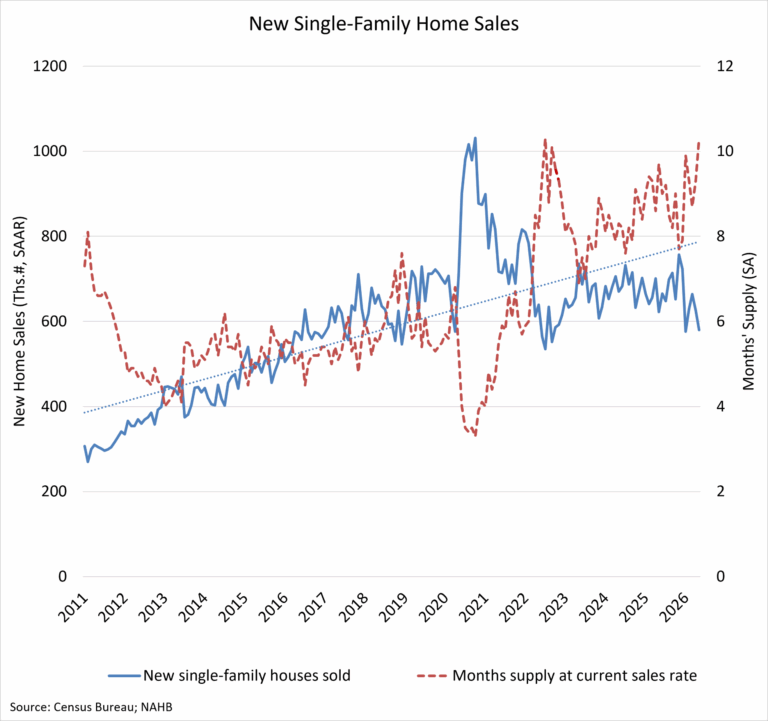
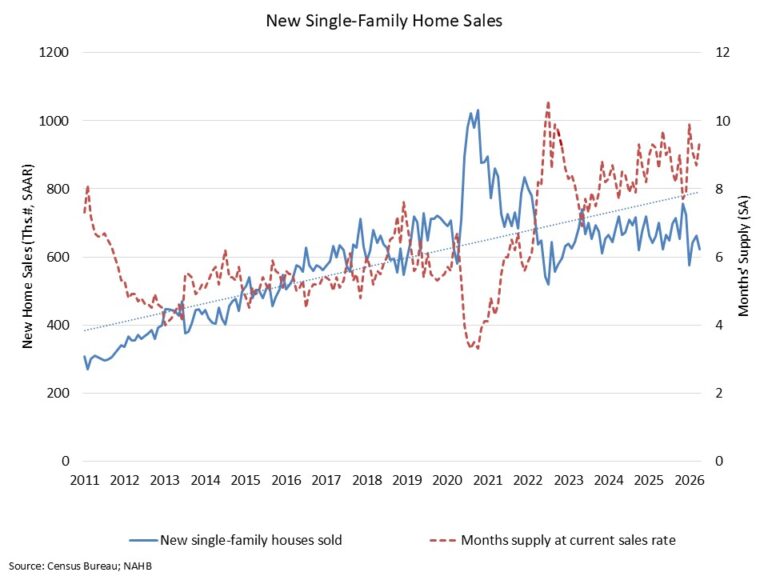
Sales of newly built single-family homes fell 7.3% month-over-month in May to a seasonally adjusted annual rate of 580,000 units, according to the U.S. Department of Housing and Urban Development and the U.S. Census Bureau. This represented a 6.8% decline compared to a year earlier. A new home sale is recorded when a contract is signed, or a deposit is accepted, regardless of the stage of construction. The seasonally adjusted annual rate reflects the pace of sales that would occur over a 12-month period if current conditions persist.

New single-family home inventory totaled 496,000 units in May, up 2.3% from the prior month but down 1.4% from a year earlier. At the current sales pace, the months’ supply of new homes stood at an elevated 10.3 months, above the 9.7 months recorded one year ago. A five to six-months inventory level is generally considered to indicate a balanced market.      

Combined new and existing home inventory has edged higher in recent months, with the total months’ supply reaching 5.2 months. Inventory conditions in the existing home market have gradually improved in recent months. Moderating prices across both markets have helped support buyer demand amid ongoing affordability concerns.

At the end of May, there were 115,000 completed, ready-to-occupy homes available for sale on a non-seasonally adjusted basis, unchanged from a year earlier. Completed homes accounted for one-quarter of total inventory, while homes under construction made up 53%. The remaining 24% of homes sold in May had not yet started construction at the time the sales contract was signed.

Home prices remained relatively stable despite the slowdown in sales activity. The median new home sale price was $424,900, up 2.0% from April and essentially unchanged from a year ago. Homes priced between $300,000 and $499,999 accounted for half of all new home sales, while only 15% of sales were priced below $300,000, underscoring ongoing affordability challenges for entry-level buyers. The remaining 35% of the homes were priced above $500,000.

Regional performance was mixed in May. The Midwest posted the strongest monthly gain in sales, rising 16.2% from April, while the Northeast recorded a modest 3.0% increase. In contrast, sales declined in both the South and West, with the West experiencing the sharpest drop, falling 26.9% from the previous month.

Compared with May 2025, the Northeast was the only region to record a year-over-year gain, with sales increasing 17.2%. Sales declined 3.7% in the Midwest, 5.4% in the South, and 17.0% in the West.

On a year-to-date basis, regional trends were similarly uneven. New home sales increased 4.2% in the Midwest and 1.9% in the Northeast compared with the same period last year. Meanwhile, sales were down 8.2% in the South and 11.4% in the West, indicating that housing market weakness remains concentrated in the nation’s largest home building regions.


This article was originally published by a eyeonhousing.org . Read the Original article here. .


Builder sentiment remains subdued as rising material costs, elevated mortgage rates and ongoing affordability challenges continue to strain the housing market.

Builder confidence in the market for newly built single-family homes fell two points to 35 in June, according to the National Association of Home Builders (NAHB)/Wells Fargo Housing Market Index (HMI). This is the 14th straight month that sentiment has remained below 40, a streak not seen since 2011-2012 during the foreclosure crisis.

Costly and inefficient regulatory policy is clearly impeding the ability of builders to increase the housing supply. According to a new NAHB study, government regulation, taxes, fees and other costs add more than 26% to the price of an average single-family home. Easing permitting bottlenecks, density limits and inefficient zoning rules would help reduce costs and support the housing growth the nation needs.

The latest HMI survey also revealed that 35% of builders cut prices in June, up from 32% in May. The average price reduction was 6% in June, the same rate as the previous month. The use of sales incentives was 62% in June, up slightly from 61% in May, and marking the 15th consecutive month this share has reached 60% or higher.

Derived from a monthly survey that NAHB has been conducting for more than 40 years, the NAHB/Wells Fargo HMI gauges builder perceptions of current single-family home sales and sales expectations for the next six months as “good,” “fair” or “poor.” The survey also asks builders to rate traffic of prospective buyers as “high to very high,” “average” or “low to very low.” Scores for each component are then used to calculate a seasonally adjusted index where any number over 50 indicates that more builders view conditions as good than poor.

The HMI index gauging current sales conditions fell two points to 38 in June, the index measuring future sales held steady at 45 and the index charting traffic of prospective buyers remained unchanged at 25.

Looking at the three-month moving averages for regional HMI scores, the Northeast rose two points to 44, the Midwest held constant at 43, the South fell two points to 33 and the West dropped one point to 27. The HMI tables can be found at nahb.org/hmi.

Discover more from Eye On Housing

Subscribe to get the latest posts sent to your email.


This article was originally published by a eyeonhousing.org . Read the Original article here. .


Elevated mortgage rates, higher inflation and economic uncertainty kept more buyers on the sidelines in April as ongoing affordability challenges continue.

Sales of newly built single-family homes fell 6.2% in April to a seasonally adjusted annual rate of 622,000, according to data from the U.S. Department of Housing and Urban Development and the U.S. Census Bureau. The pace of new home sales is down 11.3% from a year earlier.

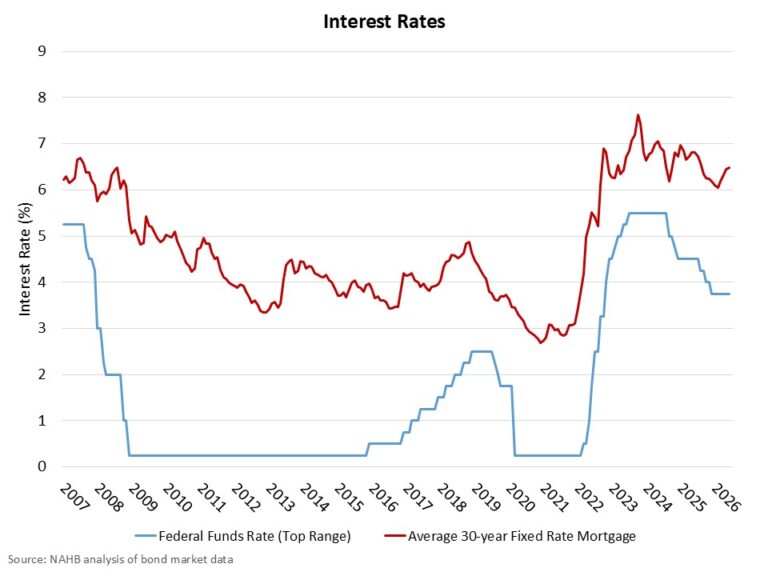
Mortgage interest rates increased from a monthly average of 6.18% in March to 6.33% in April per Freddie Mac, dampening homebuyer demand. Rates moved higher again in May to just above 6.4% as oil prices and short-term inflation expectations increased.

New home sales are on track to decline in 2026 as mortgage rates are expected to remain elevated in the months ahead. The Midwest remains a bright spot, with sales up 7.3% year to date, compared with declines in the rest of the country. The Midwest benefits from relative advantages for homebuyer affordability.

A new home sale occurs when a sales contract is signed, or a deposit is accepted. The home can be in any stage of construction: not yet started, under construction or completed. In addition to adjusting for seasonal effects, the April reading of 622,000 units is the number of homes that would sell if this pace continued for the next 12 months.

New single-family home inventory in April rose to 489,000 units, up 1.7% compared to the previous month. This represents an elevated 9.4 months’ supply at the current building pace. Completed, ready-to-occupy inventory accounted for 122,000 homes in April, up 6.1% from a year ago but down from the cyclical peak of 128,000 in January.

The median new home sale price was $422,500, up 8.0% from March and up 2.2% from a year ago.

Regionally, on a year-to-date basis, new home sales are up 7.3% in the Midwest. New home sales are down 9.7% in the Northeast, 7.6% in the South and 9.5% in the West.


This article was originally published by a eyeonhousing.org . Read the Original article here. .


Builder sentiment inched up in March even as builders continue to express affordability concerns stemming from elevated construction costs and shortages of buildable lots and labor.

Builder confidence in the market for newly built single-family homes rose one point to 38 in March, following a revised upward one-point revision in February, according to the National Association of Home Builders (NAHB)/Wells Fargo Housing Market Index (HMI). All responses to the March survey were received after the conflict with Iran started.

Affordability for buyers and builders remains a top concern. Many buyers remain on the fence waiting for lower interest rates and due to economic uncertainty.

While the Freddie Mac 30-year fixed rate mortgage averaged 6.05% in February, the lowest since August 2022, downpayment hurdles and uncertainty from the conflict with Iran and the price of oil will be headwinds going forward. The administration’s executive orders issued last week to reduce regulatory burdens associated with home building are a positive step toward increasing attainable housing supply.

The latest HMI survey also revealed that 37% of builders cut prices in March, up slightly from 36% in February. The average price reduction remained stable at 6%. The use of sales incentives was 64% in March, down one percentage point from February, and marking the 12th consecutive month this share exceeded 60%.

Derived from a monthly survey that NAHB has been conducting for more than 40 years, the NAHB/Wells Fargo HMI gauges builder perceptions of current single-family home sales and sales expectations for the next six months as “good,” “fair” or “poor.” The survey also asks builders to rate traffic of prospective buyers as “high to very high,” “average” or “low to very low.” Scores for each component are then used to calculate a seasonally adjusted index where any number over 50 indicates that more builders view conditions as good than poor.

All three of the major HMI indices posted gains in March. The HMI index gauging current sales conditions increased one point to 42 from February to March, the index measuring future sales gained two points to 49 and the index charting traffic of prospective buyers posted a three-point increase to 25.

Looking at the three-month moving averages for regional HMI scores, the Northeast held steady at 44, the Midwest was unchanged at 43, the South held constant at 35 and the West fell two points to 31. The HMI tables can be found at nahb.org/hmi.


This article was originally published by a eyeonhousing.org . Read the Original article here. .

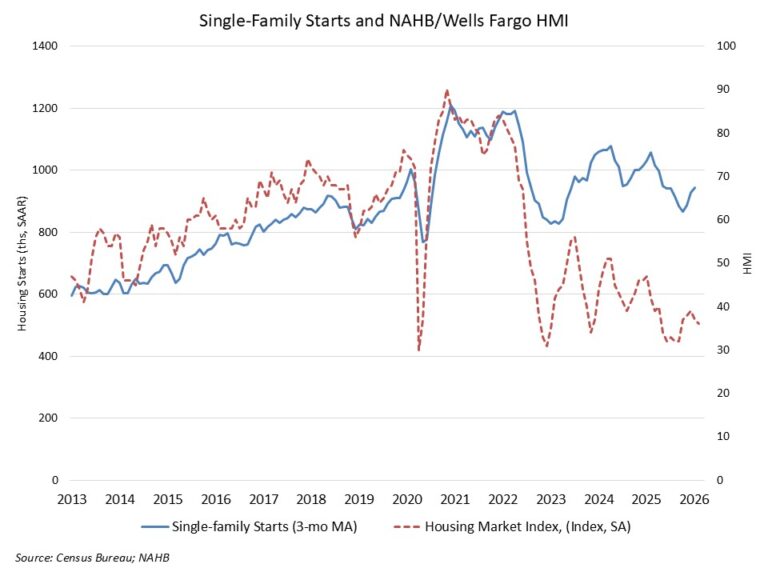
Elevated construction costs and constrained affordability conditions led to a reduction in single-family housing starts in January.

However, led by solid multifamily production, overall housing starts increased 7.2% in January to a seasonally adjusted annual rate of 1.49 million units, according to a report from the U.S. Department of Housing and Urban Development and the U.S. Census Bureau.

The January reading of 1.49 million starts is the number of housing units builders would begin if development kept this pace for the next 12 months.

Within this overall number, single-family starts decreased 2.8% to a 935,000 seasonally adjusted annual rate. Weather effects also likely depressed single-family construction in the Northeast, where single-family starts were down 33% from December 2025 and down more than 6% compared to January 2025 readings.

The multifamily sector, which includes apartment buildings and condos, increased 30% to an annualized 552,000 pace. However, this data may be revised lower in future revisions. Furthermore, prior NAHB analysis of the geography of permit data has shown recent gains for apartment construction occurring in lower density areas, such as exurbs, secondary cities and small towns.

On a regional basis compared to the previous month, combined single-family and multifamily starts were 47.4% higher in the Northeast, 10.8% lower in the Midwest, 11.4% higher in the South and 7.5% lower in the West.

Overall permits decreased 5.4% to a 1.38 million unit annualized rate in January. Single-family permits decreased 0.9% to an 873,000-unit rate, which is the weakest reading since August of last year. This is an indicator of relatively flat construction starts conditions for 2026 amid the ongoing affordability crisis. Multifamily permits decreased 12% to an annualized 503,000 pace.

Looking at regional permit data compared to the previous month, permits were 9.6% lower in the Northeast, 9% higher in the Midwest, 3.5% lower in the South and 15.7% in the West.

The number of single-family homes under construction fell back to 582,000 in January, down 8.8% year over year as the single-family home building market has slowed. Despite recent gains for apartment construction, the number of apartments under construction has fallen back to 686,000 units, a 10% decline from January 2025.

The multiyear trend of a smaller number of units under construction is consistent with builders pulling back construction given higher post-covid construction costs and affordability constraints.


This article was originally published by a eyeonhousing.org . Read the Original article here. .

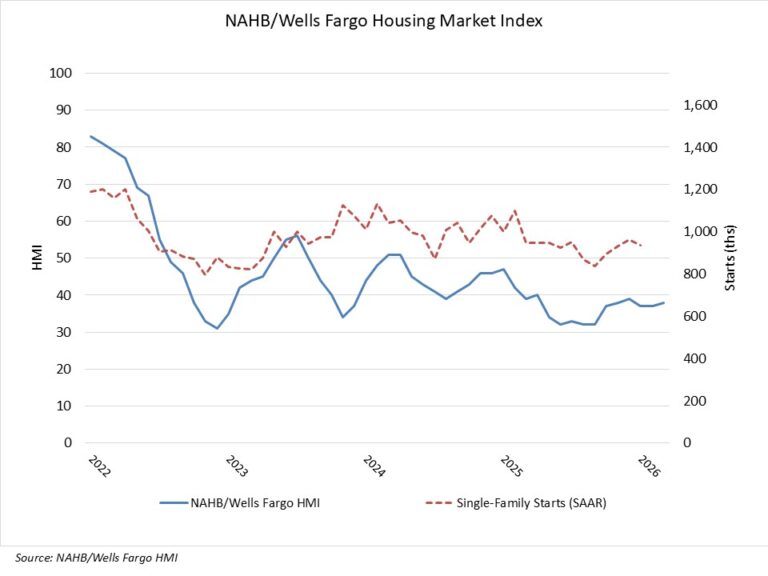
Builder confidence in the market for newly built single-family homes fell one point to 36 in February, according to the National Association of Home Builders (NAHB)/Wells Fargo Housing Market Index (HMI).

Persistent affordability challenges, including high housing price-to-income ratios and elevated land and construction costs, helped push builder confidence lower for the second straight month to start the year.

Housing affordability remains an ongoing challenge at the start of 2026. The solution for the housing market is the enactment of policies that will bend the construction cost curve and enable additional supply of attainable housing. On the positive side, easing inflation should continue to allow lower interest rates for mortgages and builder loans.

The latest HMI survey also revealed that 36% of builders cut prices in February, down from 40% in January. While this marks the lowest incidence of price-cutting since last May (34%), the average price reduction remains at 6%. The use of sales incentives was 65% in February, unchanged from January, and marking the 11th consecutive month this share has exceeded 60%.

While the majority of builders continue to deploy buyer incentives, including price cuts, many prospective buyers remain on the sidelines. Although demand for new construction has weakened, remodeling demand has remained solid given a lack of household mobility, per comments from builders in the HMI.

Derived from a monthly survey that NAHB has been conducting for more than 40 years, the NAHB/Wells Fargo HMI gauges builder perceptions of current single-family home sales and sales expectations for the next six months as “good,” “fair” or “poor.” The survey also asks builders to rate traffic of prospective buyers as “high to very high,” “average” or “low to very low.” Scores for each component are then used to calculate a seasonally adjusted index where any number over 50 indicates that more builders view conditions as good than poor.

The HMI index gauging current sales conditions held steady at 41 from January to February, the index measuring future sales fell three points to 46 and the gauge charting traffic of prospective buyers fell two points to 22.

Looking at the three-month moving averages for regional HMI scores, the Northeast fell one point to 43, the Midwest held steady at 43, the South dropped one point to 35 and the West fell two points to 33. HMI tables can be found at nahb.org/hmi.

Editor’s Note: With the official 2026 release schedule for the Survey of Construction still unavailable from the U.S. Census Bureau, NAHB confirms the HMI for March 2026 will be released on March 16.  A schedule for the rest of the year will be available as soon as possible.


This article was originally published by a eyeonhousing.org . Read the Original article here. .

Builder sentiment fell sharply in February over concerns on tariffs, elevated mortgage rates and high housing costs.

Builder confidence in the market for newly built single-family homes was 42 in February, down five points from January and the lowest level in five months, according to the National Association of Home Builders (NAHB)/Wells Fargo Housing Market Index (HMI).

While builders hold out hope for pro-development policies, particularly for regulatory reform, policy uncertainty and cost factors created a reset for 2025 expectations in the most recent HMI. Uncertainty on the tariff front helped push builders’ expectations for future sales volume down to the lowest level since December 2023.

With 32% of appliances and 30% of softwood lumber coming from international trade, uncertainty over the scale and scope of tariffs has builders further concerned about costs. Reflecting this outlook, builder responses collected prior to a pause for the proposed tariffs on goods from Canada and Mexico yielded a lower HMI reading of 38, while those collected after the announced one-month pause produced a score of 44. Addressing the elevated pace of shelter inflation requires bending the housing cost curve to enable adding more attainable housing.

Incentive use may also be weakening as a sales strategy as elevated interest rates reduce the pool of eligible home buyers. The latest HMI survey also revealed that 26% of builders cut home prices in February, down from 30% in January and the lowest share since May 2024. Meanwhile, the average price reduction was 5% in February, the same rate as the previous month. The use of sales incentives was 59% in February, down from 61% in January.

Derived from a monthly survey that NAHB has been conducting for more than 35 years, the NAHB/Wells Fargo HMI gauges builder perceptions of current single-family home sales and sales expectations for the next six months as “good,” “fair” or “poor.” The survey also asks builders to rate traffic of prospective buyers as “high to very high,” “average” or “low to very low.” Scores for each component are then used to calculate a seasonally adjusted index where any number over 50 indicates that more builders view conditions as good than poor.

All three of the major HMI indices posted losses in February. The HMI index gauging current sales conditions fell four points to 46, the component measuring sales expectations in the next six months plunged 13 points to 46, and the gauge charting traffic of prospective buyers posted a three-point decline to 29.

Looking at the three-month moving averages for regional HMI scores, the Northeast fell three points in February to 57, the Midwest moved two points lower to 45, the West edged one-point lower to 39 and the South held steady at 46. The HMI tables can be found at nahb.org/hmi.

Discover more from Eye On Housing

Subscribe to get the latest posts sent to your email.


This article was originally published by a eyeonhousing.org . Read the Original article here. .

Builder sentiment edged higher to begin the year on hopes for an improved economic growth and regulatory environment. At the same time, builders expressed concerns over building material tariffs and costs and a larger government deficit that would put upward pressure on inflation and mortgage rates.

Builder confidence in the market for newly built single-family homes was 47 in January, up one point from December, according to the National Association of Home Builders (NAHB)/Wells Fargo Housing Market Index (HMI).

Builders are facing continued challenges for housing demand in the near-term, with mortgage rates up from near 6.1% in late September to above 6.9% today. Land is expensive and financing for private builders remains costly. However, there is hope that policymakers are taking the impact of regulatory hurdles seriously and will make improvements in 2025.

NAHB is forecasting a slight gain for single-family housing starts in 2025, as the market faces offsetting upside and downside risks from an improving regulatory outlook and ongoing elevated interest rates,. And while ongoing, but slower, easing from the Federal Reserve should help financing for private builders currently squeezed out of some local markets, builders report cancellations are climbing as a direct result of mortgage rates rising back up near 7%.

The latest HMI survey also revealed that 30% of builders cut home prices in January. This share has been stable between 30% and 33% since last July. Meanwhile, the average price reduction was 5% in January, the same rate as in December. The use of sales incentives was 61% in January. This share has remained between 60% and 64% since last June.

Derived from a monthly survey that NAHB has been conducting for more than 35 years, the NAHB/Wells Fargo HMI gauges builder perceptions of current single-family home sales and sales expectations for the next six months as “good,” “fair” or “poor.” The survey also asks builders to rate traffic of prospective buyers as “high to very high,” “average” or “low to very low.” Scores for each component are then used to calculate a seasonally adjusted index where any number over 50 indicates that more builders view conditions as good than poor.

The HMI index gauging current sales conditions rose three points to 51 and the gauge charting traffic of prospective buyers posted a two-point gain to 33. The component measuring sales expectations in the next six months fell six points to 60 because of the elevated interest rate environment. While this serves as a cautionary note, the future sales component is still the highest of the three sub-indices and well above the breakeven level of 50.

Looking at the three-month moving averages for regional HMI scores, the Northeast increased five points to 60, the Midwest moved one point higher to 47, the South posted a one-point gain to 46 and the West fell one point to 40. The HMI tables can be found at nahb.org/hmi.

Discover more from Eye On Housing

Subscribe to get the latest posts sent to your email.


This article was originally published by a eyeonhousing.org . Read the Original article here. .

Consumer confidence fell to a 3-month low in September due to growing concerns about the job market, despite the labor market remaining healthy. Recent job growth revisions showed fewer jobs were added in 2023 than initially reported. However, the unemployment rate remained at a relatively low level and wage growth continued to outpace inflation. This suggests the labor market is cooling from its red-hot pace but remains steady. 

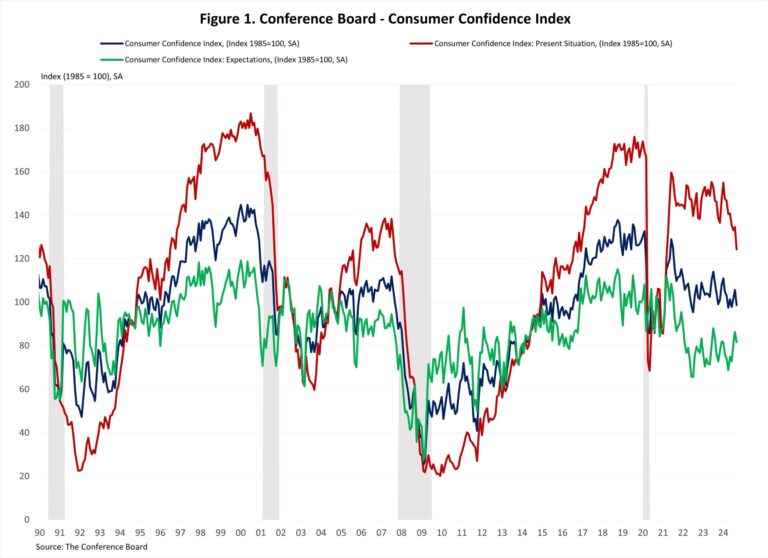
The Consumer Confidence Index, reported by the Conference Board, is a survey measuring how optimistic or pessimistic consumers feel about their financial situation. This index fell from 105.6 to 98.7 in September, the largest monthly decline since August 2021. The Consumer Confidence Index consists of two components: how consumers feel about their present situation and about their expected situation. The Present Situation Index decreased 10.3 points from 134.6 to 124.3, and the Expectation Situation Index fell 4.6 points from 86.3 to 81.7, but still remained above the 80 threshold. Historically, an Expectation Index reading below 80 often signals a recession within a year.

Consumers’ assessment of current business conditions turned negative in September. The share of respondents rating business conditions “good” decreased by 2.3 percentage points to 18.8%, while those claiming business conditions as “bad” rose by 2.9 percentage points to 20.2%. Consumers’ assessments of the labor market worsened as well. The share of respondents reporting that jobs were “plentiful” decreased by 1.8 percentage points to 30.9%, while those who saw jobs as “hard to get” increased by 1.5 percentage points to 18.3%.

Consumers were also less optimistic about the short-term outlook. The share of respondents expecting business conditions to improve fell from 19.1% to 18.5%, while those expecting business conditions to deteriorate rose from 14.5% to 16.6%. Similarly, expectations of employment over the next six months were less positive. The share of respondents expecting “more jobs” increased by 0.1 percentage points to 16.4%, and those anticipating “fewer jobs” climbed by 1.3 percentage points to 18.3%.

The Conference Board also reported the share of respondents planning to buy a home within six months. The share of respondents planning to buy a home rose to 5.7% in September. Of those, respondents planning to buy a newly constructed home increased slightly to 0.7%, while those planning to buy an existing home decreased to 2.4%.

Discover more from Eye On Housing

Subscribe to get the latest posts sent to your email.


This article was originally published by a eyeonhousing.org . Read the Original article here. .
Pin It