Tag

Challenges

Browsing


While housing affordability remains out of reach for millions of Americans, particularly first-time and entry-level buyers, conditions have improved modestly in the last year, according to the latest data from the National Association of Home Builders (NAHB)/Wells Fargo Cost of Housing Index (CHI). The CHI results from the first quarter of 2026 show that a family earning the nation’s median income of $106,800 needed 32% of its income to cover the mortgage payment on a median-priced new home. Low-income families, defined as those earning only 50% of median income, would have to spend 65% of their earnings to pay for the same new home.

In the last year, the income share needed to buy a new home declined from 36% in the second quarter of 2025, to 35% in the third quarter, 34% in the fourth quarter, and to 32% in the first quarter of 2026. Although home buyers continue to grapple with elevated mortgage rates and economic uncertainty, these figures indicate a modest improvement in affordability.

The same trend holds true for existing homes. A typical family would have had to pay 37% of their income for a median-priced existing home in the second quarter of 2025, 36% in the third quarter, 34% in the fourth quarter, and 32% in the first quarter of 2026. A low-income family would have needed to pay 65% of their earnings to make the same mortgage payment on an existing home in the first three months of 2026.

The U.S. data for the percentage of earnings needed to purchase a new home in the first quarter is based on a national median new home price of $403,200 and median income of $106,800. The first quarter median new home price is down slightly from $405,300 in the fourth quarter of 2025. Meanwhile, the corresponding price for an existing home fell more sharply in the first quarter to $404,300 from $414,900 in the previous quarter. The average 30-year mortgage rate edged slightly lower from 6.32% in the fourth quarter to 6.20% in the first quarter.

CHI is also available for 175 metropolitan areas, calculating the percentage of a family’s income needed to make the mortgage payment on an existing home based on the local median home price and median income in those markets.

In seven out of 175 markets in the first quarter, the typical family is severely cost-burdened (must pay more than 50% of their income on a median-priced existing home). In 59 other markets, such families are cost-burdened (need to pay between 31% and 50%). There are 109 markets where the CHI is 30% of earnings or lower.

The Top 5 Severely Cost-Burdened Markets

San Jose-Sunnyvale-Santa Clara, Calif., was the most severely cost-burdened market in the CHI, where 79% of a typical family’s income is needed to make a mortgage payment on an existing home. This was followed by:

Urban Honolulu, Hawaii (68%)

San Diego-Chula Vista-Carlsbad, Calif. (65%)

San Francisco-Oakland-Fremont, Calif. (63%)

Naples-Marco Island, Fla. (58%)

Low-income families would have to pay between 115% and 158% of their income in all five of the above markets to cover a mortgage.

The Top 5 Least Cost-Burdened Markets

By contrast, Decatur, Ill., was the least cost-burdened markets on the CHI, where typical families needed to spend just 12% of their income to pay for a mortgage on an existing home. Rounding out the least burdened markets are:

Peoria, Ill. (15%)

Elmira, N.Y. (16%)

Springfield, Ill. (17%)

Davenport-Moline-Rock Island, Iowa-Ill. (18%)

Low-income families in these markets would have to pay between 25% and 37% of their income to cover the mortgage payment for a median-priced existing home.

Visit nahb.org/chi for tables and details.


This article was originally published by a eyeonhousing.org . Read the Original article here. .


Builder confidence posted a modest gain in May even as buyers grapple with rising mortgage rates and economic uncertainty while builders continue to contend with elevated land, labor and construction costs.

Builder confidence in the market for newly built single-family homes increased three points to 37 in May, according to the National Association of Home Builders (NAHB)/Wells Fargo Housing Market Index (HMI).

Recent increases for long-term interest rates will continue to hold back home buyer demand. Although some regional markets, including parts of the Midwest, are showing relative strength, the housing market continues to face significant affordability challenges.

On the policy front, efforts in the House to modify the 21st Century ROAD to Housing Act could increase the nation’s housing supply and help ease builder concerns. In particular, the revision in the House bill with respect to the harmful built-to-rent proposal is a positive development.

The latest HMI survey also revealed that 32% of builders cut prices in May, down from 36% in April. The average price reduction was 6%, up from the 5% figure in April. The use of sales incentives was 61% in May, up slightly from 60% in April, and marking the 14th consecutive month this share has reached 60% or higher.

Derived from a monthly survey that NAHB has been conducting for more than 40 years, the NAHB/Wells Fargo HMI gauges builder perceptions of current single-family home sales and sales expectations for the next six months as “good,” “fair” or “poor.” The survey also asks builders to rate traffic of prospective buyers as “high to very high,” “average” or “low to very low.” Scores for each component are then used to calculate a seasonally adjusted index where any number over 50 indicates that more builders view conditions as good than poor.

All three of the major HMI indices posted gains in May, as some buyers who had been holding back decided to move forward this spring. The HMI index gauging current sales conditions rose three points to 40 from April to May, the index measuring future sales increased three points to 45 and the index charting traffic of prospective buyers posted a three-point gain to 25.

Looking at the three-month moving averages for regional HMI scores, the Midwest registered a one-point gain to 43, the Northeast rose one point to 42, the South held constant at 35 and the West fell one point to 28.

The HMI tables can be found at nahb.org/hmi.


This article was originally published by a eyeonhousing.org . Read the Original article here. .


Agnieszka Jakubowicz PHOTOGRAPHYSave Photo
2. Unrealistic Expectations

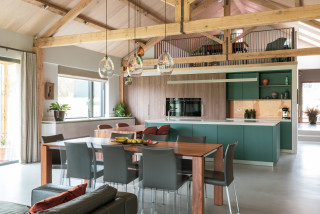
Terry Vinn of Totus Construction says he finds clients can be influenced by television renovation shows. “This can result in a costly mistake as clients have often already paid fees for an architect’s drawings or planning,” he says. “They realize they’re way off in terms of their budget.”

Cat Hoad of Absolute Project Management agrees, saying she often finds a budget is too low for the client’s aspirations in terms of scope and finish.

Solution: “Showing clients the best options and the reality of these costs is the best we can do to inform their choices,” Spencer says. “We always let our clients know they can purchase suggested items over time to spread the cost too.”

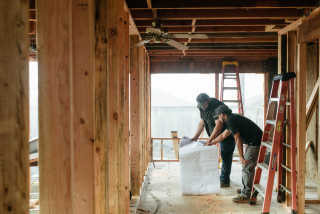
Encouraging clients to consider phasing the work is another option — tackling phase one now with the initial budget, then phase two a year or so later when the budget has recovered.

Vinn underlines the value of getting clients to engage with the builder at the concept stage of the project. “Builders can explain the cost differences between various design options, preventing the need to go back to the drawing board at a later stage, which would equal additional architect’s fees.”

Hoad agrees with starting the conversation early. “One of the first bits of paid work is to set up an outline budget,” she says. Her outline will have headings with the approximate cost for the various professionals involved and estimated costs for each part of the second fix.

“The total can, of course, change dramatically, but it’s a means for the client to see clearly how their money is likely to be spent, and it helps them to make decisions and prioritize accordingly,” she says.


This article was originally published by a
www.houzz.com . Read the Original article here. .


The most significant challenge builders faced in 2025 was high interest rates, as reported by 84% of builders in the latest NAHB/Wells Fargo Housing Market Index survey.  A smaller, albeit still significant share of 65% expect interest rates to remain a problem in 2026. The next four most serious issues builders faced in 2025 were buyers expecting prices/interest rates to decline (81%), concern about employment/economic situation (65%), the cost/availability of developed lots (63%), and negative media reports making buyers cautious (62%). Builders expect these challenges to persist with limited improvement in 2026.

In addition to those top tier challenges, 54% to 61% of builders also reported facing serious problems in 2025 with cost/availability of labor (61%), rising inflation in the US economy (59%) gridlock/uncertainty in Washington (58%), impact/hook-up/inspection and other fees (57%), and local/state environmental regulations and policies (54%). Looking ahead at 2026, fewer builders expect high interest rates (65%) rising inflation in the US economy (46%) to be a significant problem. On the other hand, builders don’t anticipate much change around labor shortages, uncertainty in Washington, fees, or local regulations.

Builders have been asked about their most serious challenges every year since 2011. High interest rates have been a problem for a negligible share of builders (under 10%) during most years, except for 2022 (66%), 2023 (90%), 2024 (91%) and 2025 (84%). Until 2021, relatively few builders reported problems with buyers expecting prices or interest rates to fall, but that share has been rising steadily for the past four years and reached a record high of 81% in 2025. In 2011, concern about employment/economic situation was reported as a significant problem by 79% of builders. This concern faded over the next decade, and by 2021, only 24% cited it as a top issue. But it has escalated rapidly since then, and in 2025 65% of builders rated it a major challenge – the highest since 2012.

The cost/availability of developed lots has been a serious challenge to most builders in 10 of the 15 years of the series history. In 2024 and 2025, the share reached 63%, matching the record high set in 2019. Negative media reports making buyers caution was a significant problem for 63% of builders in 2011. During the 2012–2021 period, the share consistently remained under 50%. From 2022 onward, however, most builders saw it as a serious challenge again, with the share reaching 62% in 2025 – the highest since 2011.

For additional details, including a complete history for each reported and expected problem listed in the survey, please consult the full survey report.


This article was originally published by a eyeonhousing.org . Read the Original article here. .


Single-family housing starts posted a modest gain in July as builders continue to contend with challenging housing affordability conditions and a host of supply-side headwinds, including labor shortages, elevated construction costs and inefficient regulatory costs.

Led by solid multifamily production, overall housing starts increased 5.2% in July to a seasonally adjusted annual rate of 1.43 million units, according to a report from the U.S. Department of Housing and Urban Development and the U.S. Census Bureau.

The July reading of 1.43 million starts is the number of housing units builders would begin if development kept this pace for the next 12 months. Within this overall number, single-family starts increased 2.8% to a 939,000 seasonally adjusted annual rate and are down 4.2% on a year-to-date basis. The multifamily sector, which includes apartment buildings and condos, increased 9.9% to an annualized 489,000 pace.

The slowdown in single-family home building has narrowed the home building pipeline. There are currently 621,000 single-family homes under construction, down 1% in July and 3.7% lower than a year ago. This is the lowest level since early 2021 as builders pull back on supply.

On a regional and year-to-date basis, combined single-family and multifamily starts were 10.2% higher in the Northeast, 17.7% higher in the Midwest, 2.4% lower in the South and 0.5% lower in the West.

Overall permits decreased 2.8% to a 1.35-million-unit annualized rate in July. Single-family permits increased 0.5% to an 870,000-unit rate and are down 5.8% on a year-to-date basis. Multifamily permits decreased 8.2% to a 484,000 pace.

Looking at regional permit data on a year-to-date basis, permits were 16.6% lower in the Northeast, 9.1% higher in the Midwest, 3.4% lower in the South and 5.1% lower in the West.

Discover more from Eye On Housing

Subscribe to get the latest posts sent to your email.


This article was originally published by a eyeonhousing.org . Read the Original article here. .


The quarterly U.S. Houzz Renovation Barometer asks more than 1,000 construction and architecture and design firms on Houzz about their expected, current and recent business activity. The Q3 2025 Barometer, fielded June 14-July 1, 2025, also asked pros how they expect local and national economic factors — including tariffs, inflation and labor shortages — to impact their businesses and the industry at large.

The just-released report reveals that the vast majority of firms across the industry expect these factors to negatively impact business in Q3. This is consistent with reduced optimism industrywide as business activity slows, though more pros still expect business performance to improve overall this quarter than anticipate a decline.

Here are more insights into construction and design businesses’ outlooks in the face of ongoing economic uncertainty.


This article was originally published by a www.houzz.com . Read the Original article here. .


Single-family housing starts declined in June to the lowest rate since July 2024 as elevated interest rates, rising inventories and ongoing supply-side issues continue to act as headwinds for the housing sector.

Due to a solid increase in multifamily production, overall housing starts increased 4.6% in June to a seasonally adjusted annual rate of 1.32 million units, according to a report from the U.S. Department of Housing and Urban Development and the U.S. Census Bureau.

The June reading of 1.32 million starts is the number of housing units builders would begin if development kept this pace for the next 12 months. Within this overall number, single-family starts decreased 4.6% to an 883,000 seasonally adjusted annual rate and are down 10% compared to June 2024. The multifamily sector, which includes apartment buildings and condos, increased 30% to an annualized 438,000 pace.

Single-family building conditions continued to weaken in June as housing affordability challenges caused builder traffic to move lower as buyers moved to the sidelines. Rising levels of resale inventory are also a headwind for the industry.

Single-family home building in the South is down 12.4% on a year-to-date basis, far outpacing declines in the Northeast and the West. However, single-family home building is up 10% on a year-to-date basis in the Midwest, where housing affordability conditions are generally better than much of the nation.

On a regional and year-to-date basis, combined single-family and multifamily starts were 28.8% higher in the Northeast, 13.1% higher in the Midwest, 8.1% lower in the South and 0.6% lower in the West.

Overall permits increased 0.2% to a 1.40-million-unit annualized rate in June. Single-family permits decreased 3.7% to an 866,000-unit rate and are down 8.4% compared to June 2024. Multifamily permits increased 7.3% to a 531,000 pace.

Looking at regional permit data on a year-to-date basis, permits were 16.9% lower in the Northeast, 8.2% higher in the Midwest, 3.3% lower in the South and 3.7% lower in the West.

The declines for single-family home building have caused the number of single-family homes under construction to level off. There are currently 622,000 single-family homes under construction, which is 6% lower than a year ago. The number of apartments under construction in June, 739,000, is 18.8% lower than a year ago.

Discover more from Eye On Housing

Subscribe to get the latest posts sent to your email.


This article was originally published by a eyeonhousing.org . Read the Original article here. .


The most significant challenge builders faced in 2024 was high interest rates, as reported by 91% of builders in the latest NAHB/Wells Fargo Housing Market Index survey.  A smaller, albeit still significant share of 78% expect interest rates to remain a problem in 2025. The next four most serious issues builders faced in 2024 were rising inflation in the U.S. economy (80%), buyers expecting prices/interest rates to decline (77%), the cost/availability of developed lots (63%), and the cost/availability of labor (61%).  Builders don’t expect much improvement in these challenges in 2025, except for rising inflation, which ‘only’ 52% see as a serious problem in the year ahead.

In addition to those top tier challenges, 55% to 60% of builders also reported facing serious problems in 2024 with gridlock/uncertainty in Washington (60%), building material prices (57%), concern about employment/economic situation (55%), impact/hook-up/inspection and other fees (55%), and negative media reports making buyers cautious (55%). Looking ahead at 2025, significantly fewer builders expect gridlock/uncertainty in Washington (32%) or have concerns about the employment/economic situation (39%).  In contrast, more builders are expecting building material prices to be a problem in 2025 (64%) and about the same expect continuing problems with impact and other fees (58%).

Builders have been asked about their most serious challenges every year since 2011. High interest rates have been a problem for a negligible share of builders (under 10%) during most years, except for 2022 (66%), 2023 (90%), and 2024 (91%).  When first introduced to the survey in 2021, 63% of builders reported challenges with rising inflation in the U.S. economy, but the share grew to at least 80% in 2022, 2023, and 2024. Prior to 2022, relatively few builders reported problems with buyers expecting prices or interest rates to fall, but that share rose to 49% in 2022, 71% in 2023, and 77% in 2024.

The cost/availability of developed lots has been a serious challenge to most builders in nine of the 14 years of the series history. In 2022, 51% of builders faced this problem; by 2024, 63% did—tying a record high set in 2019. Meanwhile, more than half of builders have reported the cost/availability of labor as a serious problem for the past 11 years in a row. While 82% and 85% of builders faced this challenge in 2021 and 2022, respectively, the share has eased to 73% in 2023 and to 61% in 2024.

For additional details, including a complete history for each reported and expected problem listed in the survey, please consult the full survey report.

Discover more from Eye On Housing

Subscribe to get the latest posts sent to your email.


This article was originally published by a eyeonhousing.org . Read the Original article here. .


4. Historical Preservation

Bringing a fresh look to a historical home’s landscape while still maintaining some original charm means navigating a fine line between past and present.

Challenge: Designer Sara Yant of Twistleaf was tasked with reimagining outdoor spaces in the Historic District of Fredericksburg, Texas, including for a Queen Anne Victorian mansion, a carriage house, a five-unit barn conversion and three 1930s bungalows. “We needed to create a cohesive look that would complement the different architectural styles and prioritize an intuitive circulation between the spaces,” Yant says.

There were some hiccups along the way that impacted the original plan. A long-abandoned and crumbling drainage pipe beneath the mansion’s front yard was a safety risk. Stringent watering restrictions also were implemented for the Texas Hill Country during that time.

Solution: Yant replaced the fencing and gates with period-appropriate designs. She also updated the hardscape using a mix of concrete, bricks and decomposed granite to create paths and relaxing courtyards and retreats. Removing the crumbling pipe allowed her to reinforce the surrounding ground.

She finished the space with a mix of native and adapted plants that complement the architecture of the Queen Anne Victorian home. Black and blue sage and soft leaf yucca provide seasonal interest and attract butterflies and hummingbirds. American beautyberries (Callicarpa americana, USDA zones 6 to 10; find your zone), dwarf palmetto palms (Sabal minor, zones 7 to 10), aromatic aster (Symphyotrichum oblongifolium, zones 3 to 9) and inland sea oats (Chasmanthium latifolium, zones 3 to 8) define the restorative green retreat by the bungalows.

“We also reduced the amount of lawn in the original design and replaced several areas [including the space shown here], with Leavenworth’s sedge (Carex leavenworthii, zones 6 to 9) as a water-conscious solution,” Yant says.


This article was originally published by a www.houzz.com . Read the Original article here. .


With mortgage rates declining by more than one-half of a percentage point from early August through mid-September, per Freddie Mac, builder sentiment edged higher this month even as builders continue to grapple with rising costs.

Builder confidence in the market for newly built single-family homes was 41 in September, up two points from a reading of 39 in August, according to the National Association of Home Builders (NAHB)/Wells Fargo Housing Market Index (HMI). This breaks a string of four consecutive monthly declines.

Due to lower interest rates, builders now have a positive view for future new home sales for the first time since May 2024. However, builders will face competition from rising existing home inventory in many markets as the mortgage rate lock-in effect softens with lower rates.

With inflation moderating, the Federal Reserve is expected to begin a cycle of monetary policy easing this week, which will produce downward pressure on mortgage interest rates and also lower the interest rates on land development and home construction business loans. Lowering the cost of construction is critical to confront persistent challenges for housing affordability.

The latest HMI survey also revealed that the share of builders cutting prices dropped in September for the first time since April, down one point to 32%. Moreover, the average price reduction was 5%, the first time it has been below 6% since July 2022. Meanwhile, the use of sales incentives fell to 61% in September, down from 64% in August.

Derived from a monthly survey that NAHB has been conducting for more than 35 years, the NAHB/Wells Fargo HMI gauges builder perceptions of current single-family home sales and sales expectations for the next six months as “good,” “fair” or “poor.” The survey also asks builders to rate traffic of prospective buyers as “high to very high,” “average” or “low to very low.” Scores for each component are then used to calculate a seasonally adjusted index where any number over 50 indicates that more builders view conditions as good than poor.

All three HMI indices were up in September. The index charting current sales conditions rose one point to 45, the component measuring sales expectations in the next six months increased four points to 53 and the gauge charting traffic of prospective buyers posted a two-point gain to 27.

Looking at the three-month moving averages for regional HMI scores, the Northeast fell three points to 49, the Midwest edged one-point higher to 40, the South decreased one point to 41 and the West increased two points to 39.

The HMI tables can be found at nahb.org/hmi.

Discover more from Eye On Housing

Subscribe to get the latest posts sent to your email.


This article was originally published by a eyeonhousing.org . Read the Original article here. .

Pin It