Tag

August

Browsing


The number of open positions in the construction sector fell back in August per the Bureau of Labor Statistics Job Openings and Labor Turnover Survey (JOLTS). The current level of open jobs is down from three years ago due to declines in construction activity, particularly in housing. Nonetheless, strength in construction for subsectors like data center construction (up 46% year-over-year) is creating demand for construction workers. Further, increasing immigration enforcement actions is having an effect on worker availability, which is also contributing to the number of open positions.

The number of open jobs for the overall economy fell back in August, declining to 7.08 million. The August reading was lower than a year ago (7.34 million). Despite the decline, national job openings remaining in the 7 million range indicates that the labor market remains resilient to recent macro challenges, including higher energy prices.

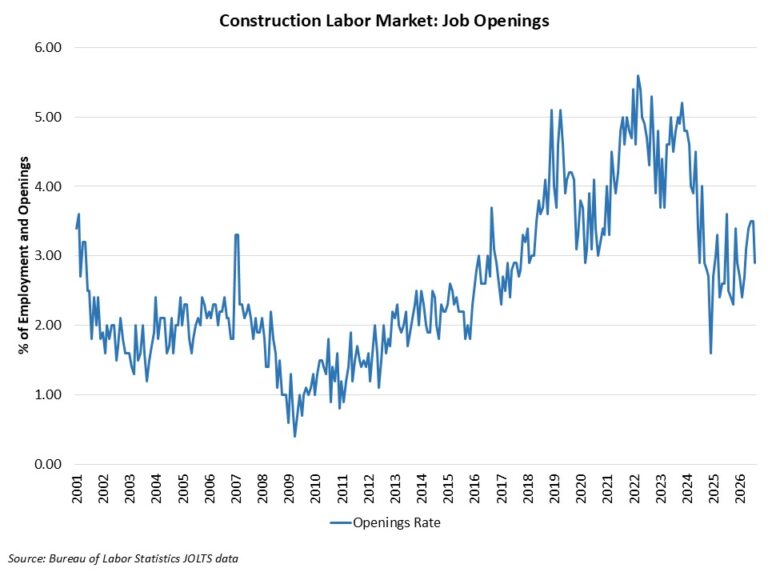
The number of open construction sector jobs declined for the month, decreasing slightly from 299,000 in July to 251,000 in August. This total is higher than the total from a year ago (213,000). The chart below notes a declining trend for the construction job openings rate from 2023 to 2025 (after Fed tightening monetary policy) to a recent rising trend for open positions in construction, albeit with significant month to month noise.

While home building employment has declined over the last year, other sectors of the construction industry have expanded (e.g. data center construction). The industry also faces challenges in terms of no shows at work sites related to immigration enforcement.

The construction job openings rate declined to 2.9% in August, but is up from 2.5% from a year ago.

The construction hiring rate declined to 3.7% in August, down from the 4.1% rate estimated a year ago.

The layoff rate in construction was lower at 1.3% in August. The quits rate was flat at 2.2%.


This article was originally published by a eyeonhousing.org . Read the Original article here. .


State labor markets showed mixed results in August, with nonfarm payroll employment increasing in a majority of states. At the same time, construction employment posted a net gain nationally, although employment trends varied across states. The unemployment rate also remained relatively low in several states, while D.C. continued to record the nation’s highest rate.

In August, nonfarm payroll employment increased in 35 states compared to July, while 15 states and the District of Columbia (D.C.) recorded declines. According to the Bureau of Labor Statistics, total U.S. nonfarm payroll employment increased by 162,000 jobs in August, following a gain of 21,000 jobs in July. Through August, monthly payroll gains have averaged 80,000 jobs per month based on the current data vintage, reflecting upward revisions to employment gains in prior months.

On a month-over-month basis, employment gains were led by California (+39,400), followed by Florida (+21,800) and Wisconsin (+11,800). In contrast, the 15 states and D.C. that recorded losses collectively shed 61,100 jobs, with New York posting the largest decline (-23,500). In percentage terms, New Mexico recorded the strongest increase (+0.6%), while Maryland experienced the largest decrease (-0.3%) between July and August.

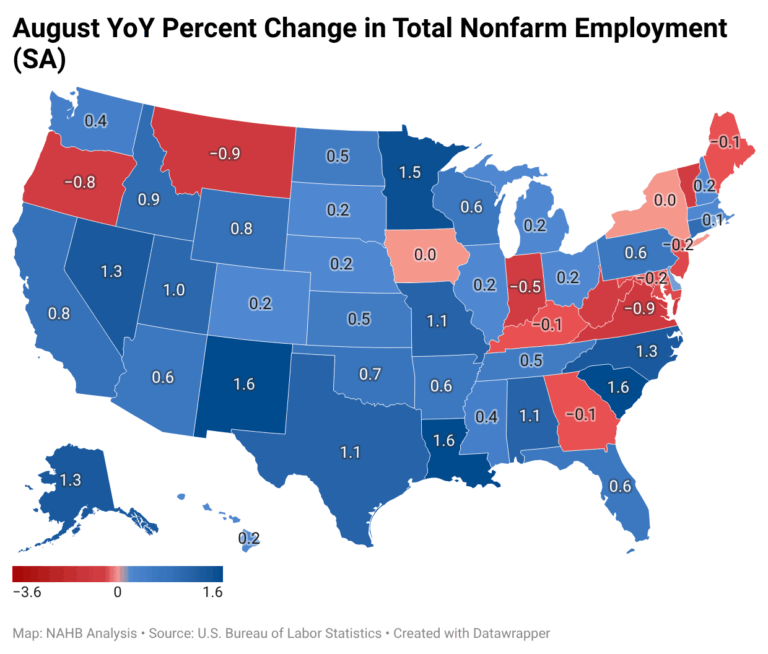
Over the 12 months ending in August, total nonfarm employment increased by 603,000 jobs nationwide, representing a 0.4% gain. Job gains ranged from 300 in Rhode Island to 159,400 in Texas. Collectively, 12 states and D.C. lost 130,400 jobs over the past 12 months, with Virginia recording the largest decline (-37,700).

In percentage terms, job growth ranged from 0.1% in Delaware and Rhode Island to 1.6% in New Mexico, South Carolina, and Louisiana. Iowa and New York reported no change over the past 12 months. Among states experiencing employment declines, losses ranged from 0.1% in Georgia, Kentucky, and Maine to 0.9% in Virginia and Montana. D.C., however, recorded a substantially larger decline of 3.6%.

Construction Employment

Construction employment —which includes both residential and non-residential construction, posted a net gain in August. Thirty-one states added construction jobs compared to July, while 16 states and D.C. lost jobs; three states reported no change. Ohio recorded the largest monthly gain (+4,600), while Colorado recorded the largest loss (-2,200). Overall, the construction sector added a net 22,000 jobs nationwide in August. In percentage terms, Mississippi recorded the strongest monthly increase (+2.6%), while Rhode Island experienced the steepest decline (-1.3%).

Year-over-year, construction employment increased by 120,000 jobs nationwide, a 1.5% gain from August 2025. Ohio led all states with an increase of 17,800 construction jobs, while California recorded the largest loss (-6,900). In percentage terms, Louisiana posted the strongest annual growth in construction employment (+12.7%), while New Hampshire experienced the largest decline (-3.7%).

State Unemployment Rate

The state unemployment rate is a key indicator of labor market conditions, measuring the share of the labor force that is actively seeking work but unable to find employment. Higher unemployment rates generally signal weaker economic conditions, while lower rates indicate tighter labor markets that may contribute to upward wage pressures.

South Dakota recorded the nation’s lowest unemployment rate at 2.0%, while D.C. posted the highest rate at 5.7%. The elevated unemployment rate in D.C. reflects significant federal workforce reductions and layoffs that occurred during 2025. North Dakota, Vermont, Hawaii, New Hampshire, Nebraska, and Wyoming also reported unemployment rates of 3.0% or below. Meanwhile, Oregon, Connecticut, California, and Michigan recorded unemployment rates of 5.0% or higher.


This article was originally published by a eyeonhousing.org . Read the Original article here. .


Inflation in August remained sticky as renewed tensions with Iran continued pushing up oil prices, keeping pressure on the Fed to consider a rate hike at its upcoming meeting. Gasoline prices returned as the largest driver of headline inflation, accounting for one-third of the monthly increase. While consumer goods prices showed signs of stabilization from earlier tariff impacts, recent trade conflicts with Canada could add to inflation pressures in coming months.

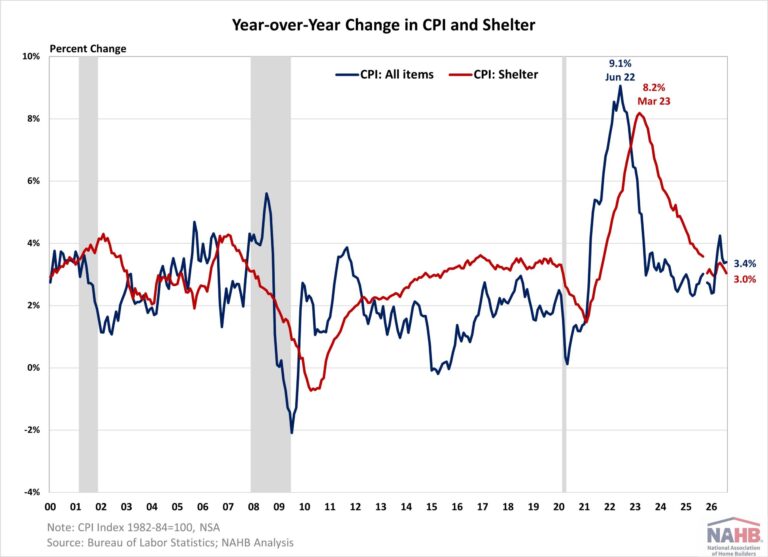
On a non-seasonally adjusted basis, the Consumer Price Index (CPI) rose by 3.4% in August from a year ago, following the same increase last month, according to the BLS latest report. The “core” CPI, excluding the volatile food and energy components, increased by 2.4% over the past twelve months, following a 2.5% increase in July. The housing shelter index, which makes up a large portion of the core CPI, rose 3.0% over the year, following a 3.2% increase last month. Meanwhile, the component index for food rose by 2.7% over the year, and the energy component index increased by 16.3%.

On a monthly basis, the CPI rose by 0.4% in August (seasonally adjusted), while the “core” CPI increased by 0.3%. The price index for a broad set of energy sources increased by 2.1% in August, as declines in natural gas (-1.1%) and electricity (-0.2%) were offset by increases in fuel oil (+10.1%) and gasoline (+3.9%). Meanwhile, the food at home index remained unchanged and the food away from home index rose by 0.3 in August.

Outside of energy, other top contributors that rose in August included indexes for communication (+2.3%), lodging away from home (+2.4%), airline fares (+2.7%), education (+0.8%) and used cars and trucks (+0.4%). Meanwhile, the indexes for medical care (-0.2%) and motor vehicle insurance (-0.8%) were among the major indexes that decreased over the month.

The index for shelter, which makes up more than 40% of the “core” CPI, rose by 0.3% in August, following a 0.1% increase last month. Both the index for owners’ equivalent rent (OER) and rent of primary residence (RPR) increased by 0.2% over the month.

NAHB constructs a “real” rent index to indicate whether inflation in rents is faster or slower than core inflation. It provides insight into the supply and demand conditions for rental housing. When inflation in rents is rising faster than core inflation, the real rent index rises and vice versa. The real rent index is calculated by dividing the price index for rent by the core CPI (to exclude the volatile food and energy components). In August, the Real Rent Index fell by 0.1%.


This article was originally published by a eyeonhousing.org . Read the Original article here. .


Residential building material prices, excluding energy, rose 0.2% in August and were up 5.1% from a year ago. Energy prices rose sharply in August, as prices for energy inputs to residential construction rose 6.6% over the month. Prices for services also rose, up 1.5% over the month and 7.8% higher over the year.

The Producer Price Index for final demand was up 0.4% in August, after rising 0.1% in July. Compared to a year ago, final demand prices were up 5.4%. The index for final demand services rose 0.1% in August, while the index for final demand goods rose 1.1%.

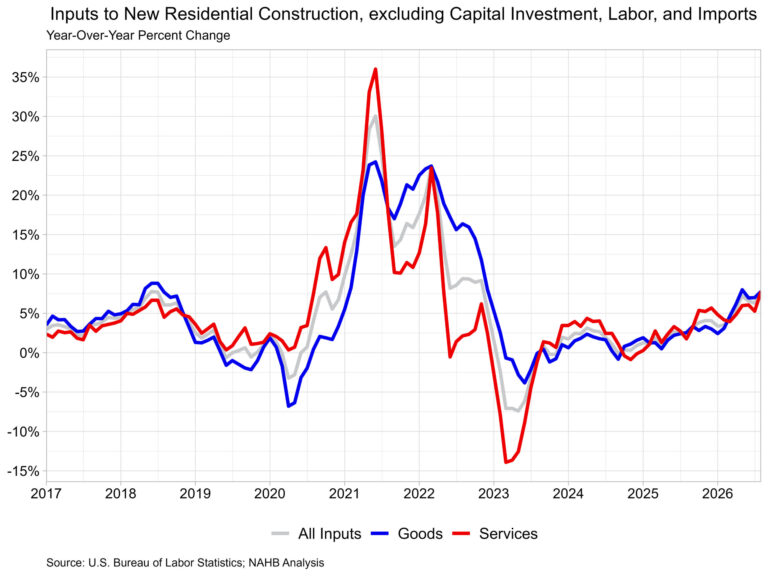
The price index for inputs to new residential construction was up 1.1% in August and was up 7.8% from last year. The price of goods used in new residential construction (including energy) was up 0.9% over the month and up 7.8% from last year, while the price of services was up 1.5% over the month and up 7.8% from last year.

Input Goods

The goods component has a larger importance to the inputs to residential construction price index, representing around 60% of the total. On a monthly basis, the price of input goods to new residential construction was up 0.9% in August after rising 0.4% in July.

The input goods to residential construction index can be further broken down into two separate components, one measuring energy inputs with the other measuring remaining goods. The latter of these two components simply represents building materials used in residential construction, which makes up around 93% of the goods index.

Energy input prices rose 6.6% in August and were 46.2% higher than a year ago. Building material prices were up 0.2% in August and up 5.1% compared to one year ago.

Price increases for energy products outpaced other materials. No. 2 diesel fuel prices were up 17.7% over the month and 77.7% higher than a year ago. Unleaded regular gasoline prices rose 3.3% over the month and were 47.0% higher than a year ago. Outside of energy products, nonferrous wire and cable prices rose 2.4% over the month and were up 19.6% from a year ago. Softwood veneer and plywood prices rose 1.7% and were up 12.5% from a year ago. Some prices for products did fall over the month, as softwood lumber prices fell 2.5% but were still 13.0% higher than a year ago.

Input Services

Prices for service inputs to residential construction rose 1.5% in August. On a year-over-year basis, service input prices were up 7.8%. The price index for service inputs to residential construction can be broken out into three separate components: a trade services component, a transportation and warehousing services component, and a services excluding trade, transportation, and warehousing component (other services).

The most significant component is trade services (around 60%), followed by other services (around 29%), and finally transportation and warehousing services (around 11%). The largest component, trade services, was up 9.0% from a year ago. The price of transportation and warehousing services has risen 14.4% over the year, while prices for other services were up 2.6% over the year.


This article was originally published by a eyeonhousing.org . Read the Original article here. .


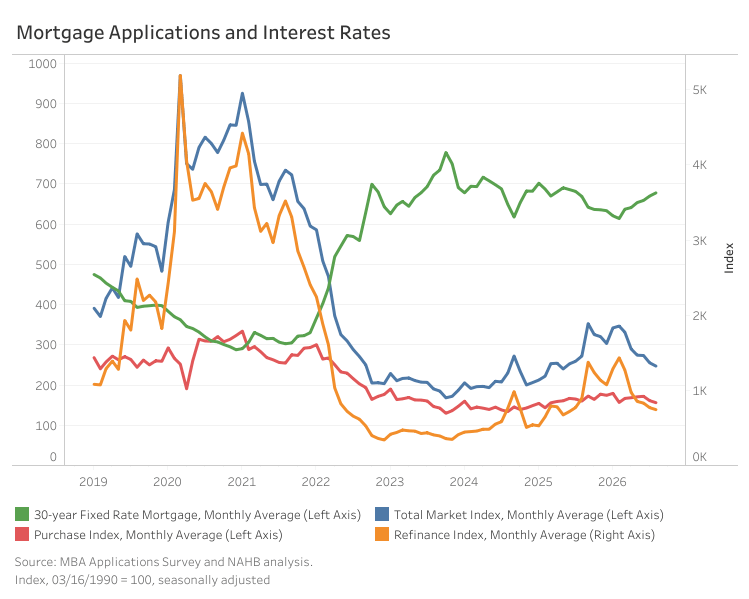
Mortgage application activity continued to decline in August as elevated US treasury yields pushed mortgage rates higher. The Mortgage Bankers Association’s (MBA) Market Composite Index, a measure of total mortgage application volume, declined 3.2% month-over-month in August on a seasonally adjusted basis, marking the sixth consecutive monthly decline. Compared to a year ago, total mortgage applications declined 9.1%.

The monthly decline occurred in both major components. Purchase applications decreased 3.1% from July, while refinance applications declined 3.5%. Relative to August 2025, purchase and refinance activities were also down 2.5% and 16.6%, respectively.

The decline in market activity continued to slow down as the average contract rate for a 30-year fixed-rate mortgage rose. Compared to last month, the mortgage rate increased 8 basis points (bps) to 6.78%. The rate was also 9 bps higher than a year ago.

By loan type, applications for adjustable-rate mortgages (ARMs) and fixed-rate mortgages (FRMs) decreased 0.6% and 3.4% month-over-month, respectively. Compared with a year earlier, ARM application volume fell 18.2%, while FRM applications declined 8.2%. Despite the monthly decline in ARM applications, their share of total applications edged higher because ARM activity fell less than FRM activity. ARMs, including both purchase and refinance loans, accounted for 7.9% of total applications on a non-seasonally adjusted basis in August, up 0.2 percentage points from July but 0.9 percentage points below the share recorded a year earlier. The average contract interest rate for 5/1 ARMs was 5.90% in August.

Average loan sizes also declined across all categories in August. The overall loan size decreased 2.3% to $375,300. The average purchase loan size fell 0.8% to $441,000, while the average refinance loan size declined 4.5% to $283,000. The average ARM loan size edged down 1.5% to $923,800.


This article was originally published by a eyeonhousing.org . Read the Original article here. .


The U.S. labor market rebounded in August, with nonfarm payrolls increasing by 162,000 and upward revisions adding 55,000 jobs to June and July. The unemployment rate held steady at 4.1%, as both employment and the labor force participation rate rose over the month. August’s gain leaves just five outright monthly declines in payrolls over the past year and a half, with the most recent occurring in February. While the strength reported for the labor market is positive, today’s data increases the probability of a Federal Reserve rate hike in the near future.

Wage growth continued to cool, with average hourly earnings rising 3.1% year over year in August, down from 3.2% in July and marking the slowest pace of 2026. Average hourly earnings reached $37.75. Meanwhile, a recent sharp increase in energy and gasoline prices, driven by conflicts in the Middle East, has pushed inflation higher even as wage growth has slowed.

National Employment

According to the Employment Situation Summary reported by the Bureau of Labor Statistics (BLS), total nonfarm payroll employment increased by 162,000 in August, following an upwardly revised gain of 21,000 in July. Revisions to prior months were broadly positive, reversing two straight months of downward revisions. The change for June was revised up by 11,000, from the +20,000 reported last month to +31,000, while the change for July was revised up by 44,000, from a preliminary decline of 23,000 to a gain of 21,000. Combined, these revisions added 55,000 jobs to previously reported totals, compared with the 103,000 downward revisions reported in the prior month.

Job growth in 2026 has picked back up. Through August, monthly payroll gains have averaged 80,000 on the current data vintage, up from the 61,000 pace reported through July, reflecting both August’s strong print and the upward revisions to June and July. This compares with an average of just 10,000 per month in 2025 and 122,000 per month in 2024. Over the past 12 months, total nonfarm employment has grown by 603,000, a modest acceleration from the pace of expansion reported over the summer.

The unemployment rate held at 4.1% in August, unchanged from July and 0.2 percentage points below its year-ago level of 4.3%. Over the month, the number of employed persons rose by 569,000, while the number of unemployed persons increased by 115,000. Combined, the civilian labor force expanded by 683,000 in August.

Meanwhile, the labor force participation rate—the proportion of the population either looking for a job or already holding a job—rose 0.2 percentage points to 61.6% in August. It remains well below its pre-pandemic level of 63.3% recorded at the start of 2020. Among prime working-age individuals (aged 25 to 54), the participation rate held at 83.4%, matching July’s level.

Employment gains in August were led by food services and drinking places, which added 59,000 jobs, followed by local government education, with an increase of 42,000. Health care employment continued to trend upward, adding 13,000 jobs, while manufacturing employment also expanded by 16,000. These gains were partially offset by a 23,000 decline in information.

Construction Employment

Employment in the overall construction sector rose by 22,000 jobs in August, following a gain of 18,000 in July. Within the industry, residential construction employment increased by 10,700, its strongest monthly gain in more than a year, while non-residential construction added approximately 10,400 jobs. The gain for residential construction in August is out of sync with other building data and may be subject to a downward revision in future reports.

Residential construction employment stood at 3.3 million in August, including 923,700 workers employed by builders and remodelers, up from 916,400 in July, and 2.3 million residential specialty trade contractors.

The six-month moving average of job gains for residential construction employment remained negative in August but improved to an average monthly loss of approximately 1,233 jobs, compared with a loss of roughly 5,617 jobs in July. Over the last 12 months, residential construction has shed a net of 19,800 jobs, marking the eighteenth consecutive month of year-over-year decline. Despite these losses, residential construction employment remains 1,290,300 positions above its post-Great Recession low. This cushion widened from 1,279,600 in July, reflecting August’s employment gain.

Meanwhile, the unemployment rate for construction workers fell to 4.1% in August on a seasonally adjusted basis, down from 4.6% in July and its lowest reading since April. After several months of volatility, the construction unemployment rate has returned to roughly its year-ago level, suggesting that labor market conditions in construction have stabilized.
This article was originally published by a eyeonhousing.org . Read the Original article here. .


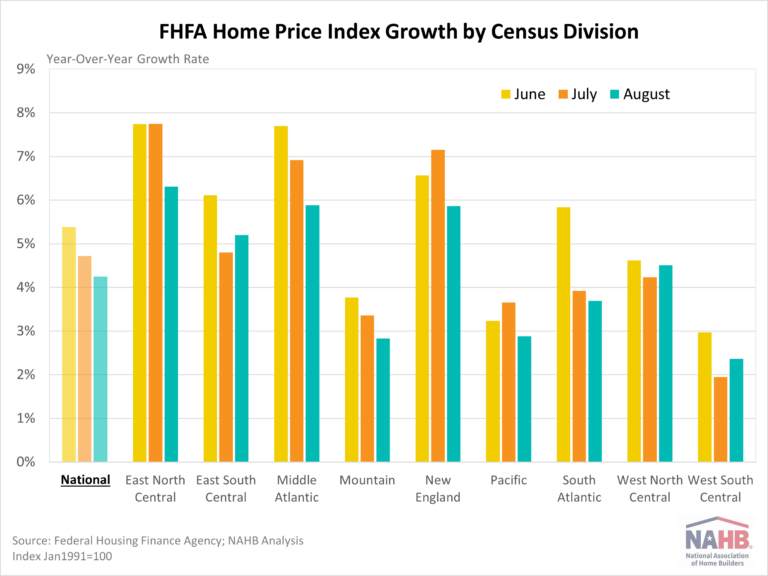
Home price growth continued to slow in August, growing at a rate just above 4% year-over-year. The S&P CoreLogic Case-Shiller Home Price Index (seasonally adjusted – SA) posted a 4.24% annual gain, down from a 4.82% increase in July. Similarly, the Federal Housing Finance Agency Home Price Index (SA) rose 4.25%, down from 4.72% in July. Both indexes experienced a sixth consecutive year-over-year deceleration in August. The year-over-year rate peaked in February 2024 when the S&P CoreLogic Case-Shiller stood at 6.57% and the FHFA at 7.28%.

By Metro Area

In addition to tracking national home price changes, the S&P CoreLogic Index (SA) also reports home price indexes across major metro areas. Compared to last year, all 20 metro areas reported a home price increase.  There were 12 metro areas that grew more than the national rate of 4.24%. The highest annual rate was New York at 8.07%, followed by Las Vegas and Chicago both with rates of 7.22%. The smallest home price growth over the year was seen by Denver at 0.68%, followed by Portland at 0.82%, and Dallas at 1.57%.

By Census Division

Monthly, the FHFA Home Price Index (SA) publishes not only national data but also data by census division. All divisions saw an annual increase of over 2% in August. The highest rate for August was 6.31% in the East South Central division, while the lowest was 2.36% in the West South Central division. As shown in graph below, all divisions saw a slow in rates compared to June. The FHFA Home Price Index releases their metro and state data on a quarterly basis, which NAHB analyzed in a previous post.

Discover more from Eye On Housing

Subscribe to get the latest posts sent to your email.


This article was originally published by a eyeonhousing.org . Read the Original article here. .


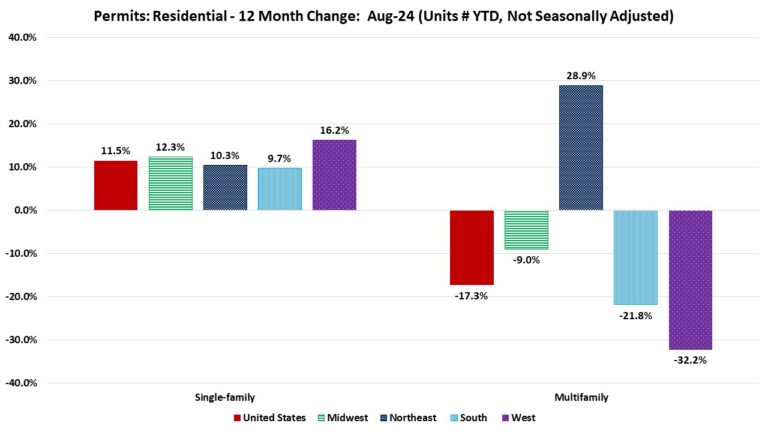
Over the first eight months of 2024, the total number of single-family permits issued year-to-date (YTD) nationwide reached 685,923. On a year-over-year (YoY) basis, this is an increase of 11.5% over the August 2023 level of 615,453.

Year-to-date ending in August, single-family permits were up in all four regions. The range of permit increases spanned 16.2% in the West to 9.7% in the South. The Midwest was up by 12.3% and the Northeast was up by 10.3% in single-family permits during this time. For multifamily permits, three out of the four regions posted declines. The Northeast, driven by New York, was the only region to post an increase and was up by 28.9%. Meanwhile, the West posted a decline of 32.2%, the South declined by 21.8%, and the Midwest declined by 9.0%.

Between August 2024 YTD and August 2023 YTD, 47 states posted an increase in single-family permits. The range of increases spanned 44.5% in New Mexico to 1.5% in Maryland. New Hampshire (-1.2%), the District of Columbia (-3.2%), Hawaii (-7.9%), and Alaska (-21.4%) reported declines in single-family permits. The ten states issuing the highest number of single-family permits combined accounted for 63.5% of the total single-family permits issued. Texas, the state with the highest number of single-family permits, issued 110,907 permits over the first eight months of 2024, which is an increase of 12.4% compared to the same period last year. The succeeding highest state, Florida, was up by 5.0%, while the third highest, North Carolina, posted an increase of 10.6%.

Year-to-date ending in August, the total number of multifamily permits issued nationwide reached 326,080. This is 17.3% below the August 2023 level of 394,257.

Between August 2024 YTD and August 2023 YTD, 18 states recorded growth in multifamily permits, while 32 states and the District of Columbia recorded a decline. Wyoming (+104.8%) led the way with a sharp rise in multifamily permits from 125 to 256, while the District of Columbia had the biggest decline of 68.1% from 2,072 to 661. The ten states issuing the highest number of multifamily permits combined accounted for 64.1% of the multifamily permits issued. Over the first eight months of 2024, Texas, the state with the highest number of multifamily permits issued, experienced a decline of 27.8%. Following closely, the second-highest state in multifamily permits, Florida, saw a decline of 25.1%. California, the third largest multifamily issuing state, decreased by 31.5%.

At the local level, below are the top ten metro areas that issued the highest number of single-family permits.

For multifamily permits, below are the top ten local areas that issued the highest number of permits.

Discover more from Eye On Housing

Subscribe to get the latest posts sent to your email.


This article was originally published by a eyeonhousing.org . Read the Original article here. .


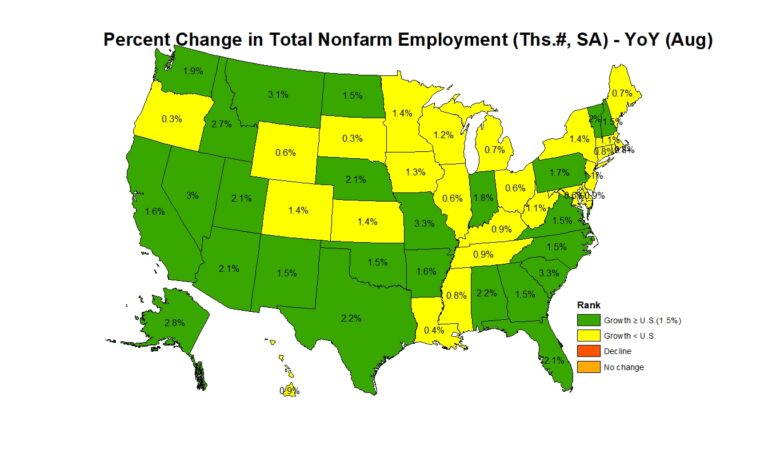
Nonfarm payroll employment increased in 32 states in August compared to the previous month, while 17 states and the District of Columbia saw a decrease. Kansas reported no change. According to the Bureau of Labor Statistics, nationwide total nonfarm payroll employment increased by 142,000 in August, following a gain of 89,000 jobs in July.

On a month-over-month basis, employment data was most favorable in Texas, which added 78,000 jobs. Texas accounted for more than half the jobs created nationwide in August. Indiana came in second (+19,800), followed by Minnesota (+14,400). A total of 42,400 jobs were lost across the 17 states and the District of Columbia, with New York reporting the steepest job losses at 7,400. In percentage terms, employment increased the highest in Texas and Indiana at 0.6%, while South Dakota saw the biggest decline at 0.7% between July and August.

Year-over-year ending in August, 2.4 million jobs have been added to the labor market across all 50 states and the District of Columbia. The range of job gains spanned from 1,500 jobs in South Dakota to 302,400 jobs in Texas. In percentage terms, the range of job growth spanned 3.3% in Missouri to 0.3% in South Dakota.

Across the nation, construction sector jobs data1 —which includes both residential and non-residential construction—showed that 27 states and the District of Columbia reported an increase in August compared to July, while 20 states lost construction sector jobs. The three remaining states reported no change on a month-over-month basis. Texas, with the highest increase, added 8,300 construction jobs, while California, on the other end of the spectrum, lost 3,300 jobs. Overall, the construction industry added a net 34,000 jobs in August compared to the previous month. In percentage terms, Wyoming reported the highest increase at 2.3% and Tennessee reported the largest decline at 1.6%.

Year-over-year, construction sector jobs in the U.S. increased by 228,000, which is a 2.8% increase compared to the August 2023 level. Texas added 36,600 jobs, which was the largest gain of any state, while Maryland lost 4,800 construction sector jobs. In percentage terms, Alaska had the highest annual growth rate in the construction sector at 17.8%. Over this period, Maine reported the largest decline of 4.7%.

Discover more from Eye On Housing

Subscribe to get the latest posts sent to your email.


This article was originally published by a eyeonhousing.org . Read the Original article here. .


Expectations of the Federal Reserve beginning the first in a series of rate reductions kept potential home buyers in a holding pattern in August.

Sales of newly built, single-family homes in August fell 4.7% after an unusually strong July, according to newly released data from the U.S. Department of Housing and Urban Development and the U.S. Census Bureau.  August new home sales registered a 716,000 seasonally adjusted annual rate, after an upwardly revised estimate of 751,000 for July.

Despite the slip in August, the three-month moving average for new home sales is at its highest level since March of 2022. New home sales are up 4% on a year-to-date basis through August.

Builder sentiment and future sales expectations are improving as the Federal Reserve begins a credit easing cycle. However, due to the mortgage interest lock-in effect, declining interest rates will mean rising existing home inventories and some additional new competition for home builders.

While a 7.8 months’ supply may be considered elevated in normal market conditions, there is currently only a 4.1 months’ supply of existing single-family homes on the market. Combined, new and existing total months’ supply remains below historic norms at approximately 4.7, although this measure is expected to increase as more home sellers test the market in the months ahead.

A new home sale occurs when a sales contract is signed, or a deposit is accepted. The home can be in any stage of construction: not yet started, under construction or completed. In addition to adjusting for seasonal effects, the August reading of 716,000 units is the number of homes that would sell if this pace continued for the next 12 months.

New single-family home inventory increased 1.7% to 467,000 in August, a 7.8 months’ supply at the current sales pace.  Completed, ready to occupy inventory increased to 105,000 homes, which is the highest level since 2009. However, this share makes up only 22% of new home inventory.

Median new home price fell back to $420,600, down 4.6% from a year ago due to builder price incentives amid multidecade highs for housing affordability challenges. The Census data reveals a gain for new home sales priced below $300,000, which made up 18% of new home sales in August compared to 12% a year ago.

Regionally, on a year-to-date basis, new home sales are up in all four regions, rising 2.1% in the Northeast, 21.9% in the Midwest, 0.8% in the South and 4.7% in the West.

Discover more from Eye On Housing

Subscribe to get the latest posts sent to your email.


This article was originally published by a eyeonhousing.org . Read the Original article here. .

Pin It