Tag

August

Browsing


Prices for inputs to new residential construction, excluding capital investment, labor and imports decreased 0.1% in August according to the most recent Producer Price Index (PPI) report published by the U.S. Bureau of Labor Statistics. Compared to a year ago, this index was up 0.8% in August after a 1.8% increase in July. The inputs to new residential construction price index can be broken into two components­—one for goods and another for services. The goods component increased 0.2% over the year, while services increased 1.9%. For comparison, the total final demand index increased 1.7% over the year in August, with final demand goods flat and final demand services up 2.6% over the year.

Input Goods

The goods component has a larger importance to the total residential inputs price index, around at 60%. The price of inputs to residential construction, goods, remained flat in August after increasing 0.1% in July. The input goods to residential construction index can be further broken down into two separate components, one measuring energy inputs with the other measuring goods less foods and energy inputs. The latter of these two components simply represents building materials used in residential construction, which makes up around 93% of the goods index. Prices for inputs to residential construction, goods less food and energy, were up 1.6% in August compared to a year ago. This year-over-year growth has come down since April, when it was at 2.5% and remains well below the growth in August of 2022, when it was at 14.7%.

The graph below focuses on the data since the start of 2023 for residential goods inputs. Energy prices have retreated over the past year, with only two periods of growth in 2024.

Input Services

Prices of inputs to residential construction, services, fell 0.2% in August after remaining flat in July. The price index for service inputs to residential construction can be broken out into three separate components, a trade services component, a transportation and warehousing services component, and a services less trade, transportation and warehousing component. The most vital component is trade services (around 60%), followed by services less trade, transportation and warehousing (around 29%), and finally transportation and warehousing services (around 11%).

Discover more from Eye On Housing

Subscribe to get the latest posts sent to your email.


This article was originally published by a eyeonhousing.org . Read the Original article here. .
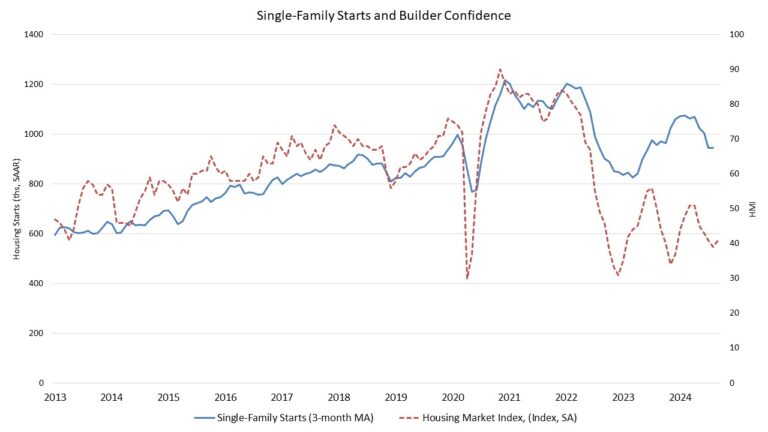

Single-family starts posted a solid gain in August on robust demand and moderating mortgage rates even as builders continue to grapple with challenges related to lot and labor shortages and elevated prices for many building materials.

Overall housing starts increased 9.6% in August to a seasonally adjusted annual rate of 1.36 million units, according to a report from the U.S. Department of Housing and Urban Development and the U.S. Census Bureau.

The August reading of 1.36 million starts is the number of housing units builders would begin if development kept this pace for the next 12 months. Within this overall number, single-family starts increased 15.8% to a 992,000 seasonally adjusted annual rate. On a year-over-year basis, single-family starts are up 5.2% compared to August 2023. On a year-to-date basis, single-family starts are up 10.4%. The three-month moving average (a useful gauge given recent volatility) is down to 944,000 units, as charted below.

The multifamily sector, which includes apartment buildings and condos, decreased 4.2% to an annualized 364,000 pace. The three-month moving average for multifamily construction has trended upward to a 363,000-unit annual rate. On a year-over-year basis, multifamily construction is up 0.6%.

On a regional and year-to-date basis, combined single-family and multifamily starts are 1.9% lower in the Midwest, 2.1% lower in the Northeast, 4.4% lower in the West and 4.6% lower in the South.

The total number of single-family homes and apartments under construction was 1.5 million in August. This is the lowest total since November 2021. Total housing units now under construction are 11.1% lower than a year ago. Single-family units under construction fell to a count of 642,000—down 5.2% compared to a year ago. The number of multifamily units under construction has fallen to 867,000 units. This is down 15.0% compared to a year ago.

On a 3-month moving average basis, there are currently 1.8 apartments completing construction for every one that is beginning construction. While apartment construction starts are down, the number of completed units entering the market is rising due to prior elevated construction levels. Year-to-date, the pace of completions for apartments in buildings with five or more units is up 36.7% in 2024 compared to 2023. A higher pace of completions in 2024 for multifamily construction will place some downward pressure on rent growth.

Overall permits increased 4.9% to a 1.48-million-unit annualized rate in August. Single-family permits increased 2.8% to a 967,000 unit rate. Multifamily permits increased 9.2% to an annualized 508,000 pace.

Looking at regional data on a year-to-date basis, permits are 2.1% higher in the Midwest, 0.7% higher in the Northeast, 1.1% lower in the South and 6.2% lower in the West.

Discover more from Eye On Housing

Subscribe to get the latest posts sent to your email.


This article was originally published by a eyeonhousing.org . Read the Original article here. .
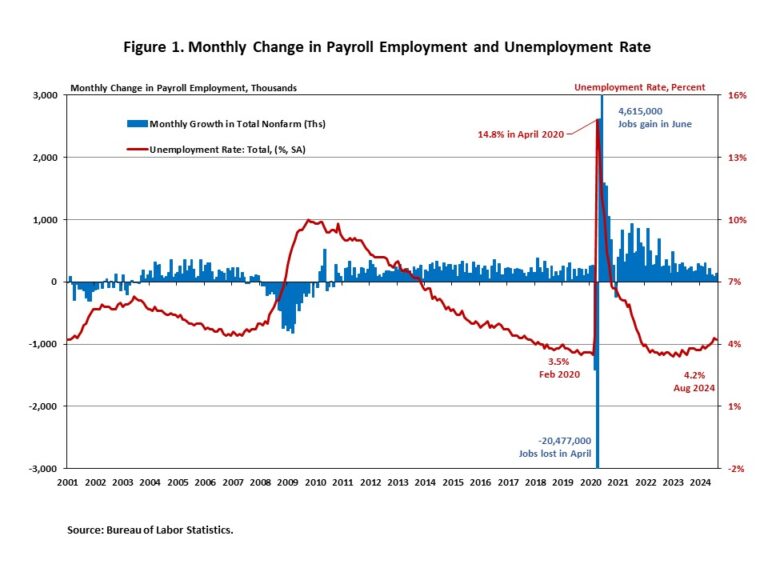

Today’s jobs report and the newly released preliminary estimate of the benchmark revision indicate that the U.S. labor market is slowing from its overheated state in 2021 and 2022 but remains stable. Among all sectors, construction led the August job gains, adding 34,000 jobs to payrolls.

Additionally, wage growth accelerated in August. Wages grew at a 3.8% year-over-year (YOY) growth rate, down 0.7 percentage points from a year ago. Wage growth is outpacing inflation, which typically occurs as productivity increases.

National Employment

Total nonfarm payroll employment increased by 142,000 in August, following a downwardly revised increase of 89,000 jobs in July, as reported in the Employment Situation Summary. The estimates for the previous two months were revised lower. The monthly change in total nonfarm payroll employment for June was revised down by 61,000, from +179,000 to +118,000, while the change for July was revised down by 25,000 from +114,000 to +89,000. Combined, the revisions were 86,000 lower than the original estimates.

Despite restrictive monetary policy, about 7.9 million jobs have been created since March 2022, when the Fed enacted the first interest rate hike of this cycle. In the first eight months of 2024, 1,475,000 jobs were created. Additionally, monthly employment growth averaged 184,000 per month, compared with the 251,000 monthly average gain for 2023.

In August, the unemployment rate eased slightly to 4.2%, from 4.3% in July. The August decrease in the unemployment rate reflected the decrease in the number of persons unemployed (-48,000) and the increase in the number of persons employed (+168,000).

Meanwhile, the labor force participation rate—the proportion of the population either looking for a job or already holding a job—remained at 62.7%. However, for people aged between 25 and 54, the participation rate dipped slightly to 83.9%. This rate exceeds the pre-pandemic level of 83.1%. Meanwhile, the overall labor force participation rate is still below its pre-pandemic levels when it stood at 63.3% at the beginning of 2020.

For industry sectors, construction (+34,000), health care (+31,000), and social assistance (+13,000) had job gains in August, while manufacturing lost 24,000 jobs. Employment in other major industries showed little change over the month.

Construction Employment

Employment in the overall construction sector in August (+34,000) experienced an increase, from the 13,000 job gains in July. While residential construction gained 5,600 jobs, non-residential construction employment added 28,300 jobs for the month.

Residential construction employment now stands at 3.4 million in August, broken down as 951,000 builders and 2.4 million residential specialty trade contractors. The 6-month moving average of job gains for residential construction was 5,667 a month. Over the last 12 months, home builders and remodelers added 63,100 jobs on a net basis. Since the low point following the Great Recession, residential construction has gained 1,385,000 positions.

In August, the unemployment rate for construction workers declined to 3.9% on a seasonally adjusted basis. The unemployment rate for construction workers has remained at a relatively lower level, after reaching 15.3% in April 2020, due to the housing demand impact of the COVID-19 pandemic.

Discover more from Eye On Housing

Subscribe to get the latest posts sent to your email.


This article was originally published by a eyeonhousing.org . Read the Original article here. .
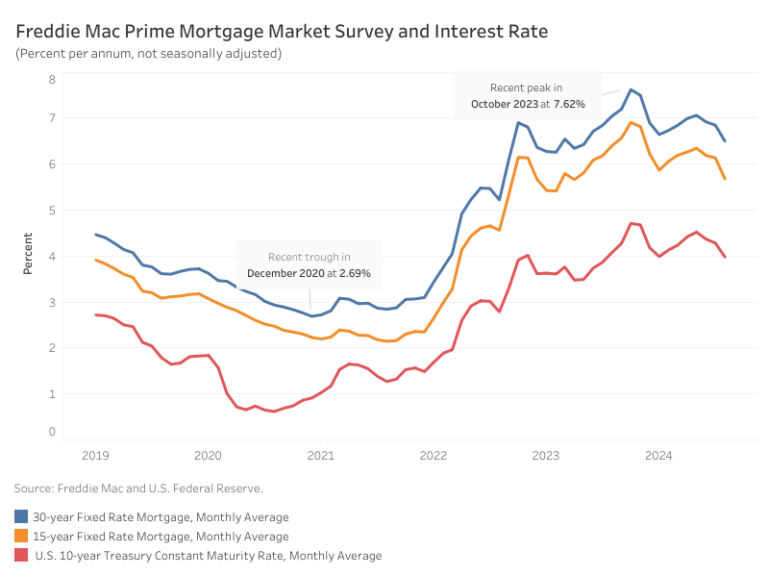

Mortgage rates continued to decrease in August, landing at an average rate of 6.50%. According to Freddie Mac, the average monthly rate fell by 35 basis points (bps) from July’s rate of 6.85%. The August rate is down 57 bps from one year ago, which stood at 7.07%.

The 15-year fixed-rate mortgage also saw a decrease, dropping by 45 bps from July to 5.68%, and is now lower compared to last August by 75 bps. Additionally, the 10-year Treasury rate declined 30 bps from 4.28% in July to 3.98%.

Per the NAHB forecast, we expect 30-year mortgage rates to decline slightly to around 6.66% at the end of 2024 and eventually to decline to just under 6% by the end of 2025. The NAHB outlook anticipates the federal funds rate to be cut by 25 bps no later than the December Federal Reserve meeting, although it is possible for the Fed to cut rates in the upcoming FOMC meeting in September.

Discover more from Eye On Housing

Subscribe to get the latest posts sent to your email.


This article was originally published by a eyeonhousing.org . Read the Original article here. .
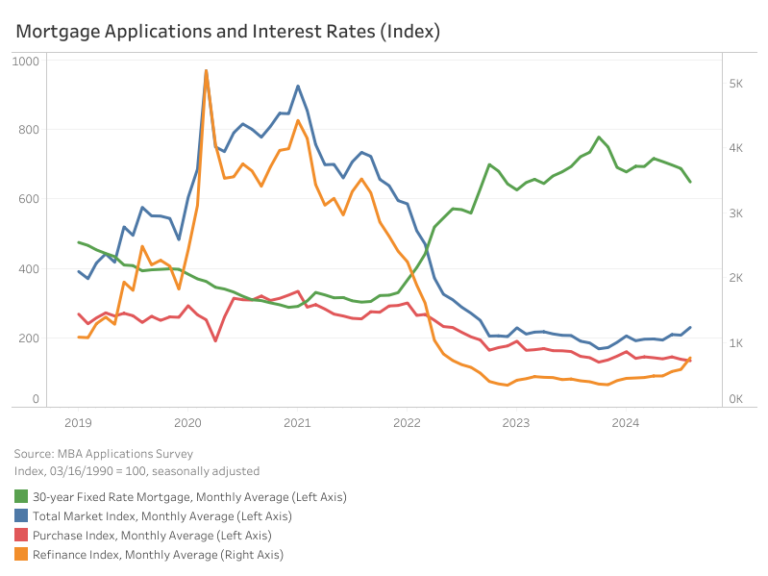

The Market Composite Index, a measure of mortgage loan application volume by the Mortgage Bankers Association’s (MBA) weekly survey, saw a month-over-month increase of 10.7% on a seasonally adjusted (SA) basis. Compared to last August, the index increased by 20.8%. While the Purchase Index declined by 2.9%, month-over-month, the Refinance Index jumped 30.8% as borrowers took advantage of the declining mortgage rates to refinance higher-rate loans. On a yearly basis, the Purchase Index is down by 8.6%, while the Refinance Index increased by 87.2%.

The average monthly 30-year fixed mortgage rate has fallen for four straight months with August seeing the largest decrease of 40 basis points (bps), bringing the rate to 6.49%. The current rate is 73 bps lower than last August.

The average loan size for the total market (including purchases and refinances) is up 3.6% from July to $380,800 on a non-seasonally adjusted (NSA) basis. Similarly, the month-over-month change for purchase loans increased 0.6% to an average size of $426,600, while refinance loans rose by 18.5% to an average of $325,800. The average loan size for an adjustable-rate mortgage (ARM) also saw a steep increase of 9.5% for the same period, from $1.01 million to $1.1 million.

Discover more from Eye On Housing

Subscribe to get the latest posts sent to your email.


This article was originally published by a eyeonhousing.org . Read the Original article here. .


KSHB 41 reporter Grant Stephens covers issues connected to access to housing and rent costs. Share your story idea with Grant.

—

There are big changes coming to the way you buy or sell a home.

These changes stem from a series of lawsuits intended to make the home buying process more transparent.

The changes take effect August 17th.

An agent working with a buyer will have to work out an agreement before the prospective buyer and real estate agent look at a property together.

KSHB 41 News staff

Home in Kansas City area

“When a real estate agent says, ‘Hey, starting August 17th, you have to sign this agreement,’ they’re telling you the truth,” said Holden Lewis with NerdWallet.

You may be familiar with the standard five to six percent commission rate you’d have to pay in the past.

It’s split between buyer’s and seller’s agents and is often baked into the total cost of the home.

The changes mean there’s now an extra layer of negotiation that could change that standardized fee.

“It’s gonna specify how much you’re gonna pay that agent,” Lewis said.

Realtors like Kathleen Spiking with the Rob Ellerman Team say it might change how contracts are written and how they’re paid.

KSHB 41 News staff

Kathleen Spiking

“They’re training us on what’s going on, what’s does this look like, how does it appear in a contract,” Spiking said.

But since she’s always been upfront with costs, it won’t change the day-to-day.

“Personally, for me, it doesn’t affect the way that I run my business,” she said. “I still have communication up front with all of my clients, whether they’re buyers or sellers, and I think maybe for people it would be further and more thorough communication at the beginning and during the process of buying a home,” she said.

—


This article was originally published by a www.kshb.com . Read the Original article here. .


If you sell your home after the middle of August, cheers: You could end up pocketing the money that previously would have gone to the buyer’s agent.

But before you celebrate, consider the downside of waiting until late summer to list your home for sale: House prices tend to fall after August. The price drop might surpass the money you save on commission.

New policies governing real estate commissions are set to go into effect Aug. 17 as a result of the settlement of an antitrust lawsuit. The amended policies give home sellers more room to negotiate what to do about the buyer’s commission — whether they want to use it to induce competitive bids or keep it to themselves entirely.

The choices complicate this season more than usual, for both buyers and sellers. Here’s what to know to help you and your agent come up with the best strategy for you.

What, exactly, is changing?

Starting Aug. 17, sellers will no longer set the commissions for real estate agents who represent buyers. Buyers will decide how much their agents will be paid. Even when sellers are willing to pay some or all of the commission for the buyer’s agent, the amount will no longer appear on the multiple listing service.

For decades, and up to Aug. 17, MLS listings have been required to advertise how much commission the seller is offering to buyer’s agents. The information wasn’t visible to home buyers but could be viewed in agent-only fields of the MLS.

When sellers set commissions for buyer’s agents, they’re sometimes advised that offering a low commission will attract fewer buyer’s agents — and therefore fewer competing offers. The plaintiffs in the antitrust suit argued that the policy of requiring commission info on the MLS was designed to discourage them from negotiating lower commissions for buyer’s agents.

Can sellers start offering 0% to buyer’s agents today?

Technically, sellers have always had the option of offering zero or minimal commission to the buyer’s agent. But most sellers have offered such commissions to motivate buyer’s agents.

The money may come directly out of the seller’s pocket, as has been the norm.

The money may come directly out of the buyer’s pocket.

The buyer and seller may split the payment.

The buyer may pay indirectly, by adding their agent’s commission to the price of the house when they make an offer.

Here’s an example of how an indirect payment might work for a buyer who is paying a 3% commission. The buyer finds a house costing $400,000. The 3% commission is $12,000. The buyer offers $412,000 and asks the seller to transfer $12,000 to the buyer’s agent at closing.

Keep in mind that sellers, having equity, tend to have more access to cash than first-time home buyers, who accounted for 33% of buyers in April. A seller who’s willing to pay all or some of the buyer’s commission may end up with more offers, and a higher final price, than one who flatly takes that commission off the table.

How much money could sellers keep, though?

As a home seller, you stand to save thousands of dollars on commissions if the buyer pays their agent directly or indirectly.

Let’s say the agents in your town typically collect 2.5% on each side of the transaction, and you sell your house for $400,000. Each agent earns $10,000. If you pay both agents, you’ll shell out $20,000 and end up with $380,000.

But if the buyer pays their agent, you would pay your agent $10,000 and walk away with $390,000. That’s $10,000 more.

On the other hand, buyers might request bigger closing cost credits, subtracting from the seller’s bottom line, Chuck Vander Stelt, a real estate agent in Valparaiso, Indiana, said in an email. Or buyers might offer less because they will bear the expense of paying their own agents.

Even after Aug. 17, sellers might keep offering commissions to buyer’s agents as motivation, Vander Stelt added. These offers could remain standard in many markets, multiple agents said. Offering commissions to buyer’s agents will still be permissible under the new policies, but those offers will no longer appear on the MLS. Listing agents can communicate the information on brokerage websites, or in phone calls, emails and texts.

What would be the cost of waiting?

You might be tempted to keep your home off the market until the new policy goes into effect. But waiting might not be a wise move, because it would mean sitting out homebuying season.

Home prices peak from May through August, then drop off. In 2023, the median existing home cost $410,100 in June, $405,600 in July, $404,200 in August — and $392,700 in September, according to the National Association of Realtors. If you list your house after mid-August, you probably won’t close until October or later, when prices are even lower.

With house prices peaking in summer, you might come out ahead by selling during the busiest time of the year, even if you end up paying the buyer’s agent’s commission.

“I don’t really have anybody holding off until after August to list their house because they want to save a couple bucks,” says Michelle Doherty, an agent in northern Virginia with RLAH Real Estate. She says her clients will be ready to sell in June or July, “depending on how things progress with prepping the house.”

Can I negotiate the listing agent’s commission too?

You might save money if you don’t pay the buyer’s agent’s commission. But what about the commission that you pay the listing agent for selling your home? You might not see an immediate reduction. If a cut in commissions from 3% to 2% is your hope, you’ll probably mope.

“First of all, nothing’s going to change quickly, OK?” says Stephen Brobeck, senior fellow for the Consumer Federation of America. “The industry will resist, and consumers don’t really focus on this much.”

Vander Stelt said that he sees headlines that proclaim “the end of the 6% commission.” That’s a mistaken belief, he said. “Overall, the average commission costs per transaction on a percentage is likely to come down over the coming years,” he said. But not instantly.

What if I list before Aug. 17 but sell after?

Months can pass between the day you put your home on the market and the day you hand over the house keys at closing. What if the Aug. 17 policy change happens in the middle of this period? The National Association of Realtors provides guidance for two scenarios:

Your home’s MLS listing offers to pay the buyer’s agent’s commission, and you sign the contract accepting the purchase offer before Aug. 17: You’ll pay the commission, even if the closing occurs on Aug. 17 or after.

Your home’s MLS listing offers to pay the buyer’s agent’s commission. But in accordance with the new policy, that offer is removed from the MLS on Aug. 17. Sometime after that date, you accept the purchase offer: That defunct commission offer on the MLS is no longer valid. You and the buyer will negotiate how to take care of the buyer’s agent’s commission.

When you put up your home for sale, you’ll sign a listing agreement with your agent. NAR says that listing agreement might have to be amended if it says that an offer to pay the buyer’s agent must be made “on the MLS.” As of Aug. 17, that clause in the listing agreement will conflict with the new policy. Your agent might ask you to sign an amended listing agreement before that date.


This article was originally published by a www.nerdwallet.com . Read the Original article here. .

Pin It