Tag

Trillion

Browsing


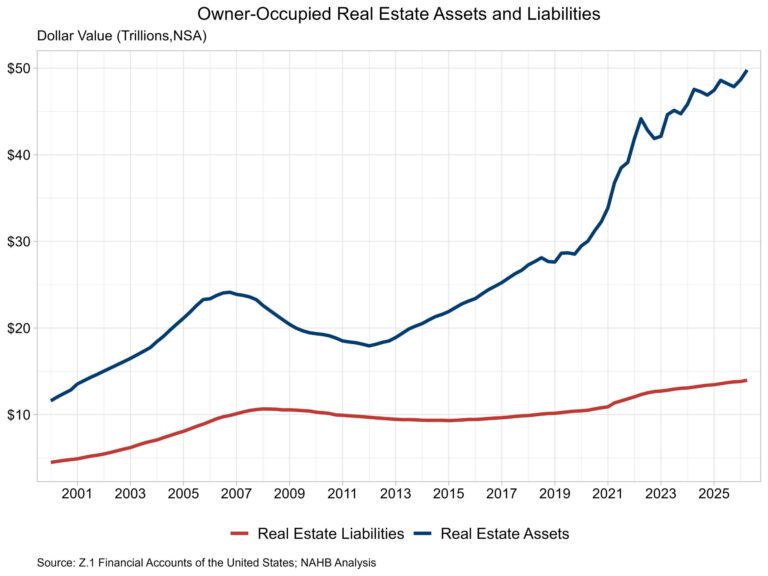
The market value of households’ real estate assets rose in the second quarter, reaching $49.8 trillion, according to the most recent release of U.S. Federal Reserve Z.1 Financial Accounts. This level is 2.3% higher than in the first quarter and is 2.5% higher than a year ago.  

This measure of market value estimates the value of all owner-occupied real estate nationwide. The calculation combines repeat-home sales data with estimates of additions to the housing stock, essentially measuring both price changes and the change in quantity of housing assets. This approach explains why household real estate wealth can continue to rise even as other measures may show a slowing in home price growth.

Real estate secured liabilities of households’ balance sheets, i.e. mortgages, home equity loans, and HELOCs, increased 1.1.% in the second quarter to $14.0 trillion. This level is 3.0% higher compared to the second quarter of 2025.

Owners’ equity share of real estate assets was 71.9% in the second quarter. This was the 13th consecutive quarter with this share being over 70%. Owners’ equity in real estate totaled $35.8 trillion in the second quarter.

Distributional Financial Accounts

The quarterly release of the financial accounts by the Federal Reserve includes extensive balance sheet data. As a supplement to the main release, additional data regarding households is released in the distributional financial accounts a few weeks after the main release. This data contains the level and share of aggregate household wealth by income, age, generation, education, and race. The section below focuses on real estate assets value by wealth percentile for households and is current through the first quarter of 2026.

In the first quarter, households in the 50-90% wealth percentile held the largest level of real estate assets, totaling $22.7 trillion. Households in this wealth percentile have a net worth between $241,362 and $2,148,339. The wealth percentile with the second-largest level of real estate assets was 90-99%, at $14.8 trillion. These households have a net worth between $2,148,339 and $11,146,846. Households in the bottom 50% in terms of net worth held the third most, at $4.8 trillion, while the top 99-99.9% held $4.5 trillion and the top 0.1% held $1.9 trillion. Households in the top 0.1% wealth percentile have a minimum net worth of $46,369,052.

Very few households fall into the three top wealth percentiles. Shifting the real estate asset value to a per household basis results in the top 0.1% owning far more than any other wealth percentile with a per household asset value of $14.2 million. Households in the 99-99.9% percentile had a per household asset value of $3.8 million. Households in the 90-99% wealth percentile held $1.2 million while households 50-90% wealth percentile held $418,893. Households in the bottom 50% of wealth percentile held $71,429 per household.


This article was originally published by a eyeonhousing.org . Read the Original article here. .

Total outstanding U.S. consumer debt stood at $5.10 trillion for the third quarter of 2024, increasing at an annualized rate of 3.28% (seasonally adjusted), according to the Federal Reserve’s G.19 Consumer Credit Report. In general, consumer debt has been slowing over the past two years, peaking at a high rate of 9.16% in the second quarter of 2022. However, the third quarter of 2024 experienced an uptick in growth from the previous quarter’s rate of 1.14%. 

The G.19 report excludes mortgage loans, so the data primarily reflects consumer debt in the form of student loans, auto loans, and credit card debt. As consumer spending has outpaced personal income, savings rates have been declining and consumer debt has increased. Previously, consumer debt growth had been slowing, as high inflation and rising interest rates led people to reduce their borrowing. However, the growth rate ticked up in the latest quarter, possibly reflecting expectations of rate cuts that took place at the quarter’s end. 

Nonrevolving Debt

Nonrevolving debt, largely driven by student and auto loans, reached $3.75 trillion (SA) in the third quarter of 2024, marking a 3.46% increase at a seasonally adjusted annual rate (SAAR). This growth rate is notably higher than in the previous six quarters, all of which remained below 2.5%. 

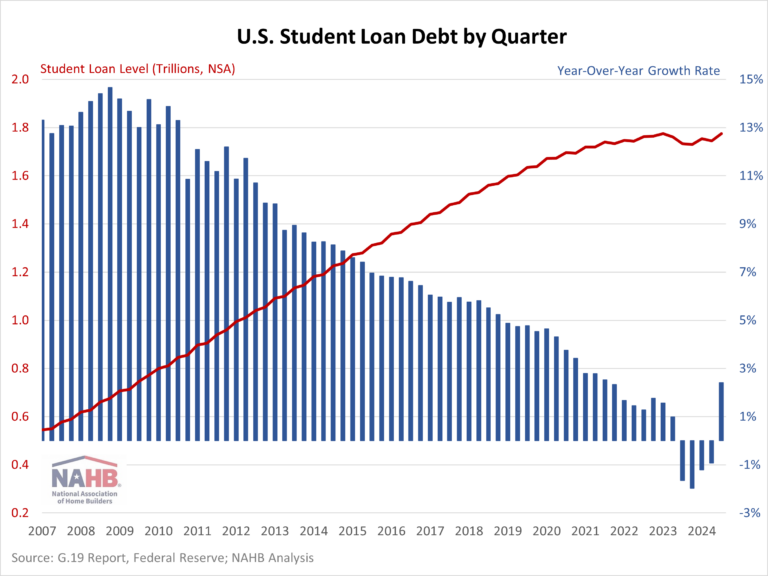
Student loan debt balances stood at $1.77 trillion (NSA) for the third quarter of 2024. Year-over-year, student loan debt rose 2.41%, the largest yearly increase since the third quarter of 2021. This shift partially reflects the expiration of the COVID-19 Emergency Relief for student loans’ 0-interest payment pause that ended September 1, 2023. 

Auto loans, meanwhile, totaled $1.57 trillion, with a year-over-year increase of only 0.96%—the slowest rate since 2010. This deceleration can be attributed to multiple factors, including tighter lending standards, higher loan rates, and overall inflation. Auto loan interest rates reached 8.40% (for a 60-month new car) in the third quarter of 2024, marking the highest rate since the data series began. Although the Federal Reserve has begun cutting rates, auto loan rates tend to respond more slowly and are less directly influenced by these cuts.  

Revolving Debt

Revolving debt, primarily credit card debt, reached $1.36 trillion (SA) in the third quarter, rising at an annualized rate of 2.79%. This marked a slight increase from the second quarter’s 2.58% rate but was notably down from the peak growth rate of 17.58% seen in the first quarter of 2022. The surge in credit card balances in early 2022 was accompanied by an increase in credit card rates which climbed by 4.51 percentage points over 2022. This was an exceptionally steep increase, as no other year in the past two decades had seen a rate jump of more than two percentage points.  

Comparatively, so far in 2024 the credit card rate increased 0.17 percentage points. For the third quarter of 2024, the average credit card rate held by commercial banks (NSA) reached a historic high (since data has been recorded) of 21.76%, an increase from 21.51% last quarter.   

Discover more from Eye On Housing

Subscribe to get the latest posts sent to your email.


This article was originally published by a eyeonhousing.org . Read the Original article here. .

Pin It