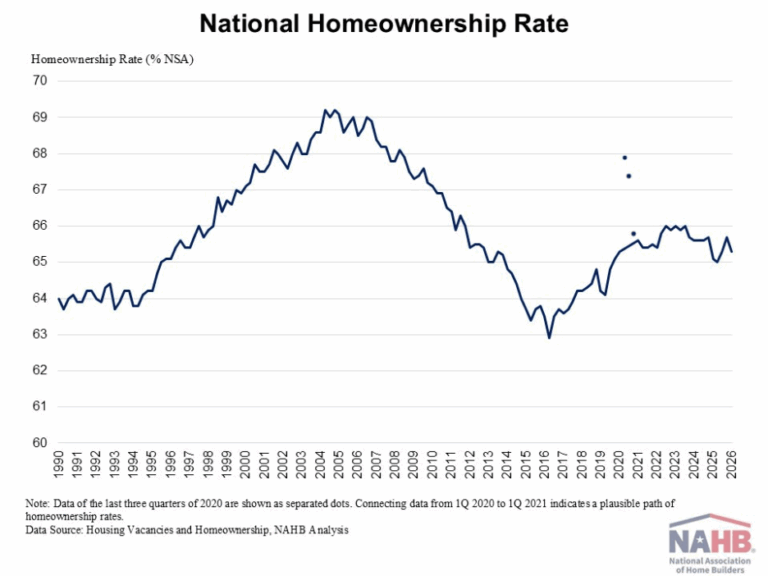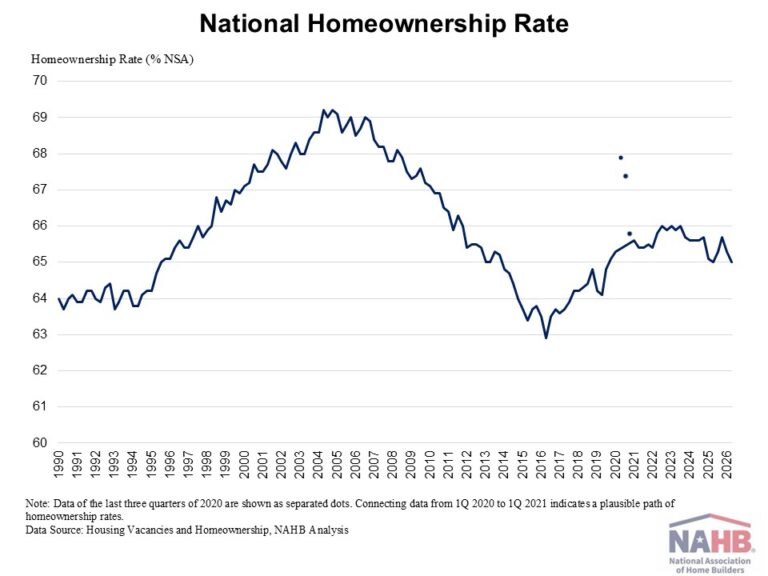
The latest homeownership rate declined to 65% in the second quarter of 2026, according to the Census’s Housing Vacancy Survey (HVS). The homeownership rate was unchanged from a year ago, and not statistically different than the rate in the first quarter of the year (65.3%). While this was a modest quarterly decrease, the broader picture continues to reflect significant affordability challenges. With mortgage interest rates remaining elevated, and housing supply still tight, housing affordability is at a multidecade low. Compared to the peak of 69.2% in 2004, the homeownership rate is currently 4.2 percentage points lower and remains below the 25-year average rate of 66.3%.
Compared with a year ago, homeownership rates decreased for three age groups. Younger households under age 35 experienced the largest drop, with the homeownership rate declining 1.2 percentage points from 36.4% to 35.2%. This age group is particularly sensitive to mortgage rates and the inventory of entry-level homes. The homeownership rate for householders aged 55-64 declined 0.7 percentage points, from 75.8% to 75.1%. Householders aged 35-44 also saw a slight decline, with the rate edging down by 0.1 percentage point from 61% to 60.9%. In contrast, householders aged 45-54 were the only age group that experienced an increase in homeownership rate, with the rate rising from 69.2% to 69.7%. The homeownership rate for the age group 65 and over remained unchanged at 78.6% over the same time.
The national rental vacancy rate stayed unchanged at 7.3% for the second quarter of 2026, on a steadily increasing trend since 2023. Meanwhile, the homeowner vacancy rate inched up to 1.2%. The upticks in homeowner vacancy rate signal an increase in the existing home supply.
The housing stock-based HVS revealed that the number of total households increased to 133.8 million in the second quarter of 2026 from 132.6 million a year ago. This increase was driven by both owner and renter household growth. The number of renter households rose by 0.45 million, while owner-occupied households increased by around 0.78 million over the same period.
This article was originally published by a eyeonhousing.org . Read the Original article here. .