Tag

Quarter

Browsing


Overall confidence in the market for new multifamily housing held steady year-over-year in the first quarter, according to the Multifamily Market Survey (MMS) by the National Association of Home Builders (NAHB). The MMS produces two separate indices. The Multifamily Production Index (MPI) had a reading of 44, unchanged year-over-year, while the Multifamily Occupancy Index (MOI) had a reading of 69, dropping 13 points year-over-year.

Multifamily developer sentiment is roughly where it was at this time last year, although the combination of regulatory hurdles, interest rates, insurance costs and volatility in material prices is threatening the viability of some projects. Also, in some markets, developers are reporting that it has become more difficult to obtain permits for unsubsidized projects.

The MPI and MOI continue to show that the market for garden and low-rise apartments typical of outlying areas is stronger than the market for mid- and high-rise apartments. The gap is narrowing year-over-year for new multifamily construction (i.e., blue line), while widening for the occupancy of existing apartments (i.e., orange line). NAHB is projecting that multifamily starts will increase slightly in 2026, but current production rates are unlikely to be sustained through 2027.

Multifamily Production Index (MPI)

The MMS asks multifamily developers to rate the current conditions as “good”, “fair”, or “poor” for multifamily starts in markets where they are active. The index and all its components are scaled so that a number above 50 indicates that more respondents report conditions as good rather than poor. The MPI is a weighted average of four key market segments: three in the built-for-rent market (garden/low-rise, mid/high-rise, and subsidized) and the built-for-sale (or condominium) market.

There were two components which experienced increases year-over-year, while the other two experienced decreases during the first quarter. The component measuring mid/high-rise rose seven points to 35, while the component measuring subsidized units increased six points to 56. On the other hand, the component measuring garden/low-rise fell six points to 48 while the component measuring built-for-sale units inched down one point to 37. Only the component measuring subsidized units was above the break-even point of 50.

Multifamily Occupancy Index (MOI)

The survey also asks multifamily property owners to rate the current conditions for occupancy of existing rental apartments in markets where they are active as “good”, “fair”, or “poor”.  Like the MPI, the MOI and all its components are scaled so that a number above 50 indicates more respondents report that occupancy is good than poor. The MOI is a weighted average of three built-for-rent market segments (garden/low-rise, mid/high-rise, and subsidized). 

All three MOI components experienced year-over-year decreases in the first quarter of 2026; the mid/high-rise component dropped 17 points to 59, the garden/low-rise component fell 11 points to 71, and the subsidized component decreased nine points to 80. Nevertheless, all three MOI components remain well above the break-even point of 50.

For more recent information about the market, the survey contains a separate question asking multifamily developers to compare current market conditions to conditions three months earlier. In the first quarter of 2026, 21% of respondents said the current market is better, and 19% said it is worse. However, the majority of developers—60%—said that the market is currently about the same as it was three months ago.

The MMS was re-designed in 2023 to produce results that are easier to interpret and consistent with the proven format of other NAHB industry sentiment surveys. Until there is enough data to seasonally adjust the series, changes in the MMS indices should only be evaluated on a year-over-year basis.

Please visit NAHB’s MMS web page for the full report.


This article was originally published by a eyeonhousing.org . Read the Original article here. .


Private fixed investment in student dormitories edged up 0.1% in the first quarter of 2026, holding at a seasonally adjusted annual rate (SAAR) of $3.9 billion. This modest gain marked a third consecutive quarterly increase, despite continued pressures from elevated interest rates. However, on a year-over-year basis, investments in dorms remained almost unchanged.

Private fixed investment in student housing experienced a surge after the Great Recession, as college enrollment increased from 17.2 million in 2006 to 20.4 million in 2011. However, during the pandemic, private fixed investment in student housing declined drastically from $4.4 billion (SAAR) in the last quarter of 2019 to $3 billion in the second quarter of 2021. According to the National Student Clearinghouse Research Center, college enrollment fell by 3.6% in the fall of 2020 and by 3.1% in the fall of 2021.

Since then, private fixed investment in dorms has rebounded, as college enrollments show a gradual recovery from pandemic-driven declines. Effective in-person learning requires college students to return to campuses, boosting the student housing sector. Still, demographic trends are reshaping the outlook for student housing. The U.S. faces slower growth in the college-age population as birth rates declined following the Great Recession. As a result, total enrollment in postsecondary institutions is projected to only increase 8% from 2020 to 2030, according to the National Center for Education Statistics, well below the 37% increase between 2000 and 2010.

Despite recent fluctuations, student housing construction shows signs of recovery, and future growth is expected in response to increasing student enrollment projections.


This article was originally published by a eyeonhousing.org . Read the Original article here. .


Real GDP growth accelerated in the first quarter of 2026, rebounding from a weak finish at the end of 2025, as government spending recovered following a disruptive shutdown. First-quarter growth was also supported by strong gains in business investment in equipment, driven by an artificial intelligence spending boom and rapid data center construction. Meanwhile, consumer spending showed signs of softening as elevated inflation continued to weigh on household purchasing power.

According to the “advance” estimate released by the Bureau of Economic Analysis (BEA), real gross domestic product (GDP) expanded at an annual rate of 2.0% in the first quarter, up from a 0.5% increase in the fourth quarter of 2025. This growth rate came in slightly above the NAHB forecast for the quarter (1.8%).

However, the latest data from the GDP report indicates that inflationary pressures remained elevated. The price index for gross domestic purchases rose 3.6% in the first quarter, compared with an increase of 3.7% in the fourth quarter of 2025. The Personal Consumption Expenditures (PCE) Price Index, which measures inflation (or deflation) across various consumer expenses and reflects changes in consumer behavior, accelerated to 4.5%. This is higher than a 2.9% rise in the previous quarter.

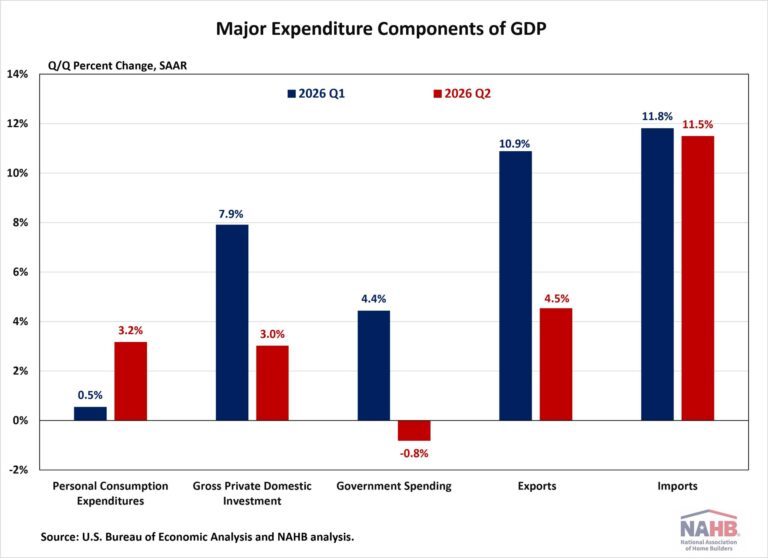
Breaking down the first-quarter data further, the acceleration in real GDP primarily reflected increases in government spending, exports, and business investment, which were partially offset by a slowdown in consumer spending. Imports, which are a subtraction in the calculation of GDP, increased during the quarter.

Consumer spending, the backbone of the U.S. economy, rose at an annual rate of 1.6% in the first quarter, the slowest pace since the first quarter of 2025. Within this category, spending on services grew at a 2.4% annual rate, while spending on goods edged down 0.1%.

Gross private domestic investment contributed 1.48 percentage points to headline GDP growth, led by robust gains in equipment and intellectual property products, alongside a buildup in private inventories. These increases were partially offset by declines in both residential and nonresidential structures.

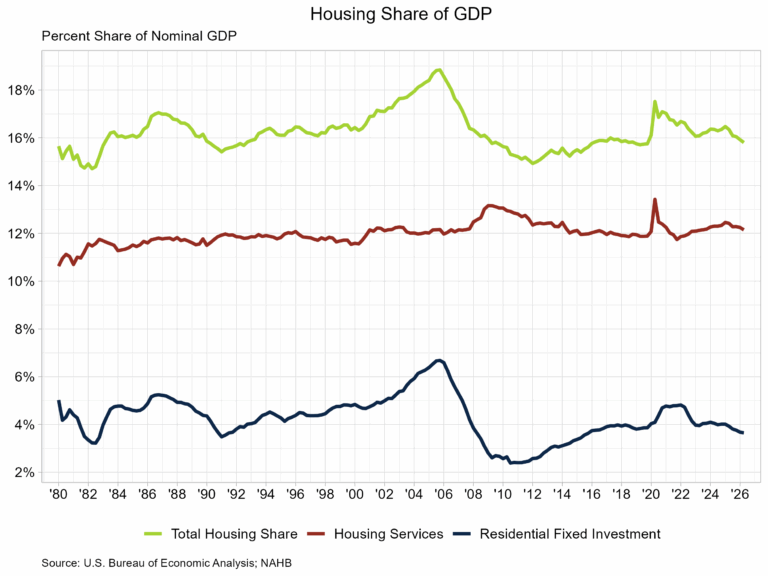
Nonresidential fixed investment rose sharply, increasing 10.4% in the first quarter. Strong gains in equipment (+17.2%) and intellectual property products (+13.0%) offset a decrease in structures (-6.7%). Meanwhile, residential fixed investment (RFI) declined 8.0% in the first quarter, marking the fifth consecutive quarterly decline. Within the residential category, single-family permanent site structures fell 8.0% at an annual rate, multifamily permanent site structures posted a modest 1.9% increase, and spending on home improvements dropped 4.6%.

Government spending provided a notable boost to growth, largely due to an increase in federal nondefense expenditures following the prior quarter’s disruptions. 

Trade activity also strengthened, with both exports and imports increasing. The increase was primarily driven by the goods trade, particularly in computers, peripherals, and related components. 

For the common BEA terms and definitions, please access bea.gov/Help/Glossary.


This article was originally published by a eyeonhousing.org . Read the Original article here. .


In the first quarter of 2026, the NAHB/Westlake Royal Remodeling Market Index (RMI) posted a reading of 62, down two points compared to the previous quarter. Despite this decline, the overall reading has been solidly in positive territory since Q1 2020.

Remodeler sentiment remained generally positive in the first quarter, even as many remodelers are still working to manage their customers’ cost expectations. Only a relatively small share report homeowners putting projects on hold due to economic and political uncertainty.

Ongoing positive remodeler sentiment is consistent with NAHB’s outlook, given an aging housing stock and the lock-in effect of elevated mortgage rates keeping owners in the homes longer. In the first quarter, remodelers reported 21% of their projects were associated with home improvements made shortly after a purchase, while only 4% were for homeowners’ projected to ready a home for sale.

The RMI is based on a survey that asks remodelers to rate various aspects of the residential remodeling market “good”, “fair” or “poor.” Responses from each question are converted to an index that lies on a scale from 0 to 100. An index number above 50 indicates a higher proportion of respondents view conditions as good rather than poor.

Current Conditions

The Remodeling Market Index (RMI) is an average of two major component indices: the Current Conditions Index and the Future Indicators Index. 

The Current Conditions Index is an average of three components: the current market for large remodeling projects ($50,000 or more), moderately-sized projects ($20,000 to $49,999), and small projects (under $20,000). In the first quarter of 2026, the Current Conditions Index averaged 70, edging down one point from the previous quarter. All three components remained well above 50 in positive territory. The component measuring small remodeling projects was the only one to experience a quarterly gain, inching up one point to 74. Both the moderate and large remodeling projects components were down two points to 69 and 67, respectively.

Future Indicators

The Future Indicators Index is an average of two components: the current rate at which leads and inquiries are coming in, and the current backlog of remodeling projects. 

In the first quarter of 2026, the Future Indicators Index averaged 54, down two points from the previous quarter. Both components decreased quarter-over-quarter but are above the break-even point of 50. The component measuring the current rate at which leads and inquiries are coming in edged down one point to 53, while the component measuring backlog of remodeling jobs dropped three points to 58.

For the full set of RMI tables, including regional indices and a complete history for each RMI component, please visit NAHB’s RMI web page.


This article was originally published by a eyeonhousing.org . Read the Original article here. .

Single-family construction declined further in the fourth quarter in all but sparsely populated micro counties, according to the NAHB Home Building Geography Index (HBGI). Meanwhile, multifamily construction showed growth in all markets for the first time in over two years as it continued to strengthen given the affordability challenges facing for-sale construction. The HBGI tracks single-family and multifamily permits across seven population density delineated geographies in the United States.

Single-Family

Among the HBGI markets, growth in the fourth quarter of 2025 was only registered in micro counties, which increased 1.6% year-over-year on a four-quarter moving average basis (4QMA). This was the seventh consecutive quarter where micro counties showed growth. All other markets reported declines, with the largest occurring in large metro core counties, posting a decline of 12.8%. All markets showed growth one year ago which quickly dissipated as 2025 presented a host of challenges for builders, ranging from the ongoing affordability crisis to economic uncertainty.

In terms of market share, single-family construction’s largest geography remained small metro core county areas, representing 29.4%.. The smallest single-family construction market remained non metro/micro county areas, with a 4.5% market share. The largest decline in market share over 2025 was in large metro core counties, falling one percentage point to 15.1%. The largest gain over the year was in small metro outlying counties as the market share rose from 10.0% to 10.5%.

Multifamily

Matching single-family, the largest gains for multifamily construction occurred in micro counties, growing 14.0% (4QMA) in the fourth quarter. This was followed by small metro outlying counties which grew 11.6%. The lowest growth was in large metro outlying counties at 1.9%. This quarter marks the first time that all markets showed growth since the first quarter of 2023.

In terms of market share, large metro core counties held the largest at 35.1%. The market share for large metro core counties rose significantly over the course of 2025, as it was 33.3% in the first quarter. The area that lost the most market share over the year was large metro outlying counties, falling from 4.7% to 3.7% in the fourth quarter.

The fourth quarter of 2025 HBGI data along with an interactive HBGI map can be found at https://nahb.org/hbgi.


This article was originally published by a eyeonhousing.org . Read the Original article here. .

Property tax revenue collected by state and local governments rose for the ninth consecutive quarter according to the Census Bureau’s quarterly summary of state and local tax revenue. Total tax revenue for state and local governments increased 2.1% over the quarter, with individual income tax revenue up 1.4%, sales tax revenue up 2.5%, and corporate income tax revenue up 8.3%. Property tax revenue rose the least amount over the quarter, up 1.0%. For 2025, state and local tax collections totaled $2.2 trillion, with property taxes accounting for $826.8 billion (37.5%).

Property tax revenue collected was $210.7 billion in the fourth quarter, an increase from a revised $208.5 billion estimate in the third quarter. These collections were 4.8% from one year ago. The share of property tax revenue as a share of total revenue was 37.3% in the fourth quarter. This share has been relatively stagnant at 37% over the past three years.  

Property taxes typically make up the largest share of the total tax revenue for state and local governments, with most property tax collected by local governments. The second highest revenue generator was sales tax at 27.6%, totaling $155.7 billion, followed closely by individual income tax at 27.0% ($152.5 billion). Corporate income tax rounded out the remaining 8.4% at $45.8 billion.


This article was originally published by a eyeonhousing.org . Read the Original article here. .

The market value of household real estate assets fell for the second consecutive quarter to $47.9 trillion in the fourth quarter of 2025, according to the most recent release of U.S. Federal Reserve Z.1 Financial Accounts. The fourth quarter level is 0.7% lower than the third quarter but is 2.1% higher than a year ago.

This measure of market value estimates the value of all owner-occupied real estate nationwide. The calculation combines both repeat-home sales data with estimates of additions to the housing stock, essential measuring both price changes and the change in quantity of housing assets. This approach explains why household real estate wealth can continue to rise even as other measures may show a slowing in home price growth.

Real estate secured liabilities of households’ balance sheets, i.e. mortgages, home equity loans, and HELOCs, increased 0.7% in the fourth quarter to $13.8 trillion. This level is 2.9% higher compared to the fourth quarter of 2024.

Owners’ equity share of real estate assets was 71.3% in the fourth quarter. This share also fell for the second consecutive quarter and was slightly lower than a year ago. Even with the quarterly decline, this share has been above 70% for 11 consecutive quarters, the longest stretch since the 1950s. Owners’ equity in real estate totaled $34.1 trillion in the fourth quarter.


This article was originally published by a eyeonhousing.org . Read the Original article here. .

According to NAHB analysis of quarterly Census data, the count of multifamily, for-rent housing starts increased year-over-year during the fourth quarter of 2025. For the quarter, 96,000 multifamily residences started construction. Of this total, 91,000 were built-for-rent. This built-for-rent total was 18% higher than in the fourth quarter of 2024. This marks a significant increase, and it is possible these numbers will be revised lower in future Census data given other multifamily data reporting.

The market share of rental units of multifamily construction starts was 95% for the fourth quarter. A historical low market share of 47% for built-for-rent multifamily construction was set during the third quarter of 2005, during the condo building boom. An average share of 80% was registered during the 1980-2002 period.

For the fourth quarter, there were 6,000 multifamily condo unit construction starts, flat from a year ago.

An elevated rental share of multifamily construction is holding typical apartment size below levels seen during the pre-Great Recession period. According to the fourth quarter 2025 data, the average square footage of multifamily construction starts increased to 1,068 square feet. The median increased to 1,048 square feet. These measures are consistent with the elevated share of multifamily built-for-rent construction.


This article was originally published by a eyeonhousing.org . Read the Original article here. .


U.S. house prices continued to rise at the close of 2025, though the pace of growth has slowed compared with the rapid gains of previous years. Elevated mortgage rates, affordability challenges, and ongoing economic uncertainty have restrained buyer demand, resulting in wide variations in local housing markets. While some states and metropolitan areas continue to post solid price gains, others are experiencing flat or declining prices.

Nationally, according to the quarterly purchase-only House Price Index (HPI)1 released by the Federal Housing Finance Agency (FHFA), U.S. house prices rose 1.8% in the fourth quarter of 2025, compared to the same period in 2024. This represents the slowest year-over-year (YoY) appreciation since the second quarter of 2012, indicating a cooling in the housing market following more than a decade of robust price growth. On a quarterly basis, appreciation was modest, increasing 0.8% from the third quarter.

The FHFA’s purchase-only HPI tracks average price changes based on more than six million repeat sales transactions on the same single-family properties. It offers insights about house price changes not only at the national level but also across states and metropolitan areas.

At the state level, 43 states experienced positive YoY price growth between the fourth quarter of 2024 and the fourth quarter of 2025, with gains ranging from 0.1% to 6.4%. North Dakota led the nation with a 6.4% gain, followed by Delaware with a 6.3% gain and Illinois with a 6.1% gain. On the opposite end, nine states and the District of Columbia reported negative YoY house price appreciation. Florida posted the most significant price decline at 2.7%. Notably, 33 states exceeded or matched the national YoY growth rate of 1.8%. On a quarterly basis, home prices declined in five states compared to the third quarter of 2025, highlighting softening momentum in select regional markets.

At the metro level, the divergence is even more pronounced. Among the 100 largest U.S. metro areas tracked by FHFA, YoY house price appreciation ranged from a 9.1% decline to an 8.9% increase. Cape Coral-Fort Myers, FL recorded the steepest annual decline, while Allentown-Bethlehem-Easton, PA-NJ posted the strongest annual gains over the previous four quarters. In total, 34 out of the 100 largest metro areas experienced annual price declines in the fourth quarter, while 66 metro areas posted gains.  Many of the strongest performers were concentrated in the Midwest and Northeast, where inventory remains limited and price levels are comparatively affordable. In contrast, several Sun Belt and Mountain West metro areas that saw outsized appreciation earlier in 2021-2022 are now facing flatter or negative growth as affordability pressures weigh on demand.

Note:


This article was originally published by a eyeonhousing.org . Read the Original article here. .


Lending standards for most types of residential mortgages were essentially unchanged but overall demand was weaker in the fourth quarter of 2025, according to the recent release of the Senior Loan Officer Opinion Survey (SLOOS). However, for commercial real estate (CRE) loans, lending standards for multifamily were looser, while standards for construction & development were essentially unchanged. Demand for construction & development loans was stronger, while demand for multifamily loans was essentially unchanged for the quarter. 

After three consecutive 25 basis point cuts to finish 2025, the Federal Reserve decided to maintain its key short-term interest rate (i.e., Federal Funds) unchanged during its first meeting of 2026. Participants on the Federal Open Market Committee (FOMC) continue to assess how to weigh the components of its dual mandate, as inflation continues to be above the stated target of 2% (i.e., the case for higher rates) while the economy is experiencing further deceleration in job growth (i.e., the case for lower rates). Given the current macroeconomic landscape and a change in leadership at the Fed as Jerome Powell’s term as Chair ends in May, NAHB anticipates that any further rate cuts will occur in the latter half of this year.

Residential Mortgages

In the fourth quarter of 2025, three of seven residential mortgage loan categories; GSE-eligible, Qualified Mortgage (QM) non-jumbo non-GSE eligible, and Government, saw a positive net easing index for lending conditions with an additional two (non-QM non-jumbo and QM jumbo) recording a neutral reading (i.e., 0). Subprime and non-QM jumbo loans experienced tighter lending conditions, as evidenced by a negative value, -8.3 and -4.2 respectively.

All seven residential mortgage loan categories reported weaker demand in the fourth quarter of 2025, with the weakest demand coming from subprime loans. This category has experienced weaker demand for 22 consecutive quarters.

Commercial Real Estate (CRE) Loans

For the CRE loan categories, multifamily registered a net easing index of +5.5 for the fourth quarter of 2025, indicating looser credit conditions for the first time since Q1 2022. As a reminder, this was when the Federal Reserve began their aggressive rate hiking path, which saw the Federal Funds rate increase by 525 basis points over a year and a half period. For construction & development loans, the net easing index was -1.8, or essentially unchanged.

The net percentage of banks reporting stronger demand was 8.9% for construction & development loans, with a positive number indicating stronger demand. This is the first time construction & development has been positive since Q4 2021. For multifamily loans, demand was -1.9% in the fourth quarter of 2025, which is essentially unchanged according to the Fed’s classification scheme (i.e., between -5.0% and +5.0%).


This article was originally published by a eyeonhousing.org . Read the Original article here. .

Pin It