Tag

Pressures

Browsing


Builder sentiment remains muted from economic and geopolitical uncertainty, elevated mortgage rates and rising construction costs.

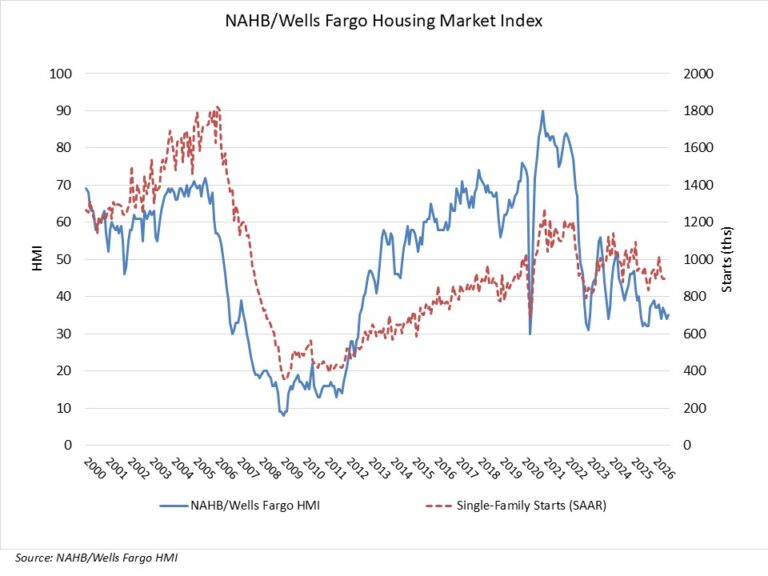
Builder confidence in the market for newly built single-family homes inched up one point to 35 in August, according to the National Association of Home Builders (NAHB)/Wells Fargo Housing Market Index (HMI).

August marked the 16th straight month that at least 30% of builders reported cutting prices to support demand, as well as the 16th consecutive month with the HMI below 40. Custom home builders continue to report stronger market conditions than spec builders, reflecting better conditions at the higher end of the market. Smaller, less dense markets are also outperforming larger metropolitan areas, and smaller builders report relatively stronger conditions than larger builders.

Rising gas and diesel prices are pushing up material costs, and spec home building remains weak as many prospective buyers stay on the sidelines. However, the Midwest remains a bright spot for the home building industry, with new home sales up in that region more than 2% so far in 2026.

The latest HMI survey also revealed that 35% of builders cut prices in August, down from 37% in July, and unchanged from June (35%). The average price reduction was 6% in August, the same rate as the previous month. The use of sales incentives was 63% in August, unchanged from the previous month.

Derived from a monthly survey that NAHB has been conducting for more than 40 years, the NAHB/Wells Fargo HMI gauges builder perceptions of current single-family home sales and sales expectations for the next six months as “good,” “fair” or “poor.” The survey also asks builders to rate traffic of prospective buyers as “high to very high,” “average” or “low to very low.” Scores for each component are then used to calculate a seasonally adjusted index where any number over 50 indicates that more builders view conditions as good than poor.

The index measuring current sales conditions increased two points to 39, while the indexes for future sales expectations and prospective buyer traffic held steady at 43 and 23, respectively.

Looking at the three-month moving averages for regional HMI scores, the Northeast fell one point to 44, the Midwest held steady at 45, the South fell two points to 31 and the West was unchanged at 27.

The HMI tables can be found at nahb.org/hmi.


This article was originally published by a eyeonhousing.org . Read the Original article here. .
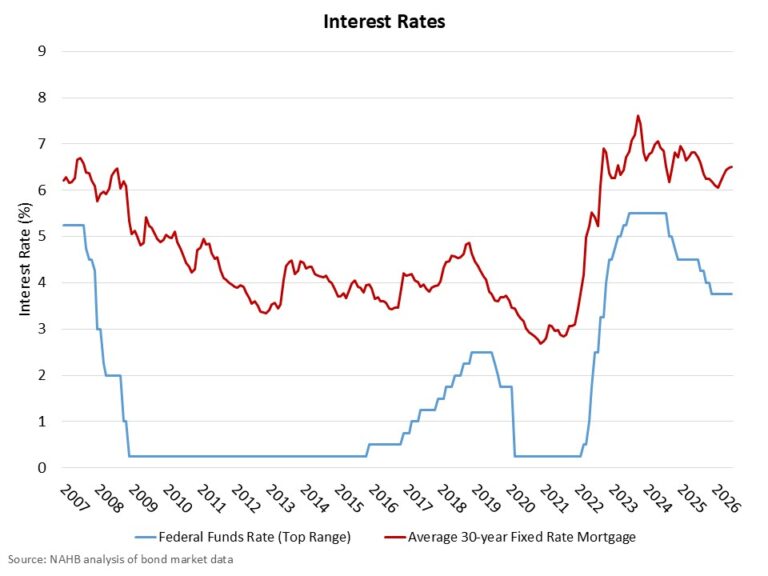

The Federal Reserve held the federal funds rate at a target range of 3.5% to 3.75% at the conclusion of its July policy meeting. There were three dissenting votes on the Federal Open Market Committee (FOMC), all of which supported raising the federal funds rate by 25 basis points. The July monetary policy hold marked the fifth consecutive hold, following 75 basis points of cuts at the end of 2025.

The central bank noted that “economic activity is expanding at a solid pace despite elevated uncertainty.” The Fed also stated that this uncertainty is due in part to the conflict in the Middle East. Additionally, Chairman Warsh noted at his press conference that the economy has shown “impressive resilience” in the face of these headline risks.

In a theme likely to receive growing attention in the quarters ahead, the Fed noted that productivity growth and capital investment are strong. Productivity growth, in particular, suggests future deflationary forces. The Fed also noted that the unemployment rate has experienced little change in recent data.

With respect to inflation, the Fed stated that “inflation remains elevated” relative to the central bank’s two percent target. Importantly, the Fed attributed these inflation challenges to “supply shocks,” including the energy sector.

If you squint a little, this can be seen as a dovish policy message because, while the Fed can affect aggregate demand by tightening monetary policy (as the bond market appears to expect), the central bank cannot effectively address supply shocks with policy. While this should not be interpreted as taking rate hikes off the table, it is an accurate statement of current macroeconomic conditions and many analysts’ views that the Fed cannot solve energy price increases due to war or one-off tariff effects with monetary policy. The same can be said about the impact of the housing deficit on the shelter component of overall inflation, which can only be addressed by other policies that bend the cost curve for housing supply.

From a policy perspective, the Fed noted very clearly, “The Committee will deliver price stability.” The Fed also explicitly emphasized the FOMC’s two percent inflation goal. Chairman Warsh reiterated this two percent goal clearly in his press conference. Moreover, the Fed Chairman noted that nominal long-term interest rates had moved higher since the last meeting, which he attributed to economic data rather than Fed forward guidance.

Indeed, the two-year Treasury rate is now 50 basis points higher than the top target rate for the federal funds rate, indicating that the bond market is expecting Fed tightening. However, one could also argue, as Chairman Warsh appeared to do so at his press conference, that the market has responded to the Fed’s current stance and goals and is delivering an environment in which market forces do the work of tighter policy. Chairman Warsh even suggested that despite the “no change” policy for the July meeting, other changes in market conditions indicate that the July meeting did not result in a policy “pause.”

There were important items not discussed in today’s statement, although they were referenced in today’s press conference. Chairman Warsh has established several task forces looking at Fed communications, forward guidance, data measurement (including how inflation is measured, a topic discussed at the Chairman’s press conference, suggesting new, preferred measures are coming), and other policy-related topics. We will learn more about those efforts down the road.

The Fed will also likely address the status of the central bank’s balance sheet, which can affect long-term interest rates, including mortgage rates, if balance sheet reduction were to be accelerated. These long-term rate changes, set by markets, are in the driver’s seat in the meantime.


This article was originally published by a eyeonhousing.org . Read the Original article here. .

Single-family housing starts declined in April as builders faced continued economic uncertainty and affordability challenges, including higher construction costs, ongoing labor shortages and elevated financing expenses. The latest housing starts and permits data suggest that the overall construction pipeline remains uneven across regions and property types.

Overall housing starts decreased 2.8% in April to a seasonally adjusted annual rate of 1.47 million units, according to a report from the U.S. Department of Housing and Urban Development (HUD) and the U.S. Census Bureau. This pace reflects the number of housing units builders would begin over the next 12 months if April’s activity were sustained.

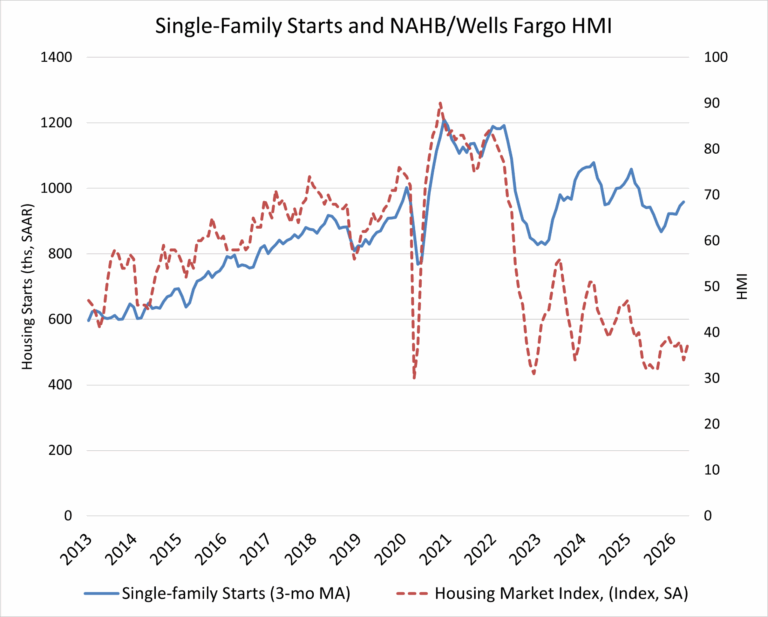
Within the total, single-family starts decreased 9.0% to a 930,000 seasonally adjusted annual rate and were down 2.4% compared to April 2025. On a year-to-date basis, single-family starts are down 5.1%. Given recent volatility, the three-month moving average provides a clearer signal, rising to 958,000 units.

Multifamily starts, which include apartment buildings and condominiums, increased 10.3% from March to April to an annualized 535,000 pace. The three-month moving average for multifamily construction has trended higher to 481,000 units, and activity is 19.7% higher compared to year-earlier levels.

Regionally, on a year-to-date basis, combined single-family and multifamily starts were 16.6% higher in the Northeast, 1.8% higher in the South, 0.4% lower in the West, and 2.9% lower in the Midwest. For single-family starts, the Midwest was the only region to post an increase, rising 5.2% and reflecting the residential construction strength in the region.

The total number of housing units under construction stood at 1.3 million in April, down 8.5% from a year earlier. Single-family homes under construction stood at 588,000 units, a 7.0% year-over-year decline. Multifamily units under construction declined to 687,000, down from peaks above 1 million units in December 2023 and 9.8% lower than a year ago.

Completions of single-family homes have slowed to an annual rate of about 903,000 units, reflecting ongoing challenges in the residential construction sector. This marks a 7.0% decline from a year earlier. However, multifamily completions for buildings with five or more units were up 6.4% year over year to a 529,000-unit pace. On a year-to-date basis, total completions across both sectors are down 11.2%.

Overall permits increased 5.8% to a 1.44-million-unit annualized rate in April. Single-family permits decreased 2.6% to an 872,000-unit rate and are down 5.5% compared to April 2025. Multifamily permits increased 21.8% to an annualized 570,000 pace and are up 9.2% compared to April 2025. Looking at regional permit data on a year-to-date basis, total permits were 14.2% higher in the Northeast, 7.3% higher in the Midwest, 0.7% higher in the West, but 6.7% lower in the South.


This article was originally published by a eyeonhousing.org . Read the Original article here. .
Pin It