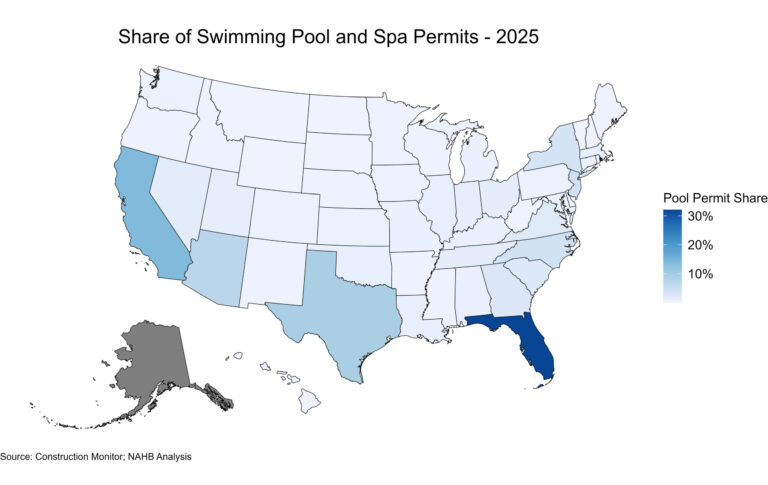
State-level permitting activity continued to reflect a divided housing market through the first five months of 2026. Elevated mortgage rates and ongoing affordability challenges continued to weigh on single-family construction across much of the country, while multifamily permitting remained comparatively stronger, supported by gains in several regions despite continued weakness in parts of the South.
Over the first five months of the year, the number of single-family permits issued nationwide reached 380,130. Compared with the same period in 2025, this represents a 6.1 percent decline compared with the May 2025 total of 404,977. In contrast, multifamily permitting activity remained stronger, with 208,192 permits issued nationwide, marking a 6.5 percent increase from the same period last year.
Regionally, year-to-date single-family permitting declined in all four regions through May. The Midwest was essentially flat, while the South declined 5.3 percent, the West fell 9.4 percent, and the Northeast posted the largest decline, down 12.2 percent. Multifamily permits increased in three of the four regions, led by the Northeast (up 32.9 percent), followed by the West (up 18.3 percent) and the Midwest (up 5.0 percent). The South was the only region to post a decline, with multifamily permits falling 5.7 percent, driven largely by reduced permitting activity in major metropolitan areas across the region.
At the state level, ten states and the District of Columbia recorded year-over-year increases in single-family permits through May, with gains ranging from 54.5 percent in the District of Columbia to 0.2 percent in Connecticut. The remaining 39 states posted declines, led by Nevada, which recorded the steepest drop at 28.5 percent. Kentucky reported no change.
The ten states issuing the highest number of single-family permits accounted for 62.8 percent of all single-family permits issued nationwide. Texas led the nation with 61,157 permits issued through May 2026, although this represented a 7.4 percent decline from the same period in 2025. Florida, the second-highest state, recorded a 5.5 percent decline, while North Carolina, ranking third, posted a 9.5 percent decrease.
Between May 2026 and May 2025, 33 states and the District of Columbia recorded increases in multifamily building permits, while 17 states experienced declines. Rhode Island posted the largest percentage increase, with multifamily permits rising 158.6 percent, from 251 to 649 units. In contrast, Nevada recorded the steepest decline, with permits falling 77.6 percent, from 3,702 to 828 units.
The ten states issuing the highest number of multifamily permits accounted for 62.6 percent of all multifamily permits issued nationwide. Through the first five months of 2026, California, which issued the largest number of multifamily permits, posted a 47.9 percent increase compared with the same period last year. Texas, the second-highest state, recorded a 23.3 percent decline, while Florida, ranking third, saw multifamily permits decrease by 37.4 percent.
At the local level, the following are the ten metropolitan areas with the highest number of single-family permits issued.
Below are the ten metropolitan areas with the highest levels of multifamily permitting activity. It is worth noting that the largest multifamily markets continue to show declines. Gains for multifamily permitting are occurring in smaller markets and for smaller builders.
This article was originally published by a eyeonhousing.org . Read the Original article here. .