Tag

Pace

Browsing


Real GDP growth slowed in the second quarter of 2026, as a pullback in government spending and slower growth in investment and exports, more than offset stronger consumer spending. Business investment continued to support growth, particularly through equipment and intellectual property products, while imports increased and remained a drag on headline GDP.

According to the “advance” estimate released by the Bureau of Economic Analysis (BEA), real gross domestic product (GDP) expanded at an annual rate of 1.5% in the second quarter, down from a 2.1% increase in the first quarter of 2026.

The latest GDP report also showed that inflationary pressures remained elevated. The price index for gross domestic purchases rose 5.7% in the second quarter, up from 3.6% in the first quarter. The Personal Consumption Expenditures (PCE) Price Index, which measures inflation (or deflation) across various consumer expenses and reflects changes in consumer behavior, increased 5.1%, compared with a 4.6% increase in the previous quarter. Excluding food and energy, the core PCE price index increased 3.4%, easing from 4.4% in the first quarter.

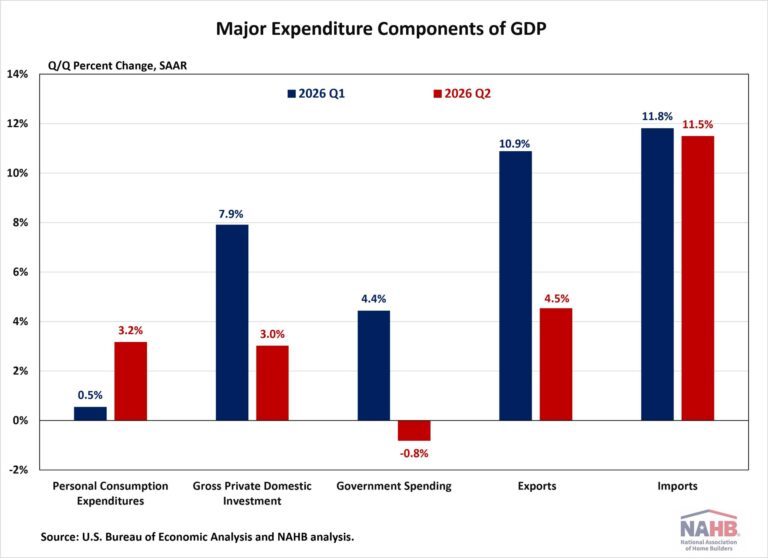
Breaking down the second-quarter data further, growth in real GDP primarily reflected gains in consumer spending, investment, and exports, which were partly offset by a decrease in government spending. Imports, which are a subtraction in the calculation of GDP, increased during the quarter.

Consumer spending, the backbone of the U.S. economy, accelerated in the second quarter, rising at an annual rate of 3.2% after a 0.5% increase in the first quarter. This acceleration helped offset weakness in other components of GDP and supported the broader measure of underlying private demand.

Real final sales to private domestic purchasers, the sum of consumer spending and gross private fixed investment, increased 3.9% in the second quarter, up from 1.7% in the first quarter. This measure suggests that private domestic demand strengthened even as headline GDP growth slowed.

Gross private domestic investment continued to expand in the second quarter, although at a slower pace than in the first quarter. Gains in equipment and intellectual property products supported business investment, while private inventories and some structures categories weighed on growth.

Nonresidential fixed investment increased 8.4% in the second quarter. Strong gains in equipment (+15.2%) and intellectual property products (+8.8%) offset a decrease in structures (-5.0%). Meanwhile, residential fixed investment (RFI) rose 1.5%, making its first positive contribution after five consecutive quarters of weakness. Within the residential category, investment in single-family permanent site structures rose 4.4% at an annual rate, multifamily permanent site structures declined 1.8%, and spending on improvements fell 5.0%.

Government spending declined 0.8% in the second quarter, reversing the prior quarter’s boost and contributing to the slowdown in overall economic growth.

Trade activity remained positive but less supportive of GDP growth. Exports continued to increase, although at a slower pace than in the first quarter, while imports accelerated. Because imports are subtracted from GDP, the increase in imports reduced second-quarter headline growth.

For the common BEA terms and definitions, please access bea.gov/Help/Glossary.


This article was originally published by a eyeonhousing.org . Read the Original article here. .

Prices for inputs to new residential construction—excluding capital investment, labor, and imports—were up 0.6% in March according to the most recent Producer Price Index (PPI) report published by the U.S. Bureau of Labor Statistics. The increase in February was revised upward to 0.7%. The Producer Price Index measures prices that domestic producers receive for their goods and services; this differs from the Consumer Price Index which measures what consumers pay and includes both domestic products as well as imports.

The inputs to the New Residential Construction Price Index grew 1.3% from March of last year. The index can be broken into two components—the goods component also increased 1.3% over the year, with services increasing 1.3% as well. For comparison, the total final demand index, which measures all goods and services across the economy, increased 2.7% over the year, with final demand with respect to goods up 0.9% and final demand for services up 3.6% over the year.

Input Goods

The goods component has a larger importance to the total residential construction inputs price index, representing around 60%. For the month, the price of input goods to new residential construction was up 0.5% in March.

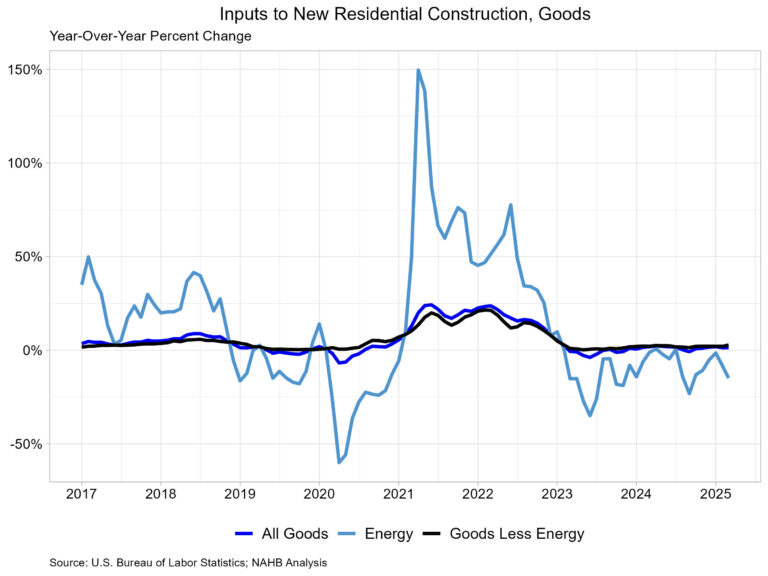
The input goods to residential construction index can be further broken down into two separate components, one measuring energy inputs with the other measuring goods less energy inputs. The latter of these two components simply represents building materials used in residential construction, which makes up around 93% of the goods index.

Energy input prices fell 3.9% between February and March and were 14.9% lower than one year ago. Building material prices were up 0.8% between February and March and up 2.7% compared to one year ago. Energy costs have continued to fall on a year-over-year basis, as this marks the eighth consecutive month of lower input energy costs.

Metal products used in residential construction saw the largest price increases in the month of March. Across all inputs to new residential construction, ornamental and architectural metal work increased the most, up 21.0%. Ornamental and architectural metal work products increased 11.2% on a month-to-month basis, by far their largest monthly increase for the product, with the next closes being 7.9% back in October of 2021.

Input Services

While prices of inputs to residential construction for services were down 0.1% over the year, they were up 1.1% in March from February. The price index for service inputs to residential construction can be broken out into three separate components: a trade services component, a transportation and warehousing services component, and a services excluding trade, transportation and warehousing component (other services). The most significant component is trade services (around 60%), followed by other services (around 29%), and finally transportation and warehousing services (around 11%). The largest component, trade services, was up 0.7% from a year ago. The other services component was up 1.6% over the year. Lastly, prices for transportation and warehousing services advanced 3.6% compared to March last year.

Discover more from Eye On Housing

Subscribe to get the latest posts sent to your email.


This article was originally published by a eyeonhousing.org . Read the Original article here. .


In a widely anticipated move, the Federal Reserve’s Federal Open Market Committee (FOMC) reduced the short-term federal funds rate by an additional 25 basis points at the conclusion of its December meeting. This policy move reduces the top target rate to 4.5%. However, the Fed’s newly published forward-looking projections also noted a reduction in the number of federal funds rate cuts expected in 2025, from four in its last projection to just two 25 basis point reductions as detailed today.

The new Fed projection envisions the federal funds top target rate falling to 4% by the end of 2025, with two more rate cuts in 2026, placing the federal funds top target rate to 3.5% at the end of 2026. One final rate is seen occurring in 2027. Furthermore, the Fed also increased its estimate of the neutral, long-run rate (sometimes referred to as the terminal rate) from 2.9% to 3%, which is reflective of stronger expectations for economic growth and productivity gains.

For home builders and other residential construction market stakeholders, the new projections suggest an improved economic growth environment, one in which there is a smaller amount of monetary policy easing, leading to higher than previously expected interest rates for acquisition, development and construction (AD&C) loans. Thus, more economic growth but higher interest rates.

The statement from the December FOMC summarized current market conditions as:

Recent indicators suggest that economic activity has continued to expand at a solid pace. Since earlier in the year, labor market conditions have generally eased, and the unemployment rate has moved up but remains low. Inflation has made progress toward the Committee’s 2 percent objective but remains somewhat elevated.

The Fed’s broader economic projections generally experienced positive revisions. The central bank lifted its forecast for GDP growth in 2025 to 2.1%. It sees the unemployment rate at 4.3% at the end of 2025, down from 4.4%.

However, the Fed also increased its inflation expectations. The central bank now sees 2.5% core PCE inflation at the end of 2025, up from its prior projection of 2.1%. While long-run expectations of the FOMC remained anchored at the 2% inflation target, the increase for the 2025 expectation for inflation is the reason for taking two rate cuts off the table for 2025, leaving just two remaining in the forecast.

Despite 100 basis points of easing for the short-term federal funds rate since September, long-term interest rates (which are set by markets and investors), including mortgage rates, have increased. This reflects market expectations of firmer inflation and a slower path for monetary policy easing. Policy concerns over government deficits and perhaps tariffs are also affecting investor outlooks. The size of the government deficit will be key for future inflation and long-term interest rates, particularly given a significant debate on taxes and government spending set for the start of 2025. And the slower path of monetary policy easing pushed the 10-year Treasury rate to 4.5%.

The pace of overall inflation is moving lower albeit slowly. Shelter inflation continues to be a driver of overall inflation, with gains for housing costs responsible for 65% of overall inflation over the last year. This kind of inflation can only be tamed in the long-run by increases in housing supply. Fed Chair Powell has previously noted it will take some time for rent cost growth to slow although it is moving lower. Given recent tight financing conditions, however, the Fed noted that while consumer spending is resilient, “…activity in the housing sector has been weak.” A slower path of Fed rate cuts for 2025 will keep builder and developer construction loan interest rates higher than previously expected and act as an additional headwind for gains in housing supply.

Discover more from Eye On Housing

Subscribe to get the latest posts sent to your email.


This article was originally published by a eyeonhousing.org . Read the Original article here. .

Pin It