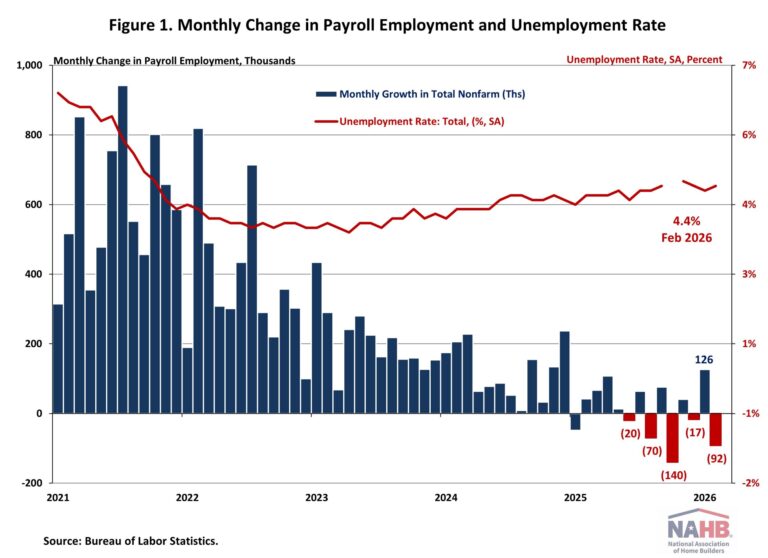
The U.S. labor market weakened in February, as payroll employment declined and the unemployment rate rose to 4.4%. The cooling labor market could place the Federal Reserve in a challenging position as policymakers weigh slower job growth against inflation pressures from rising oil prices.
Wage growth accelerated slightly in February, with average hourly earnings rising 3.8% year-over-year. This pace is 0.3 percentage points lower than a year ago. Importantly, wage growth has been outpacing inflation for nearly two years, which typically occurs as productivity increases.
National Employment
According to the Employment Situation Summary reported by the Bureau of Labor Statistics (BLS), total nonfarm payroll employment fell by 92,000 in February, following a downwardly revised gain of 126,000 jobs in January. This marks the sixth monthly decline since January 2025 and the second-largest monthly job loss during that period.
Estimates for the previous two months were revised lower. The monthly change in total nonfarm payroll employment for December was revised down by 65,000 from +48,000 to -17,000, while the change for January was revised down by 4,000 from +130,000 to +126,000. Combined, these revisions reduced previously reported employment by 69,000 jobs.
The unemployment rate ticked up to 4.4% in February from 4.3% in January. Over the month, the number of persons unemployed rose by 203,000, while the number of persons employed declined by 185,000.
Meanwhile, the labor force participation rate—the proportion of the population either looking for a job or already holding a job—declined 0.1 percentage points to 62.0%. This was the lowest rate since January 2022 and remains below its pre-pandemic level of 63.3% recorded at the beginning of 2020. Among prime working-age individuals (aged 25 to 54), the participation rate decreased to 83.9%.
Health care, which has been the primary growth driver of payroll growth in recent months, lost 28,000 jobs in February, largely due to a strike at Kaiser Permanente during the BLS survey period. Employment in the information sector also trended down, shredding 11,000 jobs, while federal government cut another 10,000 jobs. Meanwhile, the social assistance sector added 9,000 jobs, driven by gains in individual and family services (+12,000).
Construction Employment
Employment in the overall construction sector declined by 11,000 jobs in February, following an upwardly revised gain of 48,000 in January. Within the industry, residential construction shed 7,100 jobs, while non-residential construction lost 3,800 positions.
Residential construction employment now stands at 3.3 million in February, including 929,000 workers employed by builders and remodelers and nearly 2.4 million residential specialty trade contractors.
The six-month moving average of job gains for residential construction remains negative, at a loss of 533 per month, reflecting losses in three of the past six months. Over the last 12 months, residential construction has seen a net loss of 46,100 jobs, marking the twelfth consecutive annual decline and the longest stretch of annual losses since the Great Recession. Since the low point following the Great Recession, residential construction has gained 1,306,900 positions.
In February, the unemployment rate for construction workers edged down slightly to 4.6% on a seasonally adjusted basis, remaining relatively low compared with historical norms.
This article was originally published by a eyeonhousing.org . Read the Original article here. .