Tag

Loan

Browsing


Single-family construction lending fell in the fourth quarter, according to data released by the Federal Deposit Insurance Corporation (FDIC). The decline in the outstanding volume of acquisition, development and construction (AD&C) loans occurred even with two Federal Reserve rate cuts in the fourth quarter. Additionally, NAHB’s AD&C Financing Survey points to continued tightening in credit conditions in the fourth quarter notwithstanding the latest decline in financing rates. Economic uncertainty remains a leading factor behind the persistence of tighter financing conditions for residential construction.

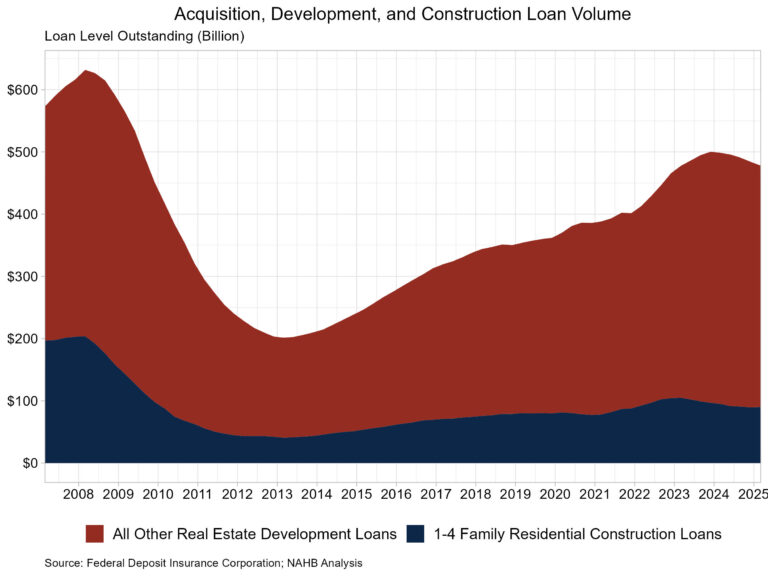
In the fourth quarter of 2025, the total level of outstanding AD&C loans fell to $456.3 billion, down 1.5% from the third quarter. The quarterly decline was led by a drop in other real estate development loans, which decreased 1.8% over the quarter to $365.2 billion. Meanwhile, the volume of 1-4 family residential construction and land development loans declined to $91.1 billion in the fourth quarter, down 0.2% from a quarter earlier. Although the volume of 1-4 family residential construction loans fell over the quarter, the outstanding amount was up 1.7% from last year. This marked the second straight quarter showing a year-over-year increase.

It is worth noting that the FDIC data represent only the stock of loans, not changes in the underlying flows, so it is an imperfect data source. Nonetheless, lending remains much reduced compared with years past. The current amount of existing 1-4 family residential AD&C loans now stands 56% lower than the peak level of residential construction lending of $204 billion reached during the first quarter of 2008. Alternative sources of financing, including equity partners, have supplemented this capital market in recent years.

Quality Metrics of Construction Loans

The volume of loans that are 30+ days past due or nonaccrual status fell for the third consecutive quarter, to $985.3 million. As a share of the total 1-4 family residential construction loan volume, this accounts for 1.1%.

Breaking this out further, the level of loans 30-89 days past due was $414.6 million, while the volume in nonaccrual status was $522.1 million. The nonaccrual loan volume fell from $593.4 million in the third quarter and the 30-89 past due volume fell from $418.5 million.

Loans are classified as nonaccrual when one or more of the following conditions apply: the loan is 90 days or more past due on principal or interest (unless it is well-secured and in the process of collection); the bank no longer expects full repayment of principal and interest; or the borrower’s financial condition has significantly deteriorated, warranting cash-basis accounting.

Which Size Banks are Lending?

Of the outstanding $91.1 billion in 1-4 family residential constructions loans, banks between $1 billion and $10 billion in total assets held the largest share at $32.2 billion (35.3%) at the end of 2025. Banks with assets between $10 and $250 held the next largest share at $30.1 billion (33.0%). The smallest banks, those with under $1 billion in assets, held $19.8 billion (21.7%) while the largest banks, with over $250 billion in total assets, had $9.0 billion (9.9%).

The distribution of banks holding 1-4 family residential construction loans is significantly different from the composition of all bank assets. At the end of 2025, the total amount of assets held by FDIC-insured banks was $25.26 trillion. Most of the banking industry’s assets are held by banks with over $250 billion in total assets, at 60.3%. This large bank asset group is comprised of just 16 banks as of the fourth quarter of 2025. Banks with between $10 billion and $250 billion in total assets held 25.3% of the industry’s total assets, as banks with $1 billion to $10 billion held 10.1%. Banks with under $1 billion in total assets had a market share of 4.3%.


This article was originally published by a eyeonhousing.org . Read the Original article here. .


Home improvement activity has remained elevated in the post-pandemic period, but both the volume of loan applications and the age profile of borrowers have shifted in notable ways. Data from the Home Mortgage Disclosure Act (HMDA), analyzed by NAHB, show that total home improvement loan applications have eased from their recent post-pandemic peak, and the distribution of borrowers across age groups has gradually tilted older.

The number of home improvement loan applications increased sharply during the housing boom and the remodeling surge that followed the onset of the pandemic. After totaling 1.15 million loans in 2019, activity fell 20% to 0.92 million in 2020 as uncertainty and lockdowns disrupted markets. Applications then rebounded to 1.07 million in 2021 and climbed to a cycle high of 1.49 million in 2022, reflecting strong demand for renovations. Since then, activity has moderated but remains historically solid, edging down to 1.25 million loans in 2023 and 1.20 million in 2024. Despite cooling from the pandemic-era surge, the 2024 total stands above pre-pandemic levels, supported by an aging housing stock and limited inventory of existing homes for sale.

Alongside these changes in loan volume, the age composition of borrowers has gradually shifted, revealing notable changes across age groups.

In 2019, applicants ages 45-54 accounted for the largest share of home improvement loans at 26.0%. By 2024, their share slipped slightly to 25.2% but remained the largest cohort. The 55-64 age group experienced a more noticeable decline, falling from 23.2% in 2019 to 21.7% in 2024.

In contrast, both younger and older segments expanded their presence in the remodeling market. Borrowers ages 35-44 increased their share from 22.0% to 22.9%, while those ages 25-34 rose from 8.7% to 9.1%. Although, still representing a small portion of total applications, applicants under age 25 edged up from 0.4% to 0.5%. More notably, the share of older loan applicants increased. The 65-74 cohort ticked up from 13.1% to 13.2%, and applicants over age 74 rose from 4.7% to 5.4%.

Overall, the data indicate a gradual aging of home improvement activity. Borrowers aged 65 and older accounted for 17.8% of loan applications in 2019, increasing to 18.6% in 2024. This shift likely reflects both the aging of the homeowner population and a growing preference among older homeowners to undertake aging-in-place renovation and maintain homes they have owned for many years. Meanwhile, the modest gains among borrowers in their mid-30s to early 40s suggest continued renovation demand from trade-up buyers and households choosing to remodel rather than buy a new home amid high interest rates.


This article was originally published by a eyeonhousing.org . Read the Original article here. .


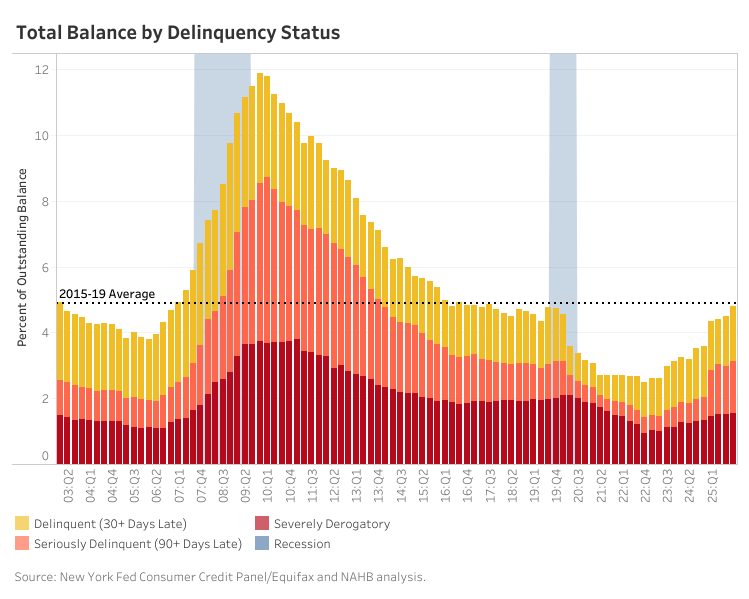
Delinquent consumer loans have steadily increased as pandemic distortions fade, returning broadly to pre-pandemic levels. According to the latest Quarterly Report on Household Debt and Credit from the Federal Reserve Bank of New York, 4.8% of outstanding household debt was delinquent at the end of 2025, 0.3 percentage points higher than the third quarter of 2025 and 1.2% higher from year-end 2024.

This increase reflects a normalization period coming out of the pandemic, when delinquency rates were suppressed by payment forbearance and fiscal support. As these government assistance programs ended and credit reporting normalized, delinquency rates rose steadily and are now on par with pre-pandemic levels.

While aggregate delinquency has normalized, transitions into serious delinquency (defined as 90+ days past due) show diverging patterns across loan types. Student loans and credit cards stand out as having significantly higher inflows into serious delinquency than before the pandemic, while mortgages, HELOC and auto loan transitions remain comparatively stable.

Late student loan payments saw a sharp rise in early 2025, and by the fourth quarter of 2025, 16.2% of student loan balances became seriously delinquent over the past year. This surge reflects the re-entering of delinquent balances into credit reports following a nearly 5-year pause due to the pandemic. Credit cards, on the other hand, show signs of deterioration with new seriously delinquent balances rapidly rising mid-2022 before moderating around 7% in recent years. In the fourth quarter of 2025, about 7.1% of credit card balances transitioned into serious delinquency over the past year, a rate comparable to levels observed during the early stages of the Great Recession.

Mortgage transitions into serious delinquency remain low at around 1.4% annually, despite edging higher in recent years and are currently slightly higher than pre-pandemic levels. In a further analysis on the credit report data from Equifax, the deterioration is concentrated among borrowers living in lower-income zip codes, where serious mortgage delinquency rates for this group of borrowers have reached roughly 3.0% by late 2025.

Comparing delinquency transitions with the overall balance of seriously delinquent loans provides a clearer understanding of current credit conditions. Credit cards display a concerning trend in which both transition rate and overall balance of seriously delinquent loan balances are rising. For example, the share of credit card balances 90+ days past due is only about one percentage point below its post-great recession peak in 2010 at 12.7%, which seems to suggest persistent issues in repayment by borrowers.

Mortgages show the opposite dynamic, whereby the balance of seriously delinquent mortgages has remained stable despite a steady increase in transitions into serious delinquency. This divergence indicates higher recovery rates or shorter delinquency periods, an implication that mortgage borrowers prioritize meeting their mortgage payments which would be rational if borrowers had locked in historic low mortgage rates and have built up sufficient home equity.

While it is too early to determine if elevated transition rates will translate into increasing seriously delinquent student loan balances, this rate remains high at 9.6% at the end of 2025. Furthermore, the credit scores of student loan borrowers that improved during the student loan payment pause, will now be affected and could weigh on borrowers’ demand or ability to access other forms of credit, especially in an environment of tighter labor markets.


This article was originally published by a eyeonhousing.org . Read the Original article here. .


Single-family construction lending picked up in the third quarter, amidst the overall cooling lending environment. Loan balances for 1-4 family construction grew to $91.2 billion in the third quarter, registering the first annual increase in over two years. However, across all acquisition, development and construction (AD&C) loans, the total volume fell for the seventh straight quarter.

According to data from the Federal Deposit Insurance Corporation (FDIC), the total level of outstanding AD&C loans fell to $463.0 billion in the third quarter of 2025, down 5.6% from one year ago. This year-over-year decrease was led by a drop in other real estate development loans, which decreased 7% over the year to $371.8 billion. Meanwhile, the volume of 1-4 family residential construction and land development loans rose to $91.2 billion in the third quarter, up 0.5% from one year ago.

It is worth noting, the FDIC data represent only the stock of loans, not changes in the underlying flows, so it is an imperfect data source. Nonetheless, lending remains much reduced from years past. The current amount of existing 1-4 family residential AD&C loans now stands 56% lower than the peak level of residential construction lending of $204 billion reached during the first quarter of 2008. Alternative sources of financing, including equity partners, have supplemented this capital market in recent years.

Quality Metrics of Construction Loans

While the total volume of 1-4 family residential construction loans rose, the volume of loans 30+ days past due or nonaccrual status fell slightly to $1.1 billion over the quarter. As a share of the total 1-4 family residential construction loan volume, this accounts for 1.2%.

Breaking this out further, the level of loans 30-89 days past due was $418.1 million, while the volume in nonaccrual status was $593.4 million. The nonaccrual loan status volume increased from $572.4 million in the second quarter and the 30-89 past due fell from $469.2 million.

Loans are classified as nonaccrual when one or more of the following conditions apply: the loan is 90 days or more past due on principal or interest (unless it is well-secured and in the process of collection); the bank no longer expects full repayment of principal and interest; or the borrower’s financial condition has significantly deteriorated, warranting cash-basis accounting.


This article was originally published by a eyeonhousing.org . Read the Original article here. .


Overall consumer credit continued to rise for the third quarter of 2025, but the pace of growth remains slow. Student loan balances continue to rise as well, slowly returning to pre-COVID growth. Furthermore, credit card and auto loan balances continue to grow but at historically low rates. Although interest rates are still elevated, credit card and auto loan rates continue to decrease slightly. 

Total outstanding U.S. consumer credit reached $5.08 trillion for the third quarter of 2025, according to the Federal Reserve’s G.19 Consumer Credit Report. This is an increase of 2.72% at a seasonally adjusted annual rate (SAAR) compared to the previous quarter, and a 2.25% increase compared to last year.  

Nonrevolving Credit  

Nonrevolving credit, largely driven by student and auto loans (the G.19 report excludes mortgage loans), reached $3.77 trillion (SA) in the third quarter of 2025. This marks a 2.95% increase (SAAR) from the previous quarter, and a 2.14% increase from last year. 

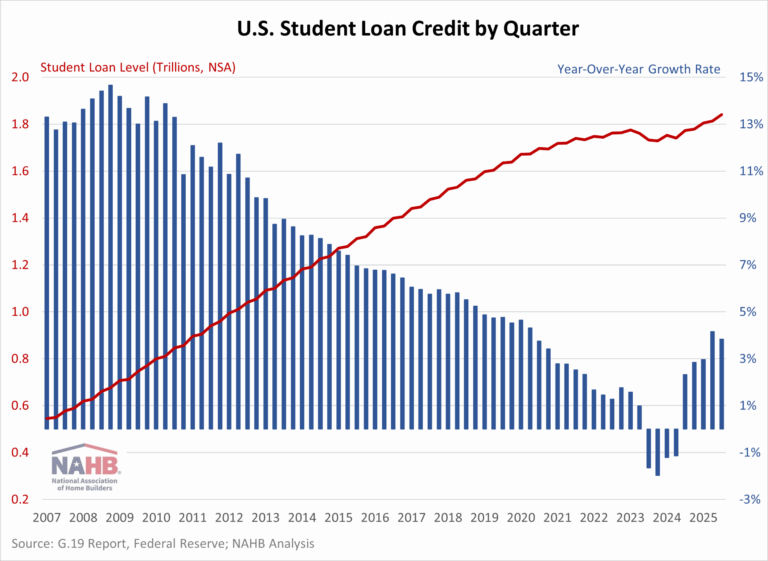
Student loan debt stood at $1.84 trillion (NSA) for the third quarter of 2025, marking a 3.84% increase from a year ago. The end of the COVID-19 Emergency Relief—which allowed 0% interest and halted payments until September 1, 2023—led year-over-year growth to decline for four consecutive quarters, from Q3 2023 through Q2 2024 as borrowers resumed payments and took on less new debt. The past five quarters have shown a return to growth, nearly matching pre-pandemic growth rates.  

Auto loans reached a level of $1.57 trillion (NSA), showing a year-over-year increase of only 0.30%, marking one of the slowest growth rates since 2010. The deceleration in growth can be attributed to several factors, including stricter lending standards, elevated interest rates, and overall inflation. Auto loan rates for a 60-month new car stood at 7.64% (NSA) for the third quarter of 2025, a historically elevated level. However, auto rates have slowed modestly, decreasing by 0.76 percentage points compared to a year ago.  

Revolving Credit 

Revolving credit, primarily made up of credit card debt, rose to $1.31 trillion (SA) in the third quarter of 2025. This represents a 2.04% increase (SAAR) from the previous quarter and a 2.55% increase year-over-year. Both measures reflect a notable slowdown, marking some of the weakest growth in revolving credit in several years. This deceleration comes as credit card interest rates remain elevated, with the average rate held by commercial banks (NSA) at 21.39%. Although rates have hovered near historic highs since Q4 2022, the past three quarters have shown modest year-over-year declines, reflecting the impact of rate cuts that began in 2024. 


This article was originally published by a eyeonhousing.org . Read the Original article here. .


Overall consumer credit continued to rise in 2025, but the pace of growth remains slow. Student loan balances also rose year-over-year as borrowers resumed payments following the end of pandemic-era relief. Meanwhile, credit card and auto loan debt both experienced their slowest annual growth rates in years. Despite historically high interest rates, credit card and auto loan rates have eased slightly, providing some relief for consumers facing elevated borrowing costs.

Total outstanding U.S. consumer credit reached $5.05 trillion for the second quarter of 2025, according to the Federal Reserve’s G.19 Consumer Credit Report. This is an increase of 2.32% at a seasonally adjusted annual rate (SAAR) compared to the previous quarter, and a 2.09% increase compared to last year. Both rates have increased from last quarter.

Nonrevolving Credit

Nonrevolving credit, largely driven by student and auto loans (the G.19 report excludes mortgage loans), reached $3.76 trillion (SA) in the second quarter of 2025. This marks a 2.90% increase (SAAR) from the previous quarter, and a 1.94% increase from last year.

Student loan debt stood at $1.81 trillion (NSA) for the second quarter of 2025, marking a 4.16% increase from a year ago. The end of the COVID-19 Emergency Relief—which allowed 0% interest and halted payments until September 1, 2023—led year-over-year growth to decline for four consecutive quarters, from Q3 2023 through Q2 2024 as borrowers resumed payments and took on less new debt. The past four quarters have shown a return to growth, nearly matching pre-pandemic growth rates.

Auto loans reached a level of $1.56 trillion (NSA), showing a year-over-year increase of only 0.31%, marking the slowest growth rate since 2010. The deceleration in growth can be attributed to several factors, including stricter lending standards, elevated interest rates, and overall inflation. Auto loan rates for a 60-month new car stood at 7.67% (NSA) for the second quarter of 2025, a historically elevated level. However, auto rates have slowed modestly, decreasing by 0.53 percentage points compared to a year ago.

Revolving Credit

Revolving credit, primarily made up of credit card debt, rose to $1.30 trillion (SA) in the second quarter of 2025. This represents a 0.66% increase (SAAR) from the previous quarter and a 2.54% increase year-over-year. Both measures reflect a notable slowdown, marking the weakest growth in revolving credit in several years. This deceleration comes as credit card interest rates remain elevated, with the average rate held by commercial banks (NSA) at 21.16%. Although rates have hovered near historic hi­ghs since Q4 2022, the past two quarters have shown modest year-over-year declines, reflecting the impact of rate cuts that began in 2024.

Discover more from Eye On Housing

Subscribe to get the latest posts sent to your email.


This article was originally published by a eyeonhousing.org . Read the Original article here. .


Credit conditions for builders and developers eased in the first quarter of 2025 as the level of outstanding 1-4 family residential construction loans rose for the first time in two years, according to data released by FDIC. While the volume of 1-4 family residential construction loans rose, a drop in other real estate development loans offset the increase, resulting in the fifth straight quarterly decline in the total volume of outstanding acquisition, development, and construction loans.

In the first quarter of 2025, the total level of outstanding acquisition, development, and construction loans fell to $478.3 billion, down 4.1% from a year ago. This was driven by the drop in other real estate development loans, which fell to $388.2 billion, down 3.8% compared to the a year ago. The volume of 1-4 family residential construction and land development loans totaled $90.0 billion in the first quarter, down 5.2% from a year ago. On a quarterly basis, this volume is up 0.6% from $89.5 billion one quarter ago.

It is worth noting, the FDIC data represent only the stock of loans, not changes in the underlying flows, so it is an imperfect data source. Nonetheless, lending remains much reduced from years past. The current amount of existing 1-4 family residential AD&C loans now stands 56% lower than the peak level of residential construction lending of $204 billion reached during the first quarter of 2008. Alternative sources of financing, including equity partners, have supplemented this capital market in recent years.

Quality Metrics of Construction Loans

Along with the volume increase of 1-4 family residential construction loans, the share of the volume that is 30+ days past due or nonaccrual status grew in the first quarter. The total level of past due and nonaccrual loans was $1.2 billion, up 24.4% from $978.4 million a year ago. As a share of the total 1-4 family residential construction loan volume, this accounts for only 1.4% but is notably the highest share since 2015.

Discover more from Eye On Housing

Subscribe to get the latest posts sent to your email.


This article was originally published by a eyeonhousing.org . Read the Original article here. .


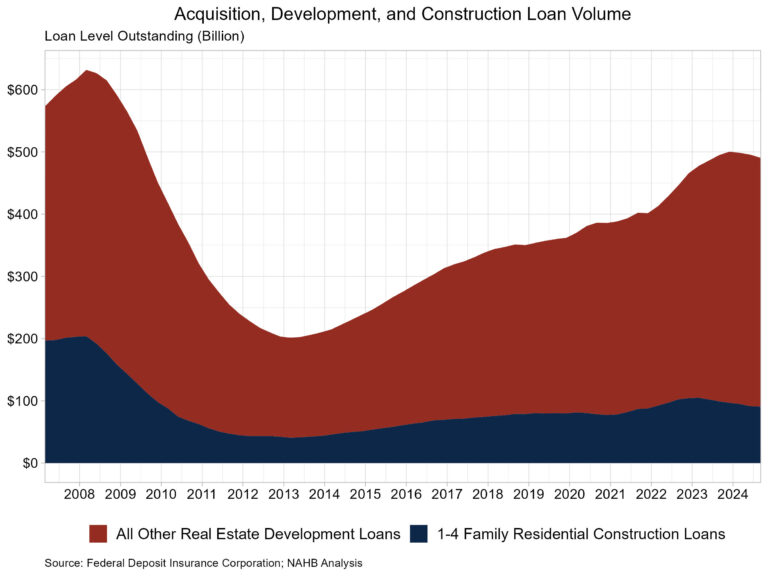
The total volume of outstanding acquisition, development, and construction (AD&C) loans made by FDIC-insured institutions fell for the third consecutive quarter during the third quarter of 2024 to a volume of $490.7 billion, down from $495.8 billion in the second quarter. Interest rates remained higher over the third quarter, as the Fed issued its first rate cut at the end of the quarter in September. Future AD&C lending conditions are poised to improve as the Fed continues its easing cycle over the next year despite potential headwinds of higher Government deficits and economic uncertainty.

The volume of 1-4 family residential construction and land development loans totaled $90.8 billion in the third quarter, down 8.4% from one year ago. This year-over-year decline marked the fifth straight quarter where the total volume of outstanding loans declined compared to a year prior. All other real estate development loans totaled $399.9 billion in the third quarter, down $4.3 billion from the previous quarter.

It is worth noting, the FDIC data represent only the stock of loans, not changes in the underlying flows, so it is an imperfect data source. Lending remains much reduced from years past. The current amount of existing 1-4 family residential AD&C loans now stands 55% lower than the peak level of residential construction lending of $204 billion reached during the first quarter of 2008. Alternative sources of financing, including equity partners, have supplemented this capital market in recent years.

While the volume of 1-4 family residential AD&C loans fell during the third quarter, the volume of past due and nonaccrual residential AD&C loans rose above $1 billion for the first time since 2014. A majority of this outstanding total was made up of loans in nonaccrual status (typically a loan where the lender does not expect to receive payment) which totaled $505.9 million. The outstanding loan balance for those 30-89 days past due was $491.5 million and loans 90 days or more past due totaled $65.4 million. As a share of the total outstanding stock of 1-4 family residential AD&C loans ($90.8 billion), past due and nonaccrual loans ($1.0 billion) made up 1.2% of the outstanding stock of loans.

Discover more from Eye On Housing

Subscribe to get the latest posts sent to your email.


This article was originally published by a eyeonhousing.org . Read the Original article here. .


Residential improvement spending softened in 2023 due to elevated interest rates, high inflation, and sluggish home sales. According to the Bureau of Economic Analysis’ National Income and Product Accounts (NIPA), expenditures for residential home improvements rose 2% to $363 billion in 2023, from $356 billion in 2022. The 2% year-over-year (YOY) gain in 2023 marks the smallest YOY gain since 2011. This annual data indicates that the YOY gain in residential improvement spending slowed, but the remodeling market remained solid.

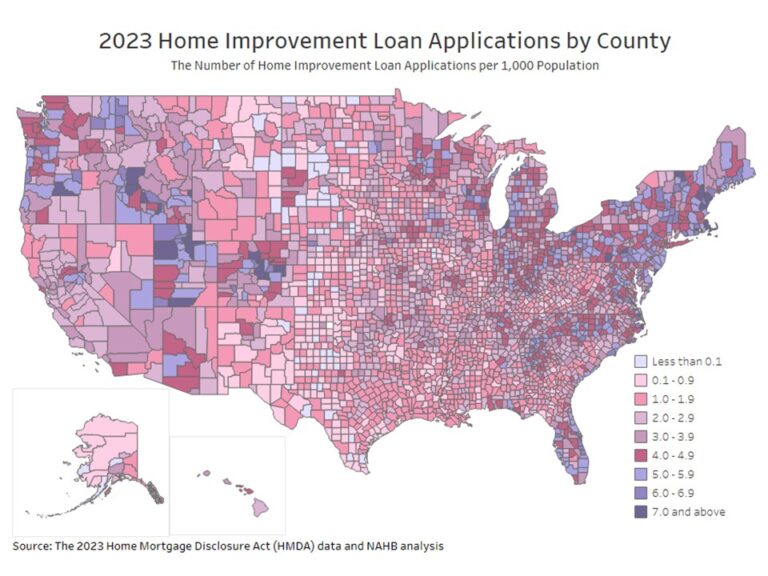
In this article, NAHB’s analysis of the 2023 Home Mortgage Disclosure Act (HMDA) data provides insight into remodeling activity in 2023 by age group, and by U.S. states and counties. The 2023 HMDA data, published by the Consumer Financial Protection Bureau (CFPB), covers detailed information on residential mortgage lending in 2023, including the type, purpose, and characteristics of home mortgage applications or purchased loans, and demographic and other information about loan applicants.

According to the 2023 HMDA data, the number of home improvement loan applications declined by 17% in 2023, compared to the previous year. Moreover, the total amount of home improvement loans was about 44 billion (24%) less than the total amount in 2022.

Age Group Analysis:

Figure 1 below presents the number of home improvement loan applications by applicants’ age from 2018 to 2023. Among all age groups, the number of home improvement loan applications surged in 2022 and declined in 2023. Compared to 2022, the number of home improvement loan applications decreased by 23% in 2023 for applicants aged between 25 and 34 and between 35 and 40. Applicants between the ages of 45 and 54 remained the largest age group to apply for home improvement loan applications, even though the number of loan applications for this age group reduced by 18% in 2023.

For applicants under 55 years old and above 74 years old, the number of loan applications in 2023 was higher than the pre-pandemic level in 2018 and 2019. Meanwhile, applicants aged between 55 and 74 had a lower number of loan applications in 2023 than in 2018 and 2019. As interest rates reached historically high levels in 2023, homeowners used savings to pay for home improvements, avoiding the extra expense of interest on loans.

State-Level Analysis:

While remodeling activity changed among different age groups, remodeling has also varied across geographic locations due to the cost of living, local economic conditions, and house prices.

With respect to total home improvement loan applications, California had the highest number of home improvement loan applications in 2023, with 118,649 applications. Florida came in second with 102,746 home improvement loan applications. Wyoming and Alaska had the lowest total numbers of home improvement loan applications with 1,312 and 1,358, respectively.

When we look at home improvement loan applications per 1,000 population, two states in New England, Rhode Island and New Hampshire, had the highest number of home improvement loan applications, with a rate of 6.4 and 6.0 applications per 1,000 population, respectively. Louisiana had the lowest number of home improvement loan applications, with a rate of 1.6 applications per 1,000 population.

In total, there were 3.7 loan applications for home improvements for every 1,000 population in the United States. California, the most populous state of the United States, reported 3.0 applications per 1,000 population, which is lower than the national average rate.

County-Level Analysis:

The analysis of county-level home improvement loan applications per 1,000 population reveals that the aggregate market population is not significantly related to the number of per capita home improvement loan applications. In 2023, the top 10 most populated counties in the United States had an average rate of 2.6 loan applications per 1,000 population. Los Angeles County in California, one of the most populous counties, reported a rate of 2.8 loan applications per 1,000 population in 2023.  Meanwhile, some counties with a lower population had a higher loan application rate (that is, the number of home improvement loan applications per 1,000 population). For example, Nantucket County in Massachusetts, with a population of about 14,000, had the highest loan application rate of 11.1 among all the counties in the United States. Camas County in Idaho, with roughly one thousand population, had a loan application rate of 8.9, higher than about 99.7% of the counties in the United States.

Additionally, the analysis finds that home improvement loan applications are relatively more common in the Mountain and New England Divisions. In total, there were 43 counties that reported 7 or higher home improvement loan applications per 1,000 population, and more than 72% of these counties were in the Mountain and New England Divisions. None of these 43 counties were in the West South Central, East South Central, or West North Central Divisions. The top five counties with the highest home improvement loan application rate were: Nantucket County (MA), Grand Isle County (VT), Dare County (NC), Boise County (ID), and Barnstable County (MA).

Discover more from Eye On Housing

Subscribe to get the latest posts sent to your email.


This article was originally published by a eyeonhousing.org . Read the Original article here. .


Total outstanding US consumer debt stood at $5.08 trillion for the first quarter of 2024, increasing at an annualized rate of 2.46% (seasonally adjusted), according to the Federal Reserve’s G.19 Consumer Credit Report. From the second quarter of 2023 to the second quarter of 2024, the total increased by 1.84%. This year-over-year (YoY) growth rate is the lowest observed since the first quarter of 2021.

Nonrevolving and Revolving Debt

Of the total outstanding US debt in the first quarter of 2024, the nonrevolving share is 74%, with revolving at 26%. Nonrevolving debt (primarily student and auto loans) stands at $3.73 trillion (SA) for the second quarter of 2024. Revolving debt (mainly credit card debt) stands at $1.34 trillion.

The pace of growth has slowed for both nonrevolving and revolving debt as households’ pandemic-era savings have dwindled. In terms of YoY growth, both nonrevolving and revolving debt peaked in the fourth quarter of 2022 at 15.10% and 5.34% respectively. In the second quarter of 2024, the YoY growth rate for nonrevolving debt decreased to 6.12%, from 7.99% in the first quarter, while the growth rate for revolving debt increased from 0.14% to 0.39%. This was the sixth consecutive quarterly decline in YoY growth for nonrevolving debt while revolving debt saw its first uptick in the YoY rate in five quarters.

Student and Auto Loans

Breaking down the components of nonrevolving debt, student loans account for 47%, and auto loans make up 42% (the G.19 report excludes real estate loans). Collectively, the other loans make up the remaining 11% of nonrevolving debt.

Student loans in the second quarter of 2024 totaled $1.74 trillion (non-seasonally adjusted), marking the fourth consecutive decrease in the YoY rate at -0.96%, following an annual decrease of -1.22% in the previous quarter. The third quarter of 2023 marked the first YoY decrease for student loan debt since the data was first reported.

Auto loan debt for the second quarter of 2024 was $1.57 trillion (NSA). Auto loan YoY growth has steadily decelerated over the past six quarters. The fourth quarter of 2021 saw a high of 13.74% YoY growth compared to the second quarter of 2024 YoY growth rate of 1.95%. This slowdown partially reflects the relatively high interest rate on auto loans, which have increased from 4.52% in Q1 2022 to 8.20% in Q2 2024 (60-month new car loans). However, this car loan rate experienced its first (albeit slight) decline in over two years, falling from 8.22% in the previous quarter.

Credit Cards

The interest rate on credit cards saw its first decrease since the fourth quarter of 2021.  The interest rate for the second quarter of 2024 was 21.51%, falling from 21.59% in the previous quarter. Before this quarter, the rate experienced nine consecutive quarterly increases, with a dramatic increase of 2.8 percentage points from Q3 2022 to Q4 2022. This aligns closely with the Federal Funds Effective Rate increasing 1.47 percentage points during the same period, the highest increase since the 1980s.

Discover more from Eye On Housing

Subscribe to get the latest posts sent to your email.


This article was originally published by a eyeonhousing.org . Read the Original article here. .

Pin It