Tag

Increase

Browsing


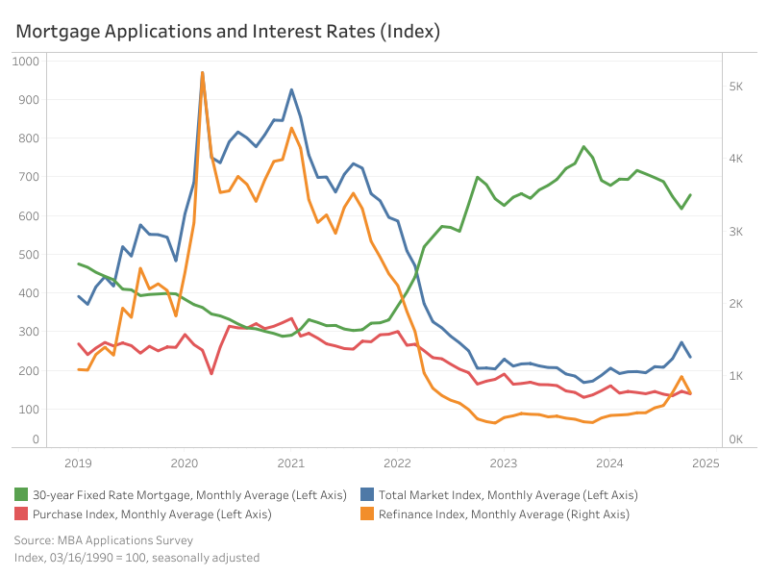
Mortgage rates continued their upward trend in May due to market volatility triggered by fiscal concerns and weaker U.S. Treasury demand. According to Freddie Mac, the average 30-year fixed-rate mortgage rose to 6.82% — a 9-basis-point (bps) increase from April. The 15-year fixed-rate mortgage increased by 5 bps to 5.95%.

The 10-year Treasury yield, a benchmark for mortgage rates, averaged 4.38% in May, with the most recent weekly yield surpassing 4.50%. Long-term treasury yields spiked following two events: first, a credit rating downgrade by Moody’s Ratings, and then, a tepid auction of the 20-year treasury. The weak demand for long-term government bonds necessitated a higher yield to attract investors.

At the core of the market unease is concern over the growing fiscal deficit that intensified as the new “One Big Beautiful Bill” threatens to further widen the federal deficit, which stood at $1.9 trillion as of January 2025. The combination of weakening fiscal credibility and poor auction performance suggests a possible upward repricing of long-term borrowing costs.

Discover more from Eye On Housing

Subscribe to get the latest posts sent to your email.


This article was originally published by a eyeonhousing.org . Read the Original article here. .


Mortgage loan applications saw little change in April, as refinancing activity decreased. The Market Composite Index, which measures mortgage loan application volume based on the Mortgage Bankers Association (MBA) weekly survey, experienced a 0.4% month-over month increase on a seasonally adjusted (SA) basis. However, year-over-year, the index is up 29.3% compared to April 2024.

The average rate for a 30-year fixed mortgage climbed 10 basis points in April, reaching 6.8%, according to the MBA survey. As rates edged higher, purchase activity posted a modest 1.9% month-over-month gain (SA), while the Refinance Index declined by 1.4% (SA). Compared to a year ago, mortgage rates are down 37 bps, and thus, purchase applications are higher by 11.2%, while refinance activity has jumped 62.0%.

Loan sizes remained relatively stable. In April, the average loan size across the total market (including purchases and refinances) held steady at $403,500, month-over-month, on a non-seasonally adjusted basis (NSA). Purchase loans sizes edged down 1.3% to $444,000, while refinance loan sizes increased 0.5% to $339,300. Notably, the average loan size for adjustable-rate mortgages (ARMs) fell 7.8%, from $1.14 million to $1.05 million.

Discover more from Eye On Housing

Subscribe to get the latest posts sent to your email.


This article was originally published by a eyeonhousing.org . Read the Original article here. .


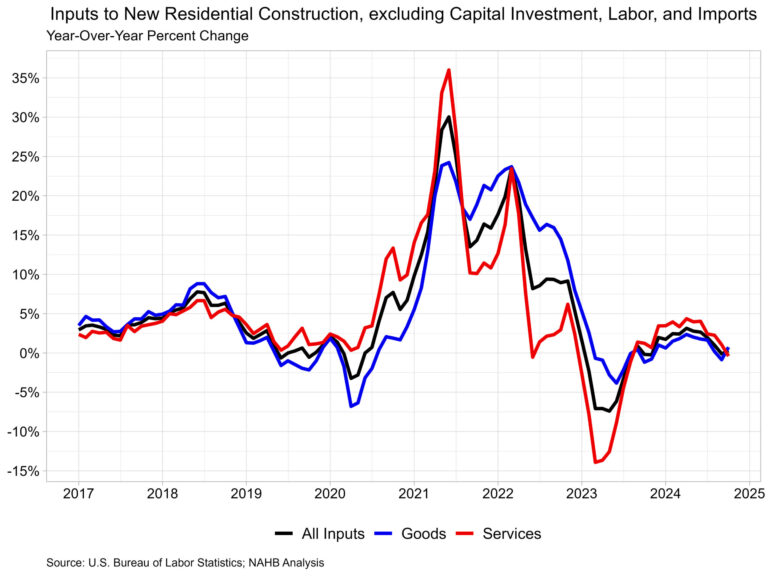
Prices for inputs to new residential construction—excluding capital investment, labor, and imports—were up 1.2% in January according to the most recent Producer Price Index (PPI) report published by the U.S. Bureau of Labor Statistics. The Producer Price Index measures prices that domestic producers receive for their goods and services, this differs from the Consumer Price Index which measures what consumers pay and includes both domestic products as well as imports.

The inputs to the New Residential Construction Price Index grew 1.1% from January of last year. The index can be broken into two components—the goods component increased 2.1% over the year, while services decreased 0.3%. For comparison, the total final demand index, which measures all goods and services across the economy, increased 3.5% over the year, with final demand with respect to goods up 2.3% and final demand for services up 4.1% over the year.

Input Goods

The goods component has a larger importance to the total residential construction inputs price index, representing around 60%. For the month, the price of input goods to new residential construction was up 1.6% in January. Monthly growth of the index was relatively low in the past two years, as this monthly increase was the largest since March of 2022 (3.3%).

The input goods to residential construction index can be further broken down into two separate components, one measuring energy inputs with the other measuring goods less energy inputs. The latter of these two components simply represents building materials used in residential construction, which makes up around 93% of the goods index.

The 2.1% yearly growth in the goods component can be attributed to the rise in the prices of building materials, which grew 2.3% over the year. Meanwhile, the price of energy inputs was 1.6% lower than last year. Between December and January, building materials increased 1.4%, while energy inputs increased 4.3%.

At the individual commodity level, the five commodities with the highest importance for building materials to the New Residential Construction Index were as follows: ready-mix concrete, general millwork, paving mixtures/blocks, sheet metal products, and wood office furniture/store fixtures. Compared to last year, ready-mix concrete was up 4.1%, wood office furniture/store fixtures up 4.7%, general millwork up 2.4%, paving mixtures/blocks up 8.6% while sheet metal products were up 0.4%.

For January, the commodity used in new residential construction that featured the highest price growth was an energy input, home heating oil and distillates, increasing 16.0%. The non-energy input that had the highest monthly price growth was paving mixtures and blocks, up 14.8%. This is likely a pass-through of increases in asphalt prices, which were up 6.9% in January.

Input Services

While prices of inputs to residential construction for services were down 0.3% over the year, they were up 0.5% in January from December. The price index for service inputs to residential construction can be broken out into three separate components: a trade services component, a transportation and warehousing services component, and a services excluding trade, transportation and warehousing component. The most significant component is trade services (around 60%), followed by services less trade, transportation and warehousing (around 29%), and finally transportation and warehousing services (around 11%). The largest component, trade services, was down 1.9% from a year ago. The services less trade, transportation and warehousing component was up 1.6% over the year.   Lastly, prices for transportation and warehousing services advanced 3.1% compared to January last year, the largest year-over-year increase since January of 2023.

Discover more from Eye On Housing

Subscribe to get the latest posts sent to your email.


This article was originally published by a eyeonhousing.org . Read the Original article here. .


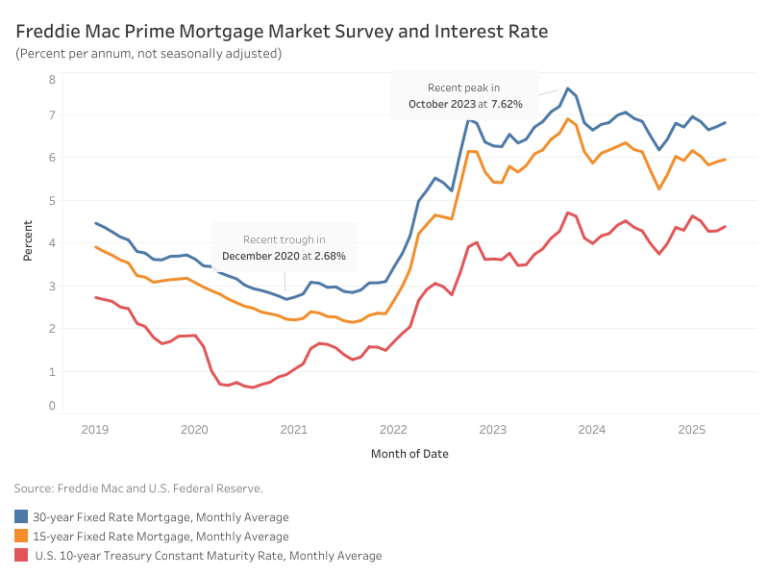
The Market Composite Index, a measure of mortgage loan application volume from the Mortgage Bankers Association’s (MBA) weekly survey, increased by 3.1% month-over-month on a seasonally adjusted (SA) basis, primarily driven by purchasing activity. Compared to January last year, the index is higher by 3.4%. The Market Composite Index which includes the Purchase and Refinance Indices: purchasing experienced a monthly gain of 3.8%, while refinancing decreased 2.3% (SA). On a year-over-year basis, however, the Purchase Index is lower by 3.4%, while the Refinance Index remains higher at 18.6%.

The average 30-year fixed rate mortgage reported in the MBA survey for January ticked up 20 basis points (bps) to 7.02% (index level 702). This rate is 24 basis points higher than the same period last year.

Average loan size (purchases and refinances combined) increased slightly by 0.8% on a non-seasonally adjusted (NSA) basis from December to $373,200. For purchase loans, the average size increased by 1.8% to $429,400, while refinance loans experienced a 5.4% decrease, reaching an average of $288,200. Adjustable-rate mortgages (ARMs) saw a continued decline in average loan size for three consecutive months, down 0.6% from $1.074 million to $1.068 million.

Discover more from Eye On Housing

Subscribe to get the latest posts sent to your email.


This article was originally published by a eyeonhousing.org . Read the Original article here. .


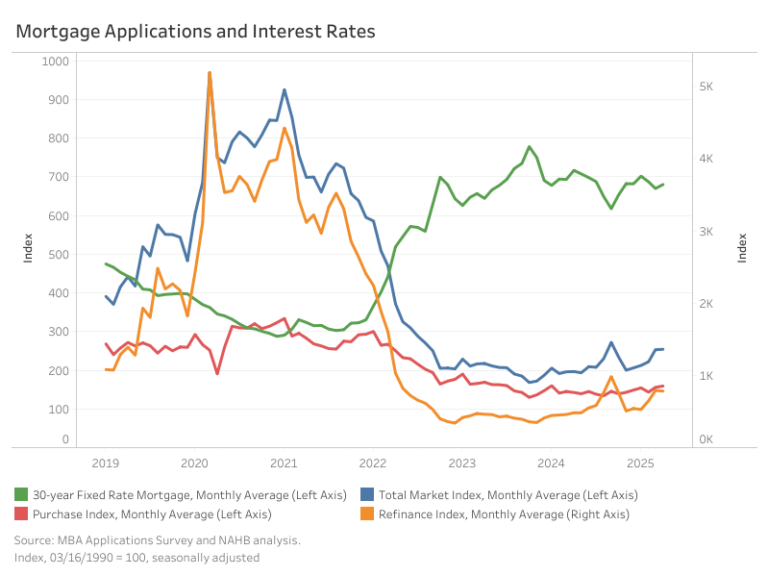
The Market Composite Index, a measure of mortgage loan application volume from the Mortgage Bankers Association’s (MBA) weekly survey, increase marginally by 2.9% month-over-month on a seasonally adjusted (SA) basis. Compared to December 2023, the index is higher by 10.2%. The Market Composite Index includes the Purchase and Refinance Indices, which saw monthly gains of 4.1% and 6.7% (SA), respectively. On a year-over-year basis, the Purchase Index showed a modest increase of 1.1%, while the Refinance Index is 31.7% higher.

The average 30-year fixed rate mortgage reported in the MBA survey for December remained relatively stable at 6.82% (index level 682), reflecting a minor decline of 0.4 basis points. This rate is 9 basis points lower than the same period last year.

Average loan sizes, excluding refinance loans, saw slight declines in December. On a non-seasonally adjusted (NSA) basis, the average loan size (purchases and refinances combined) fell by 2.1% from November to $370,300. For purchase loans, the average size decreased by 3.3% to $421,800, while refinance loans experienced a 4.8% increase, reaching an average of $304,500. Adjustable-rate mortgages (ARMs) also saw a marginal decline in loan size, down 0.8% from $1.08 million to $1.07 million.

Discover more from Eye On Housing

Subscribe to get the latest posts sent to your email.


This article was originally published by a eyeonhousing.org . Read the Original article here. .


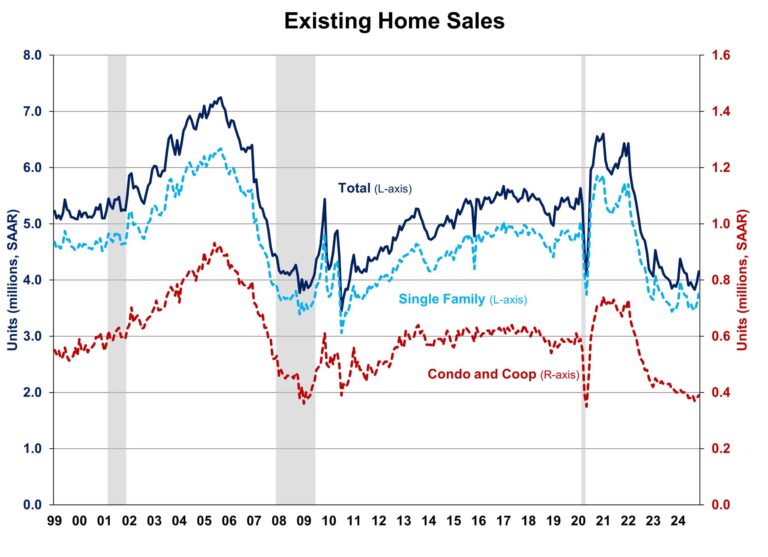
Despite higher mortgage rates and elevated home prices, existing home sales jumped to an 8-month high in November, marking the second month of annual increase in more than three years, according to the National Association of Realtors (NAR).

While inventory improves and the Fed continues lowering rates, the market faces headwinds as mortgage rates are expected to stay above 6% for longer due to an anticipated slower easing pace in 2025. The prolonged rates may continue to discourage homeowners from trading existing mortgages for new ones with higher rates, keeping supply tight and prices elevated. However, as mortgage rates continue trending lower, the gradual improvement in inventory should help slow home price growth and enhance affordability. As such, the recent gains for existing home sales may give way in the coming months of data.

Total existing home sales, including single-family homes, townhomes, condominiums, and co-ops, rose 4.8% to a seasonally adjusted annual rate of 4.15 million in November, the highest level since March 2024. On a year-over-year basis, sales were 6.1% higher than a year ago, the largest annual gain since June 2021.

The first-time buyer share rose to 30% in November, up from 27% in October but down from 31% in November 2023.

The existing home inventory level fell from 1.37 million in October to 1.33 million units in November but is up 17.7% from a year ago. At the current sales rate, November unsold inventory sits at a 3.8-months supply, down from 4.2-months last month but up 3.5-months a year ago. This inventory level remains low compared to balanced market conditions (4.5 to 6 months’ supply) and illustrates the long-run need for more home construction.

Homes stayed on the market for an average of 32 days in November, up from 29 days in October and 25 days in November 2023.

The November all-cash sales share was 25% of transactions, down from 27% experienced in both October 2024 and November 2023. All-cash buyers are less affected by changes in interest rates.

The November median sales price of all existing homes was $406,100, up 4.7% from last year. This marked the 17th consecutive month of year-over-year increases. The median condominium/co-op price in November was up 2.8% from a year ago at $359,800. This rate of price growth will slow as inventory increases.

Geographically, three of four regions saw an increase in existing home sales in November, ranging from 5.3% in the Midwest to 8.5% in the Northeast. Sales in the West stayed unchanged in November. On a year-over-year basis, sales grew in all four regions, ranging from 3.3% in the South to 14.9% in the West.

The Pending Home Sales Index (PHSI) is a forward-looking indicator based on signed contracts. The PHSI rose from 75.9 to 77.4 in October due to improved inventory. On a year-over-year basis, pending sales were 5.4% higher than a year ago per National Association of Realtors data.

Discover more from Eye On Housing

Subscribe to get the latest posts sent to your email.


This article was originally published by a eyeonhousing.org . Read the Original article here. .


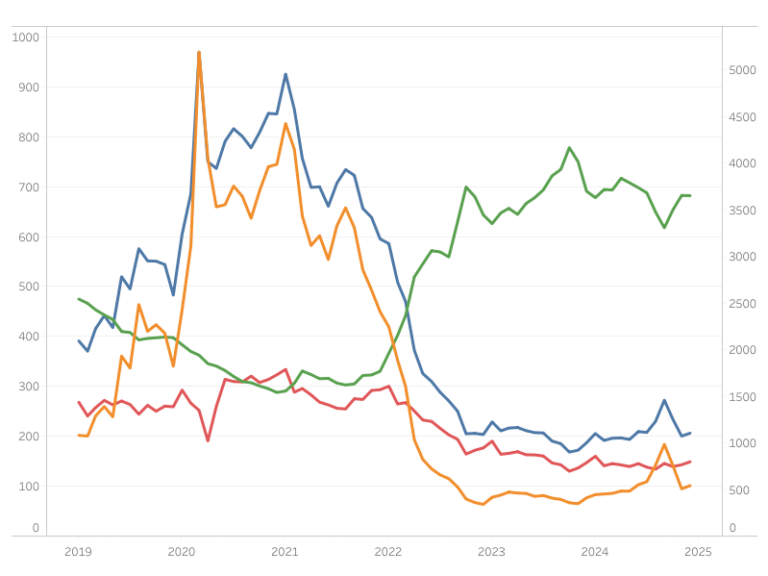
The Market Composite Index, a measure of mortgage loan application volume by the Mortgage Bankers Association’s (MBA) weekly survey, decreased 14.5%, month-over-month, in November on a seasonally adjusted (SA) basis. The slowdown in mortgage activity can be attributed to higher mortgage rates as the ten-year Treasury yield increased in November, reflecting uncertainties surrounding the elections.

The market decline was reflected primarily in the Refinance Index (SA), which decreased by 33.2% month-over-month. Meanwhile, the Purchase Index (SA) showed a modest increase of 2.7% over the same period. However, compared to October 2023, the Market Composite Index is up by 16.4%, with the Purchase Index seeing a slight 4.8% increase and the Refinance Index higher by 45.9%.

The average contract rate for 30-year fixed mortgage rate per the MBA survey for November averaged at 6.8%, 29 basis points (bps) higher month-over-month in response to a higher ten-year Treasury rate.

Loan size metrics also reflected market adjustments. The average loan size for the total market (including purchases and refinances) shrank 2.9% month-over-month on a non-seasonally adjusted (NSA) basis, decreasing from $389,800 to $378,400. Loan sizes for purchasing and refinancing decreased. Purchase loans averaged $436,200, down 2.7% from $448,300, while refinance loans saw a sharper 9.9% decrease, with the average loan size falling from $322,500 to $290,600. Adjustable-rate mortgages (ARMs) also declined 6.0%, from $1.15 million to $1.08 million.

Discover more from Eye On Housing

Subscribe to get the latest posts sent to your email.


This article was originally published by a eyeonhousing.org . Read the Original article here. .


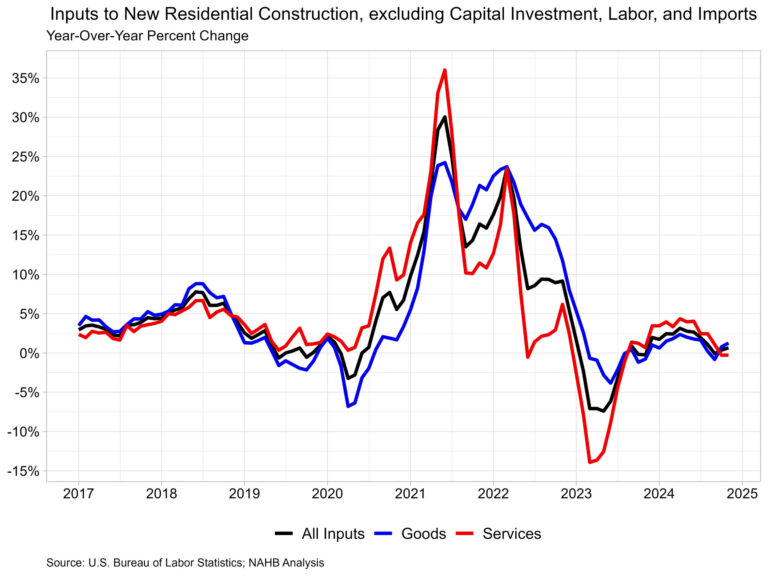
Prices for inputs to new residential construction—excluding capital investment, labor, and imports—were unchanged in November according to the most recent Producer Price Index (PPI) report published by the U.S. Bureau of Labor Statistics. Compared to a year ago, this index was up 0.7% in November after rising 0.3% in October.

The inputs to the new residential construction price index can be broken into two components­—one for goods and another for services. The goods component increased 1.2% over the year, while services decreased 0.3%. For comparison, the total final demand index increased 3.0% over the year in November, with final demand with respect to goods up 1.1% and final demand for services up 3.9% over the year.

Goods

The goods component has a larger importance to the total residential construction inputs price index, representing around 60%. The price of input goods to new residential construction was unchanged in November from October. The input goods to residential construction index can be further broken down into two separate components, one measuring energy inputs with the other measuring goods less energy inputs. The latter of these two components simply represents building materials used in residential construction, which makes up around 93% of the goods index.

Prices for inputs to residential construction, goods less energy, were up 2.3% in November compared to a year ago. This year-over-year increase was larger than in October (2.0%) and was the largest year-over-year increase since June earlier this year. The growth rate in November 2023 was 1.2%. The index for inputs to residential construction for energy fell 10.9% year-over-year in November, the fourth straight yearly decline in input energy prices.  

The graph below focuses on the data since the start of 2023 for residential goods inputs. Energy prices have continued to fall over the past year, with only two periods of growth in 2024.

At the individual commodity level, excluding energy, the five commodities with the highest importance for building materials to the new residential construction index were as follows: ready-mix concrete, general millwork, paving mixtures/ blocks, sheet metal products, and wood office furniture/store fixtures. Across these commodities, there was price growth across the board compared to last year. Ready-mix concrete was up 3.9%, wood office furniture/store fixtures up 3.4%, general millwork up 2.8%, paving mixtures/blocks up 1.6% and sheet metal products up 0.5%. Unsurprisingly, given how energy prices have trended this year, the input commodity that had the largest fall in price over the year was No. 2 diesel, which was down 20.6%.

Among lumber and wood products, the commodities with the highest importance to new residential construction were general millwork, prefabricated structural members, softwood veneer/plywood, softwood lumber (not edge worked) and hardwood veneer/plywood. The input commodity in residential construction that had the highest year-over-year percent change (across all input goods) in November was softwood lumber (not edge worked), which was 13.7% higher than November 2023. This is of particular note because none of the other top wood commodities had a year-over-year change above 3% in November. Lumber supplies have been driving prices higher over the past month as the sawmill industry continues to adjust to the mill closures that occurred earlier this year. Higher lumber demand as residential construction rebounds due to lower interest rates is likely to continue to increase lumber prices.

Services

Prices of inputs to residential construction for services, were unchanged in November from October. The price index for service inputs to residential construction can be broken out into three separate components: a trade services component, a transportation and warehousing services component, and a services excluding trade, transportation and warehousing component. The most significant component is trade services (around 60%), followed by services less trade, transportation and warehousing (around 29%), and finally transportation and warehousing services (around 11%). The largest component, trade services, compared to last year was down 1.2% in November after declining 1.5% in October.

Discover more from Eye On Housing

Subscribe to get the latest posts sent to your email.


This article was originally published by a eyeonhousing.org . Read the Original article here. .


Prices for inputs to new residential construction—excluding capital investment, labor, and imports—decreased 0.2% in October according to the most recent Producer Price Index (PPI) report published by the U.S. Bureau of Labor Statistics. Compared to a year ago, this index is up 0.3% in October after a decline of 0.1% in September.

The inputs to the new residential construction price index can be broken into two components­—one for goods and another for services. The goods component increased 0.7% over the year, while services decreased 0.4%. For comparison, the total final demand index increased 2.4% over the year for October, with final demand with respect to goods up 0.2% and final demand for services up 3.5% over the year.

Input Goods

The goods component has a larger importance to the total residential construction inputs price index, representing around 60%. The price of input goods to new residential construction was up 0.3% in October from September. The input goods to residential construction index can be further broken down into two separate components, one measuring energy inputs with the other measuring goods less energy inputs. The latter of these two components simply represents building materials used in residential construction, which makes up around 93% of the goods index.

Prices for inputs to residential construction, goods less energy, were up 2.0% in October compared to a year ago. This year-over-year increase was larger than in September (1.4%) and was the first percentage point increase in the year-over-year rate since April. The growth rate in October 2023 was 0.8%. The index for inputs to residential construction for energy fell 13.1% year-over-year in October, the third straight yearly decline in input energy prices.

The graph below focuses on the data since the start of 2023 for residential goods inputs. Energy prices have continued to fall over the past year, with only two periods of growth in 2024.

At the individual commodity level, excluding energy, the five commodities with the highest importance for building materials to the new residential construction index were as follows: ready-mix concrete, general millwork, paving mixtures/ blocks, sheet metal products, and wood office furniture/store fixtures. Across these commodities, there was price growth across the board compared to last year. Ready-mix concrete was up 3.7%, wood office furniture/store fixtures up 3.6%, general millwork up 2.8%, paving mixtures/blocks up 2.4% and sheet metal products up 0.6%.

Input Services

Prices of inputs to residential construction for services fell 1.0% in October from September. The price index for service inputs to residential construction can be broken out into three separate components: a trade services component, a transportation and warehousing services component, and a services excluding trade, transportation and warehousing component. The most significant component is trade services (around 60%), followed by services less trade, transportation and warehousing (around 29%), and finally transportation and warehousing services (around 11%). The largest component, trade services, compared to last year was down 1.5% in October after increasing 0.6% in September. The decline in October was the first decline since August 2023, when the trade services index was down 1.2%.

Discover more from Eye On Housing

Subscribe to get the latest posts sent to your email.


This article was originally published by a eyeonhousing.org . Read the Original article here. .


The Market Composite Index, a measure of mortgage loan application volume by the Mortgage Bankers Association’s (MBA) weekly survey, decreased 13.9% month-over-month on a seasonally adjusted (SA) basis due to higher mortgage rates. This decline was reflected in both the Purchase and Refinance Indices, which fell by 4.4% and 23%, respectively. However, compared to October 2023, the Market Composite Index is up by 39%, with the Purchase Index seeing a slight 1.9% increase and the Refinance Index higher by 149.9%.

The average 30-year fixed mortgage rate reversed its downward trajectory with an increase of 36 basis points (bps), following volatility in the ten-year Treasury yield. This brought the rate back to around the same level as it was in August at 6.53%. However, compared to its peak last October, the current rate is 125 bps lower.

The average loan size for the total market (including purchases and refinances) was $390,225 on a non-seasonally adjusted (NSA) basis, a decrease of 2.6% from September. Purchase loans grew by 2.1% to an average of $448,675, while refinance loans declined by 11.3% to $323,750. Adjustable-rate mortgages (ARMs) saw a modest decrease of 3.4% in average loan size from $1.19 million to $1.15 million.

Discover more from Eye On Housing

Subscribe to get the latest posts sent to your email.


This article was originally published by a eyeonhousing.org . Read the Original article here. .

Pin It