Tag

Higher

Browsing


Private residential construction spending was up 1.5% for the last month of 2025. This modest gain was driven primarily by increased spending on home improvements and single-family construction. Despite this increase, total spending remained 1.3% lower than a year ago, reflecting the continued impact of housing affordability challenges facing the sector.

According to the latest construction spending data from the U.S. Census, single-family construction spending was up by 1.6% in December, consistent with the soft builder confidence reflected in the NAHB/Wells Fargo Housing Market Index (HMI). Compared to a year ago, single-family construction spending decreased 3.6%. Meanwhile, multifamily construction spending edged up 0.1% in December, marking a seventh consecutive month of modest gains. Compared to a year earlier, multifamily spending was 2.9% higher. Improvement spending (remodeling) rose 1.8% for the month but stayed flat relative to a year ago.

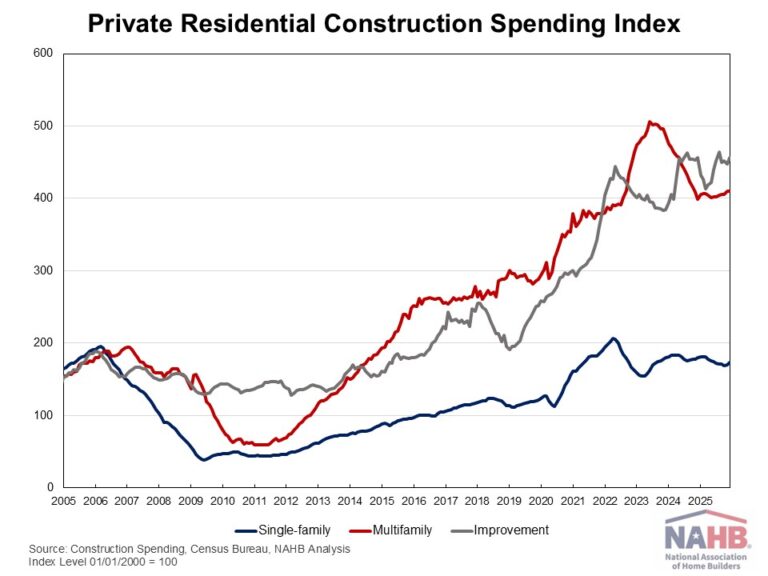
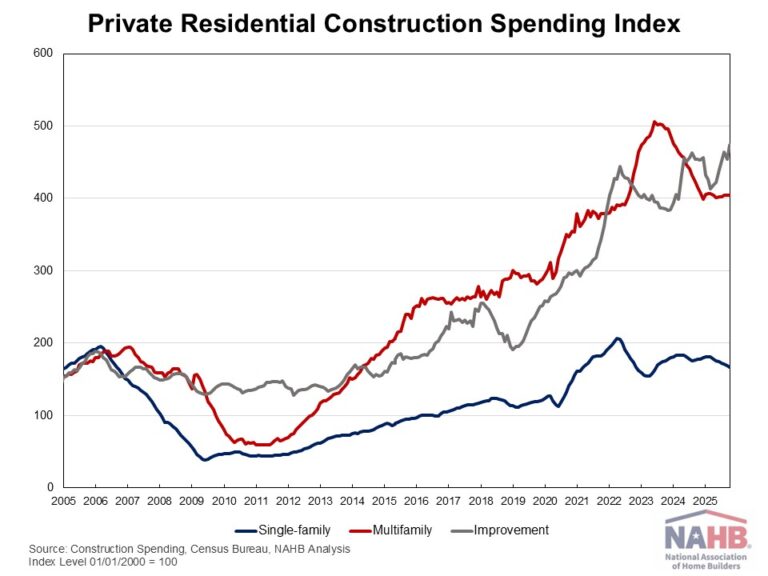
The NAHB construction spending index is shown in the graph below. The index illustrates how   spending on single-family construction has slowed since early 2024 under the pressure of elevated interest rates and concerns over building material tariffs. Multifamily construction spending growth has also slowed down after the peak in July 2023, with the index largely plateauing since late 2024. In contrast, improvement spending has been on an upward trend since the beginning of 2025.

Spending on private nonresidential construction was down 1.8% over a year ago. The annual private nonresidential spending decrease was primarily driven by a $26 billion drop in manufacturing construction spending, followed by a $2 billion decrease in healthcare construction spending.


This article was originally published by a eyeonhousing.org . Read the Original article here. .


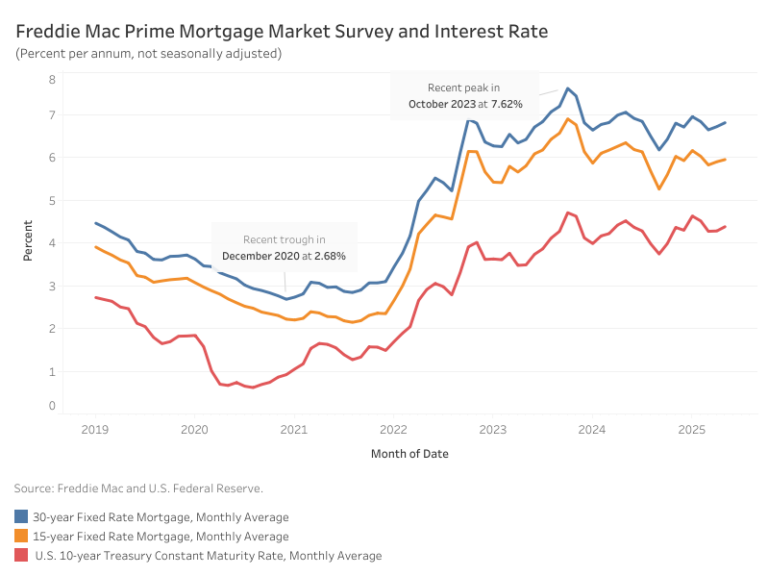
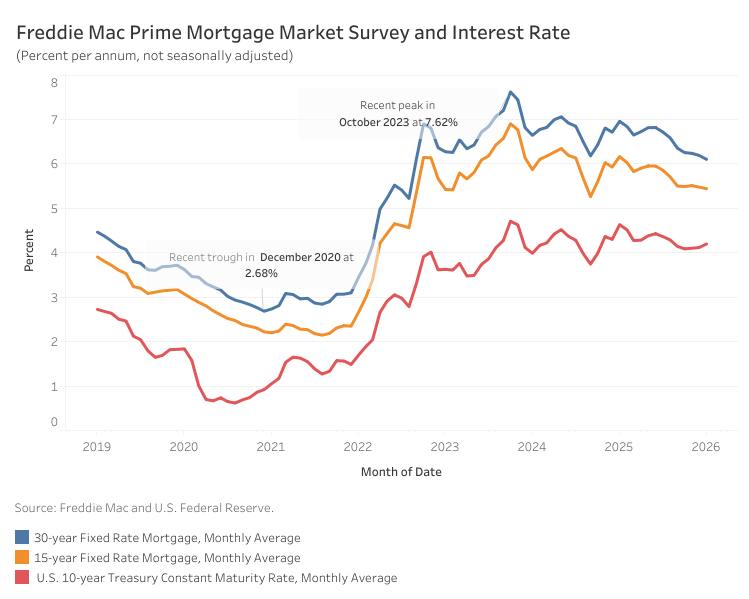
Long-term mortgage rates continued to decline in January. According to Freddie Mac, the 30-year fixed-rate mortgage averaged 6.10% last month, 9 basis points (bps) lower than December. Meanwhile, the 15-year rate declined 4 bps to 5.44%. Compared to a year ago, the 30-year rate is lower by 86 bps. The 15-year rate is also lower by 72 bps.

The 10-year Treasury yield, a key benchmark for long-term borrowing, averaged 4.20% in January – an increase of 8 bps from the previous month, but remained considerably lower than last year by 43 bps. While mortgage rates typically move in tandem with the treasury yields, the spread between the two narrowed during the month. Reports that the Trump administration encouraged Fannie Mae and Freddie Mac to expand purchases of mortgage-backed securities (MBS) boosted demand for MBS, pushing mortgage rates lower.

However, treasury yields rose sharply in the final week of January from global and fiscal pressures. The impact of the rift with Europe and the broader reduction of international purchases of U.S. Treasuries has left a measurable impact on U.S. interest rates. The 10-year Treasury rate at the beginning of 2026 was at 4.11%. That rate has now increased to 4.26%. This unfortunately means the beneficial impact of the $200 billion of additional acquisition of Fannie Mae and Freddie Mac MBS by those GSEs has been partially offset by international concerns.


This article was originally published by a eyeonhousing.org . Read the Original article here. .


Private residential construction spending was up 1.3% in October, rebounding from a 1.4% decline in September 2025. This modest gain was primarily driven by increased spending on home improvements. Despite this increase, total spending remained 1.3% lower than a year ago, as the housing sector continues to navigate the economic uncertainty stemming from ongoing tariff concerns and elevated mortgage rates.

According to the latest U.S. Census construction spending data, single-family construction spending declined 1.3% in October, consistent with the soft builder confidence reflected in the NAHB/Wells Fargo Housing Market Index (HMI). Compared to a year ago, single-family construction spending decreased by 6.1%. Meanwhile, multifamily construction spending edged down 0.2% in October after four consecutive months of modest gains. Compared to a year earlier, multifamily spending was still down 2.8%. Improvement spending (remodeling) rose 4.5% for the month and was up 4.4% compared to a year ago.

The NAHB construction spending index is shown in the graph below. The index illustrates how   spending on single-family construction has slowed since early 2024 under the pressure of elevated interest rates and concerns over building material tariffs. Multifamily construction spending growth has also slowed down after the peak in July 2023, with the index largely plateauing since late 2024. In contrast, improvement spending has been on an upward trend since the beginning of 2025.

Spending on private nonresidential construction was down 2.6% over a year ago. The annual private nonresidential spending decrease was primarily driven by a $23 billion drop in manufacturing construction spending, followed by a $3.8 billion decrease in commercial construction spending.


This article was originally published by a eyeonhousing.org . Read the Original article here. .


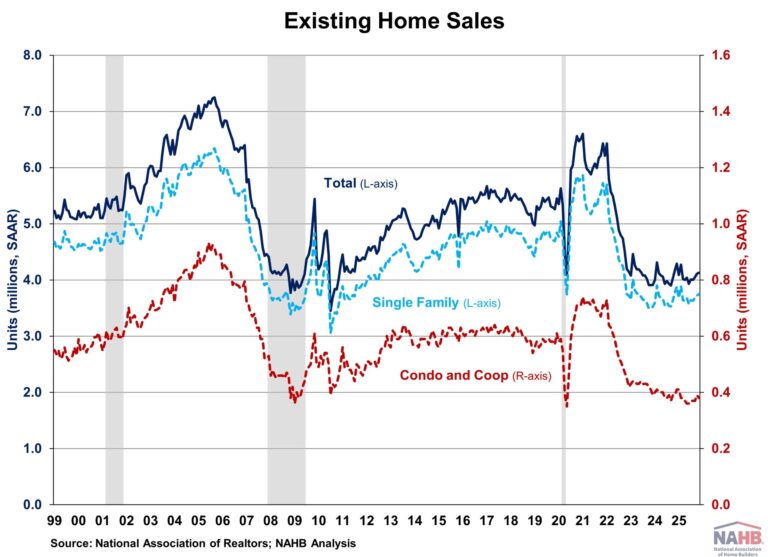
Existing home sales rose for the third consecutive month in November as lower mortgage rates continued to boost home sales, according to the National Association of Realtors (NAR). However, the increase remained modest as mortgage rates still stayed above 6% while down from recent highs. The weakening job market also weighed on buyer activity.

Meanwhile, inventory fell for the fourth consecutive month as homeowners with record-high housing wealth held back from listing properties. Relatively tight supply continued to push home prices higher and challenge housing affordability, even as wage growth outpaced home price gains.

Total existing home sales, including single-family homes, townhomes, condominiums, and co-ops, rose 0.5% to a seasonally adjusted annual rate of 4.13 million in November, the highest level since February. However, on a year-over-year basis, sales were 1.0% lower than a year ago.

The existing home inventory level was 1.43 million units in November, down 5.9% from October but up 7.5% from a year ago. At the current sales rate, November unsold inventory sits at a 4.2-months’ supply, down from 4.4-months in October but up from 3.8-months in November 2024. Inventory between 4.5 to 6 months’ supply is generally considered a balanced market.

Homes stayed on the market for a median of 36 days in November, up from 34 days last month and 32 days in November 2024.

The first-time buyer share was 30% in November, down from 32% in October but unchanged from a year ago.

The November all-cash sales share was 27% of transactions, down from 29% in October but up from 25% a year ago. All-cash buyers are less affected by changes in interest rates.

The November median sales price of all existing homes was $409,200, up 1.2% from last year. This marks the 29th consecutive month of year-over-year increases. The median condominium/co-op price in November was up 0.1% from a year ago at $358,600.  Recent gains for home inventory will put downward pressure on resale home prices in most markets in 2025.

Existing home sales in November were mixed across the four major regions. Sales rose in the Northeast (+4.1%) and South (+1.1%), fell in the Midwest (-2.0%), and remained unchanged in the West. On a year-over-year basis, sales were unchanged in the Northeast and South (2.8%), while down in the Midwest (-3.0%) and West (-1.3%).

The Pending Home Sales Index (PHSI) is a forward-looking indicator based on signed contracts. The PHSI rose from 74.9 to 76.3 in October. On a year-over-year basis, pending sales were 0.4% lower than a year ago, according to the National Association of Realtors’ data.


This article was originally published by a eyeonhousing.org . Read the Original article here. .


Builder confidence inched higher to end the year but still remains well into negative territory as builders continue to grapple with rising construction costs, tariff and economic uncertainty, and many potential buyers remaining on the sidelines due to affordability concerns.

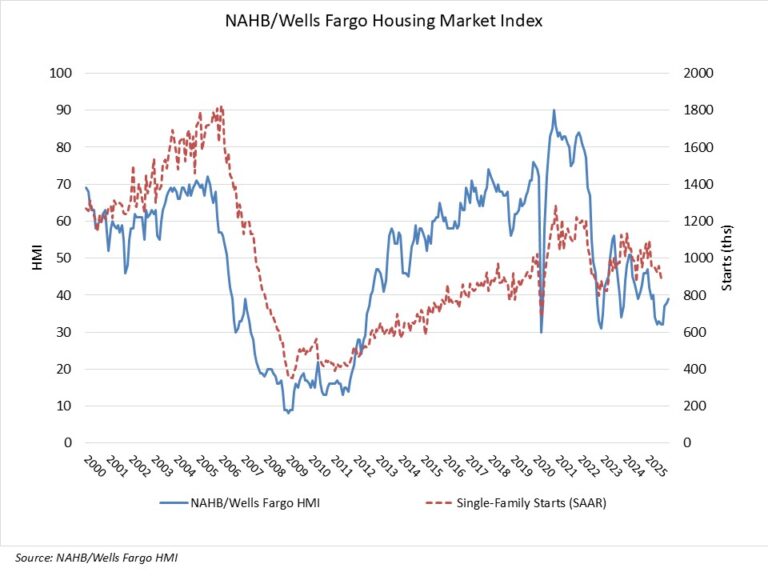
Builder confidence in the market for newly built single-family homes rose one point to 39 in December, according to the National Association of Home Builders (NAHB)/Wells Fargo Housing Market Index (HMI). Sentiment levels were below the breakeven point of 50 every month in 2025 and ranged in the high 30s in the final quarter of the year.

Market conditions remain challenging with two-thirds of builders reporting they are offering incentives to move buyers off the fence.

In positive signs for the market, builders report that future sales expectations have been above the key breakeven level of 50 for the past three months and the recent easing of monetary policy should help builder loan conditions at the start of 2026. However, builders continue to face supply-side headwinds, as regulatory costs and material prices remain stubbornly high. Rising inventory also has increased competition for newly built homes.

In a further sign of ongoing challenges for the housing market, the latest HMI survey also revealed that 40% of builders reported cutting prices in December, marking the second consecutive month the share has been at 40% or higher since May 2020. It was 41% in November. Meanwhile, the average price reduction was 5% in December, down from the 6% rate in November. The use of sales incentives was 67% in December, the highest percentage in the post-Covid period.

Derived from a monthly survey that NAHB has been conducting for more than 40 years, the NAHB/Wells Fargo HMI gauges builder perceptions of current single-family home sales and sales expectations for the next six months as “good,” “fair” or “poor.” The survey also asks builders to rate traffic of prospective buyers as “high to very high,” “average” or “low to very low.” Scores for each component are then used to calculate a seasonally adjusted index where any number over 50 indicates that more builders view conditions as good than poor.

The HMI index gauging current sales conditions increased one point to 42, the index measuring future sales rose one point to 52 and the gauge charting traffic of prospective buyers held steady at 26.

Looking at the three-month moving averages for regional HMI scores, the Northeast fell one point to 47, the Midwest rose two points to 43, the South increased two points to 36 and the West gained four points to 34.

The HMI tables can be found at nahb.org/hmi.

Editor’s Note: With the official 2026 release schedule for the Survey of Construction still unavailable from the U.S. Census Bureau, NAHB confirms the HMI for January 2026 will be released on January 16.  A schedule for the rest of the year will be available as soon as possible.


This article was originally published by a eyeonhousing.org . Read the Original article here. .


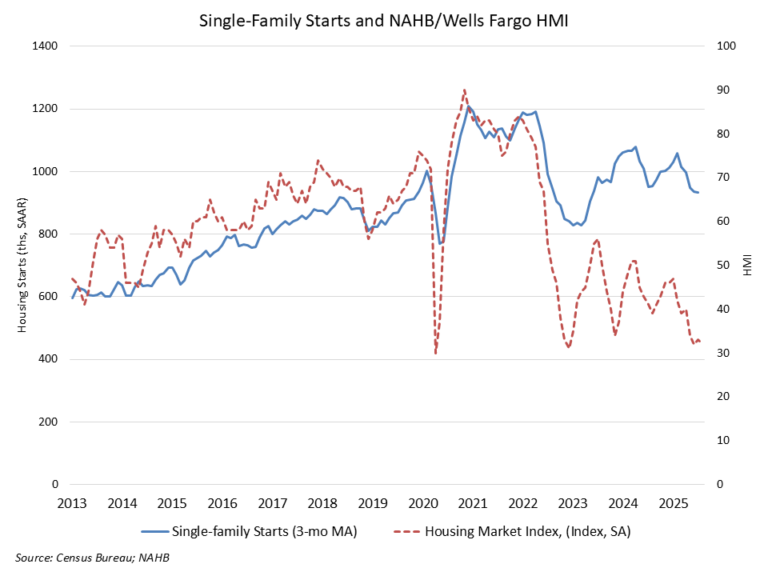
Single-family housing starts posted a modest gain in July as builders continue to contend with challenging housing affordability conditions and a host of supply-side headwinds, including labor shortages, elevated construction costs and inefficient regulatory costs.

Led by solid multifamily production, overall housing starts increased 5.2% in July to a seasonally adjusted annual rate of 1.43 million units, according to a report from the U.S. Department of Housing and Urban Development and the U.S. Census Bureau.

The July reading of 1.43 million starts is the number of housing units builders would begin if development kept this pace for the next 12 months. Within this overall number, single-family starts increased 2.8% to a 939,000 seasonally adjusted annual rate and are down 4.2% on a year-to-date basis. The multifamily sector, which includes apartment buildings and condos, increased 9.9% to an annualized 489,000 pace.

The slowdown in single-family home building has narrowed the home building pipeline. There are currently 621,000 single-family homes under construction, down 1% in July and 3.7% lower than a year ago. This is the lowest level since early 2021 as builders pull back on supply.

On a regional and year-to-date basis, combined single-family and multifamily starts were 10.2% higher in the Northeast, 17.7% higher in the Midwest, 2.4% lower in the South and 0.5% lower in the West.

Overall permits decreased 2.8% to a 1.35-million-unit annualized rate in July. Single-family permits increased 0.5% to an 870,000-unit rate and are down 5.8% on a year-to-date basis. Multifamily permits decreased 8.2% to a 484,000 pace.

Looking at regional permit data on a year-to-date basis, permits were 16.6% lower in the Northeast, 9.1% higher in the Midwest, 3.4% lower in the South and 5.1% lower in the West.

Discover more from Eye On Housing

Subscribe to get the latest posts sent to your email.


This article was originally published by a eyeonhousing.org . Read the Original article here. .


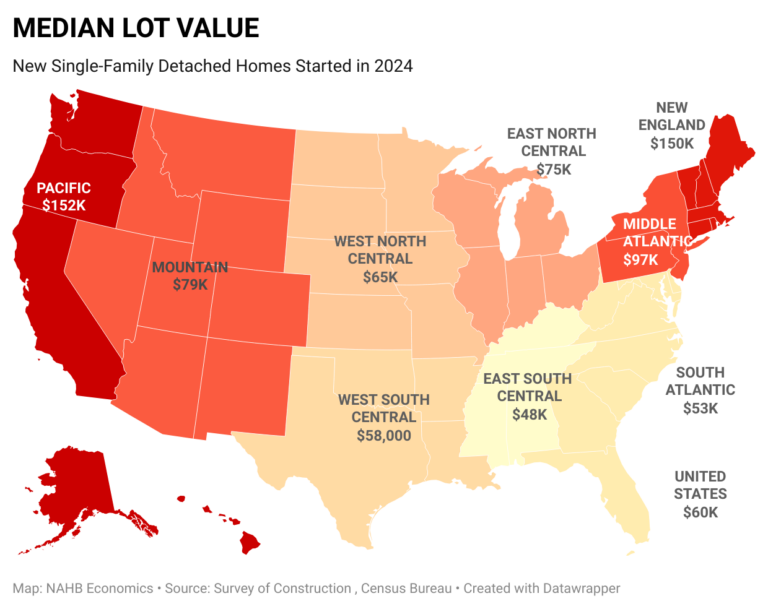
Despite shrinking lot sizes, values for single-family detached spec home lots continued to rise, with the national median outpacing U.S. inflation and reaching a new high in 2024. The U.S. median lot value for single-family detached for-sale homes started in 2024 stood at $60,000, according to NAHB’s analysis of the Census Bureau’s Survey of Construction (SOC) data.

Even though the national median lot value grew faster than U.S. inflation in 2024, it remains below the record levels of the housing boom of 2005-2006, when adjusted for inflation. At that time, half of the lots were valued at or over $43,000, equivalent to about $67,000 when converted into inflation-adjusted 2024 dollars.

Rising lot values stand out against the backdrop of dramatic shifts towards smaller lots in new spec home construction in recent years. Since the housing boom of 2005-2006, the share of lots under 1/5 of an acre rose from 48% in 2005 to 65% in 2024. Consequently, even though current median lot values are not record-breaking in real terms, they reflect a very different mix of lots compared to the housing boom years or even a decade ago. 

The fact that lot values continue to appreciate as their sizes shrink reflects ongoing challenges builders face in obtaining lots. Although lot shortages are not quite as widespread as they were in 2021, their current incidence, recorded by the May 2025 survey for the NAHB/Wells Fargo Housing Market Index (HMI), remains elevated, with 64% of builders rating the supply of developed lots as low or very low.

There is a substantial variation in lot values and appreciation across U.S. regions. New England and the Pacific stand out as the two divisions with the most expensive lots. Per the latest SOC data, half of all single-family detached (SFD) spec homes started in New England in 2024 were built on lots valued at or over $150,000. New England is known for strict local zoning regulations that often require very low density. As a matter of fact, the median lot size for single-family detached spec homes started in New England in 2024 was three times the national median. Therefore, it is not surprising that typical SFD spec homes in New England are built on some of the largest and most expensive lots in the nation.

The regional differences in lot sizes cannot fully explain the wide variation in lot values. The Pacific division, where the developable land is scarce, has the smallest lots. However, its median lot value reached $152,000 in 2024, the highest median in the nation. As a result, the Pacific division lots stand out as the most expensive in the country in terms of cost per acre.

The Middle Atlantic division hit a new record high in 2024, with half of the lots for SFD spec home starts valued at or above $97,000. This made the Middle Atlantic the third most expensive division in the U.S.

The East South Central and South Atlantic divisions are home to some of the least expensive spec home lots in the nation. The East South Central division recorded the lowest median lot value, at $48,000. Typical lots here are also significantly larger than the national median, thus defining some of the most economical lots, as well as the lowest cost per acre in the U.S. The neighboring South Atlantic is another division where the median lot value ($53,000) is below the national median of $60,000.

Lots in the West South Central, which includes Texas, appreciated dramatically over the last decade.  In 2012, half of the SFD spec homes were started on lots valued at or below $30,000, close to half of the current median of $58,000.

For this analysis, median lot values were chosen over averages, since averages tend to be heavily influenced by extreme outliers. In addition, the Census Bureau often masks extreme lot values in the public use SOC dataset, making it difficult to calculate averages precisely, but medians remain unaffected by these procedures.

This analysis is limited to single-family speculatively built homes by year started and with reported sales prices. For custom homes built on an owner’s land with either the owner or a builder acting as the general contractor, the corresponding land values are not reported in the SOC. Consequently, custom homes are excluded from this analysis.

Discover more from Eye On Housing

Subscribe to get the latest posts sent to your email.


This article was originally published by a eyeonhousing.org . Read the Original article here. .


Existing home sales rose 0.8% in May but remained near historical lows, according to the National Association of Realtors (NAR). Despite the modest increase, this marks the slowest pace for May since 2009. The sluggish sales suggest higher mortgage rates and elevated home prices continue to sideline buyers even with improved inventory conditions.

Mortgage rates have hovered between 6.5% and 7% due to ongoing economic and tariff uncertainty this year, prompting the Fed to pause interest rate cuts. With mortgage rates expected to stay above 6% for longer due to an anticipated slower easing pace in 2025, these prolonged higher rates and high home prices would continue to weigh on the market. As such, sales are likely to remain limited in the coming months.

Total existing home sales, including single-family homes, townhomes, condominiums, and co-ops, rose 0.8% to a seasonally adjusted annual rate of 4.03 million in May. On a year-over-year basis, sales were 0.7% lower than a year ago.

The first-time buyer share was 30% in May, down from 34% in April and 31% from a year ago.

The existing home inventory level was 1.54 million units in May, up 6.2% from April, and up 20.3% from a year ago. At the current sales rate, May unsold inventory sits at a 4.6-months’ supply, up from 4.4-months in April and 3.8-months in May 2024. Inventory between 4.5 to 6 month’s supply is generally considered a balanced market.

Homes stayed on the market for an average of 27 days in May, down from 29 days in April but up from 24 days in May 2024.

The May all-cash sales share was 27% of transactions, up from 25% in April but down from 28% a year ago. All-cash buyers are less affected by changes in interest rates.

The May median sales price of all existing homes was $422,800, up 1.3% from last year. This marked an all-time high for the month of May and the 23rd consecutive month of year-over-year increases. The median condominium/co-op price in May was up 0.7% from a year ago at $371,300.  Recent gains for home inventory will put downward pressure on resale home prices in most markets in 2025.

Geographically, three of the four regions saw an increase in existing home sales in May, with an increase of 1.7% in the South, 1.0% in the Midwest, and 4.2% in the Northeast. Meanwhile, sales in the West fell 5.4%. On a year-over-year basis, sales were up in the Northeast (4.2%) and the Midwest (1.0%), while sales were down in the South (-0.5%) and the West (-6.7%).

The Pending Home Sales Index (PHSI) is a forward-looking indicator based on signed contracts. The PHSI fell from 76.1 to 71.3 in April, suggesting buyers remained constrained by higher mortgage rates. On a year-over-year basis, pending sales were 2.5% lower than a year ago, per National Association of Realtors data.

Discover more from Eye On Housing

Subscribe to get the latest posts sent to your email.


This article was originally published by a eyeonhousing.org . Read the Original article here. .


Mortgage rates continued their upward trend in May due to market volatility triggered by fiscal concerns and weaker U.S. Treasury demand. According to Freddie Mac, the average 30-year fixed-rate mortgage rose to 6.82% — a 9-basis-point (bps) increase from April. The 15-year fixed-rate mortgage increased by 5 bps to 5.95%.

The 10-year Treasury yield, a benchmark for mortgage rates, averaged 4.38% in May, with the most recent weekly yield surpassing 4.50%. Long-term treasury yields spiked following two events: first, a credit rating downgrade by Moody’s Ratings, and then, a tepid auction of the 20-year treasury. The weak demand for long-term government bonds necessitated a higher yield to attract investors.

At the core of the market unease is concern over the growing fiscal deficit that intensified as the new “One Big Beautiful Bill” threatens to further widen the federal deficit, which stood at $1.9 trillion as of January 2025. The combination of weakening fiscal credibility and poor auction performance suggests a possible upward repricing of long-term borrowing costs.

Discover more from Eye On Housing

Subscribe to get the latest posts sent to your email.


This article was originally published by a eyeonhousing.org . Read the Original article here. .


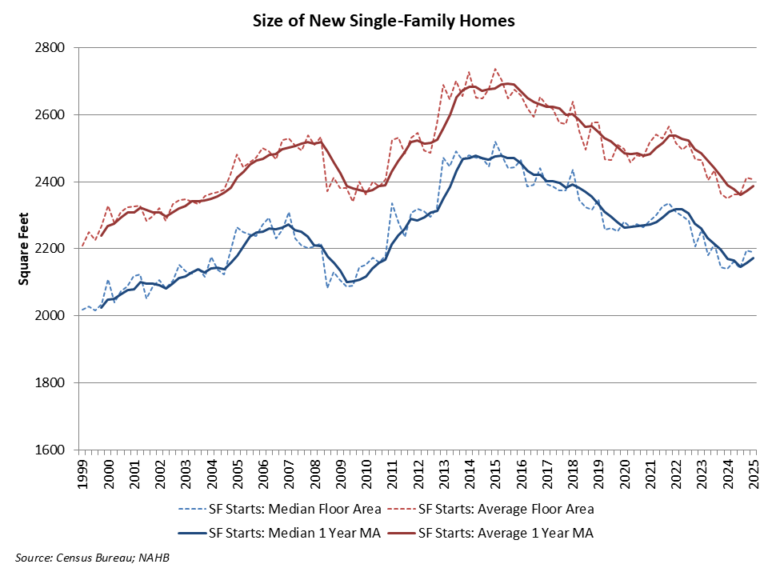
An expected impact of the virus crisis was a need for more residential space, as people used homes for more purposes including work. Home size correspondingly increased in 2021 as interest rates reached historic lows. However, as interest rates increased in 2022 and 2023, and housing affordability worsened, the demand for home size has trended lower.

According to first quarter 2025 data from the Census Quarterly Starts and Completions by Purpose and Design and NAHB analysis, median single-family square floor area was 2,190 square feet, near the highest reading since mid-2023. Average (mean) square footage for new single-family homes registered at 2,408 square feet.

The average size of a new single-family home, on a one-year moving average basis, trended higher to 2,386 square feet, while the median size is at 2,172 square feet.

Home size increased from 2009 to 2015 as entry-level new construction lost market share. Home size declined between 2016 and 2020 as more starter homes were developed. After a brief increase during the post-COVID building boom, home size has trended lower due to declining affordability conditions.

Discover more from Eye On Housing

Subscribe to get the latest posts sent to your email.


This article was originally published by a eyeonhousing.org . Read the Original article here. .

Pin It