Tag

Higher

Browsing


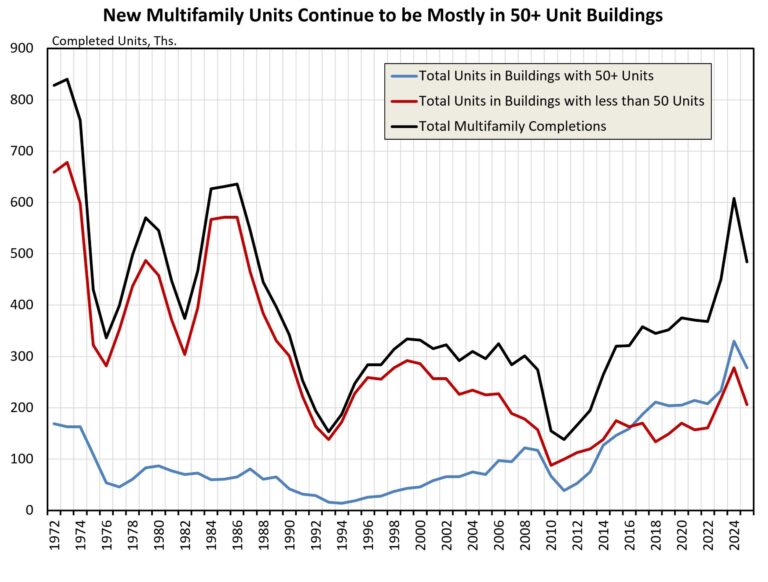
Following the highest number of multifamily completions in nearly 40 years in 2024, completions declined in 2025 to 484,000, according to NAHB analysis of the Census Bureau’s Survey of Construction. For the ninth consecutive year, a majority of new multifamily units were in buildings with 50 or more units (labeled as high-density buildings) at 57%, the highest share since 2021.

Dating back to the earliest estimates in the series (1972), multifamily units have historically been built in buildings with less than 50 units (low-medium density buildings). This trend reversed in 2017 and has remained unchanged through 2025, with a majority of new multifamily units being located in high-density buildings. Of the total 484,000 multifamily units completed in 2025, 278,000 (57%) were in high-density buildings while the remaining 206,000 (43%) were in low-medium density buildings.

Regional Distribution

The South continued to be the leading region in terms of units completed, down from 292,000 in 2024 to 217,000 completions in 2025. The South accounted for 45% of the total multifamily completions; the West held 26% (127,000), the Northeast 16% (79,000), and the Midwest 13% (63,000). The Midwest was the only region where low-medium density completions outpaced those in high-density buildings. The Midwest had 38,000 completions in low-medium density compared to 25,000 units in high-density buildings.

Conversely, the South, West and Northeast had more high-density completions than completions in low-medium density buildings. For the South, there were 122,000 units in high-density buildings and 95,000 low-medium density units. The West had 74,000 units in high-density buildings and 53,000 low-medium density units. The Northeast featured the largest divergence with 58,000 high-density units and 21,000 low-medium density.

As a share of regional completions, units in high-density buildings reached a new high in the Northeast at 73%. In the South, this share was up from 50% in 2024 to 56% in 2025. The West saw a similar rise, from 50% to 58% in 2025. The Midwest was the only region where this share declined, from 67% in 2024 to just 40% of completions in 2025.

Built-for-Rent

Among multifamily units completed in 2025, 95% were built-for-rent at 461,000. Over half of these units (59%) were in a building with 50 units or more, the highest share since 2021 (59%). This was the ninth straight year where most of multifamily rental-units were in high-density buildings. The second largest share was split between 30-49 unit buildings and 20-29 unit buildings, as both represented 15% of completed units in 2025. No other building category accounted for over 10% of completions in 2025.

Built-for-Sale

The number of multifamily units built-for-sale fell from 29,000 in 2024 to 23,000 in 2025. High-density buildings continued to be the primary type of building where these units were built, with 32% of built-for-sale units being completed in buildings with 50+ units. This share was down from 40% in 2024. The largest gain in market share for multifamily built-for-sale units was for buildings with 10-19 units, rising from 13% in 2024 to 24% in 2025 and making it the second largest segment of multifamily units built-for-sale.


This article was originally published by a eyeonhousing.org . Read the Original article here. .


Affordability challenges continued to weigh on the new-home market in June, as elevated mortgage rates, rising inflation and broader economic uncertainty kept many prospective buyers on the sidelines.

Sales of newly built single-family home rose 1.6% in June to a seasonally adjusted annual rate of 628,000, up from an upwardly revised May estimate, according to newly released data from the U.S. Department of Housing and Urban Development and the U.S. Census Bureau. The pace of new home sales is down 5.6% from a year earlier.

New home sales are down 5.2% on a year-to-date basis, as housing demand remains lackluster amid affordability challenges. At the regional level, only the Midwest has seen gains for new home sales thus far in 2026.

Builders continue to use incentives to support sales, with NAHB survey data showing that 62% of builders offered some form of incentive in June.

New home sales are gaining some momentum at the more affordable range of the market, with homes priced below $300,000 accounting for 23% of June sales, up from 16% a year earlier. However, that price point is generally only achievable in markets with lower development and construction costs, particularly with respect to lower state and local regulatory costs.

A new home sale occurs when a sales contract is signed, or a deposit is accepted. The home can be in any stage of construction: not yet started, under construction or completed. In addition to adjusting for seasonal effects, the June reading of 628,000 units is the number of homes that would sell if this pace continued for the next 12 months.

New single-family home inventory in June was virtually unchanged at 485,000 units, down 0.2% from May, and down 3.2% compared to a year ago. This represents an elevated 9.3 months’ supply at the current building pace. According to NAHB analysis, due to rising resale single-family inventory and elevated new construction inventory, combined new and existing home inventory stands at just above a 5.2 months supply, the highest level since the fall of 2014.

The median new home sale price in June fell 3.3% from May to $398,300, and was down 2.7% from a year ago, largely due to builder price cuts and some geographic shift in mix to the more affordable Midwest.

Regionally, on a year-to-date basis, new home sales are up 2.6% in the Midwest but fell in the other three regions, with declines of 4.7% in Northeast, 4.9% in the South and 10.1% in the West.


This article was originally published by a eyeonhousing.org . Read the Original article here. .
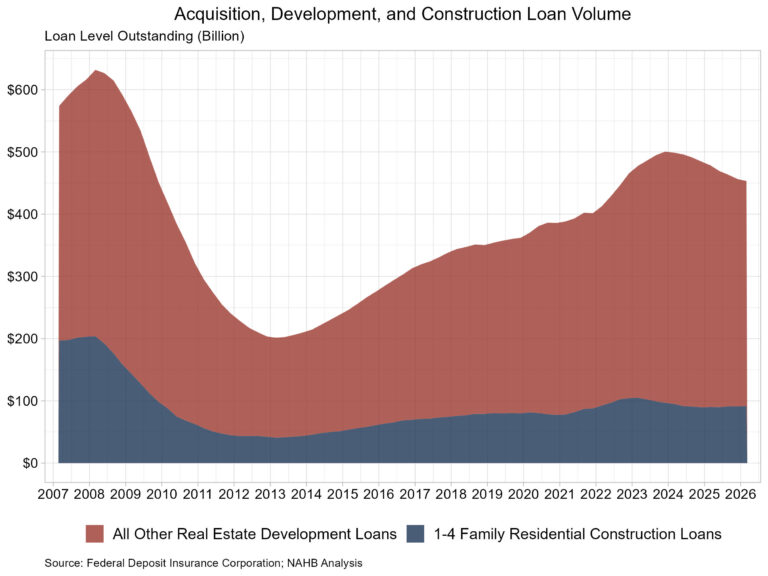

Single-family construction lending rose marginally in the first quarter, according to data released by the Federal Deposit Insurance Corporation. The volume of loans outstanding was up 0.8% from the fourth quarter. This increase comes at a time when NAHB’s AD&C Financing Survey indicates a slight tightening in credit conditions in the first quarter. The total volume of outstanding AD&C loans, which includes both nonresidential and residential construction loans, fell for the ninth consecutive quarter.

In the first quarter of 2026, the total level of outstanding AD&C loans fell to $453.3 billion, down 0.6% from the fourth quarter. The quarterly decline was led by a drop in other real estate development loans, which declined 1.8% to $361.5 billion. Meanwhile, the volume of 1-4 family residential construction and land development loans rose to $91.8 billion in the first quarter, up 0.8% from a quarter earlier. The volume of 1-4 family residential was up 1.9% from last year. This marked the third straight quarter showing a year-over-year increase.

It is worth noting that the FDIC data represents only the stock of loans, not changes in the underlying flows, so it is an imperfect data source. Nonetheless, lending remains much reduced compared with years past. The current amount of existing 1-4 family residential AD&C loans now stands 56% lower than the peak level of residential construction lending of $204 billion reached during the first quarter of 2008. Alternative sources of financing, including equity partners, have supplemented this capital market in recent years.

Quality Metrics of Construction Loans

The volume of loans that are 30+ days past due or nonaccrual status rose in the first quarter, to $989.8 million. As a share of the total 1-4 family residential construction loan volume, this accounts for 1.1%.

Breaking this out further, the level of loans 30-89 days past due was $451.3 million, while the volume in nonaccrual status was $495.2 million. The nonaccrual loan volume fell from $522.1 million in the fourth quarter, and the 30-89 past due volume rose from $414.2 million.

Loans are classified as nonaccrual when one or more of the following conditions apply: the loan is 90 days or more past due on principal or interest (unless it is well-secured and in the process of collection); the bank no longer expects full repayment of principal and interest; or the borrower’s financial condition has significantly deteriorated, warranting cash-basis accounting.


This article was originally published by a eyeonhousing.org . Read the Original article here. .
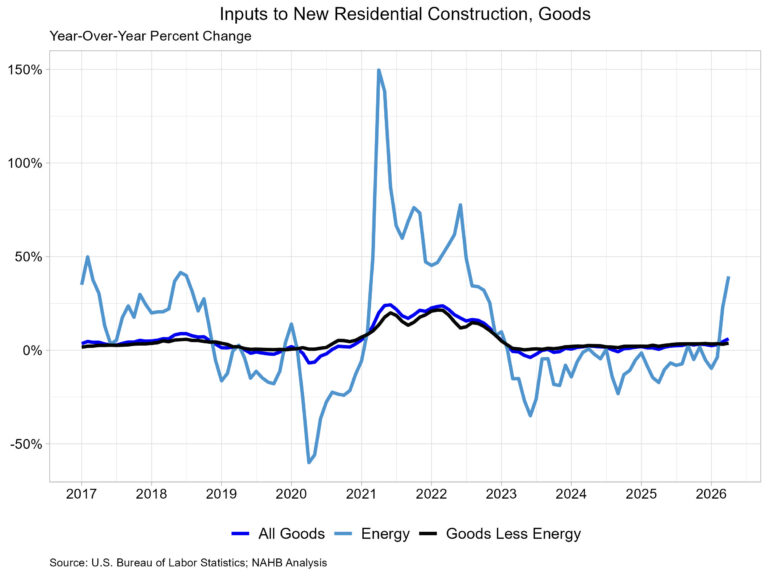

Prices rose across a host of goods and services used in residential construction. Rising energy prices were the primary driver, but transportation service prices also rose at their fastest pace since 2022. Meanwhile, building material prices, excluding energy, rose at their highest yearly rate in three years, up 3.7% from a year ago.

The Producer Price Index for final demand increased 1.4% in April, after rising 0.7% in March. Compared to a year ago, final demand prices were up 6.0%. The index for final demand services rose 1.2% in April, while the index for final demand goods rose 2.0% over the month.

The price index for inputs to new residential construction rose 1.3% in April and was up 5.9% from last year. The price of goods used in new residential construction was up 1.2% over the month and up 6.1% from last year, while the price of services was up 1.3% over the month and up 3.7% from last year.

Input Goods

The goods component has a larger importance to the inputs to residential construction price index, representing around 60% of the total. On a monthly basis, the price of input goods to new residential construction was up 1.2% in April.

The input goods to residential construction index can be further broken down into two separate components, one measuring energy inputs with the other measuring remaining goods. The latter of these two components simply represents building materials used in residential construction, which makes up around 93% of the goods index.

Energy input prices rose 13.8% in April and were 39.4% higher than a year ago. Building material prices were up 0.1% in April and up 3.7% compared to one year ago. Building material prices have continued to grow above 3.0% since July of last year.

Among input goods, the largest year-over-year increase was for No. 2 diesel fuel as prices were 74.4% higher than a year ago. Asphalt prices rose 18.0% higher than April 2025 after declining in March. Softwood lumber prices were up 1.1% in April after declining on a yearly basis for several months. Fewer materials showed yearly price declines than in March. Particleboard and fiberboard prices were down 12.0%, while softwood veneer/plywood prices were down 1.7%.

Input Services

Prices for service inputs to residential construction reported an increase of 1.3% in April. On a year-over-year basis, service input prices were up 5.6%. The price index for service inputs to residential construction can be broken out into three separate components: a trade services component, a transportation and warehousing services component, and a services excluding trade, transportation, and warehousing component (other services).

The most significant component is trade services (around 60%), followed by other services (around 29%), and finally transportation and warehousing services (around 11%). The largest component, trade services, was up 5.6% from a year ago. The price of transportation and warehousing services rose 15.3%, while prices for other services were up 1.6% over the year. Long-distance motor carrying service prices rose 10.4% in April and were 18.3% higher than a year ago, while local motor carrying service prices rose 1.4% in April and were 6.3% higher than a year ago. These are the two transportation services that are represented as inputs in the residential construction price index.


This article was originally published by a eyeonhousing.org . Read the Original article here. .


Energy input prices increased in March at their fastest pace since June of 2020 as the conflict in Iran shocked critical global supply chains. Building material prices, excluding energy, rose for the eleventh straight month. Price growth for trade services slowed while transportation and warehousing price growth accelerated.  

The Producer Price Index for final demand increased 0.5% in March, after rising 0.5% in February. The index for final demand services was unchanged in March, while the index for final demand goods rose 1.6% over the month.

The price index for inputs to new residential construction rose 1.2% in March and was up 3.8% from last year. The price of goods used in new residential construction was up 1.8% over the month and up 4.3% from last year, while the price of services was up 0.3% over the month and up 3.1% from last year.

Input Goods

The goods component has a larger importance to the inputs to residential construction price index, representing around 60% of the total. On a monthly basis, the price of input goods to new residential construction was up 1.8% in March.

The input goods to residential construction index can be further broken down into two separate components, one measuring energy inputs with the other measuring remaining goods. The latter of these two components simply represents building materials used in residential construction, which makes up around 93% of the goods index.

Energy input prices rose 21.4% in March and were 20.8% higher than one year ago. The monthly increase in March was the largest since prices rose 30.6% in June 2020. Building material prices were up 0.4% in March and up 3.1% compared to one year ago.

Among input goods, the largest year-over-year increase was for No. 2 diesel fuel as prices were 51.2% higher than a year ago. Metal molding and trim continued to show high price increases, as there were up 45.5% from last year. On the opposite end, the largest yearly declines in prices were for particleboard and fiberboard with prices down 15.7%. Notably, asphalt reported a price decline of 12.3% in March. For key inputs, ready-mix concrete prices were 0.5% higher than a year ago while softwood lumber prices were 7.8% lower than a year ago.

Input Services

Prices for service inputs to residential construction reported an increase of 0.3% in March. On a year-over-year basis, service input prices were up 3.1%. The price index for service inputs to residential construction can be broken out into three separate components: a trade services component, a transportation and warehousing services component, and a services excluding trade, transportation, and warehousing component (other services).

The most significant component is trade services (around 60%), followed by other services (around 29%), and finally transportation and warehousing services (around 11%). The largest component, trade services, was up 3.3% from a year ago. The price of transportation and warehousing services rose 6.2%, while prices for other services were up 1.5% over the year.

Expanded Inputs to New Construction Data

Within the PPI that BLS publishes, new experimental data was recently published regarding inputs to new construction. The data expands existing inputs to industry indexes by incorporating import prices with prices for domestically produced goods and services. With this additional data, users can track how industry input costs are changing among domestically produced products and imported products. This data focuses on new construction, but the complete dataset includes indices across numerous industries that can be found here on BLS website.

New construction input prices are primarily influenced by domestically produced goods and services, with domestic products accounting for 90% of the weight of the industry index for new construction. Imported goods make up the remaining 10% of the index.

The latest available data, for January 2026, showed that domestically produced goods continue to show price growth compared to imported goods used in new construction. On a year-over-year basis, the index for domestic goods increased 2.6%, while prices for imported goods have fallen 2.7%.


This article was originally published by a eyeonhousing.org . Read the Original article here. .
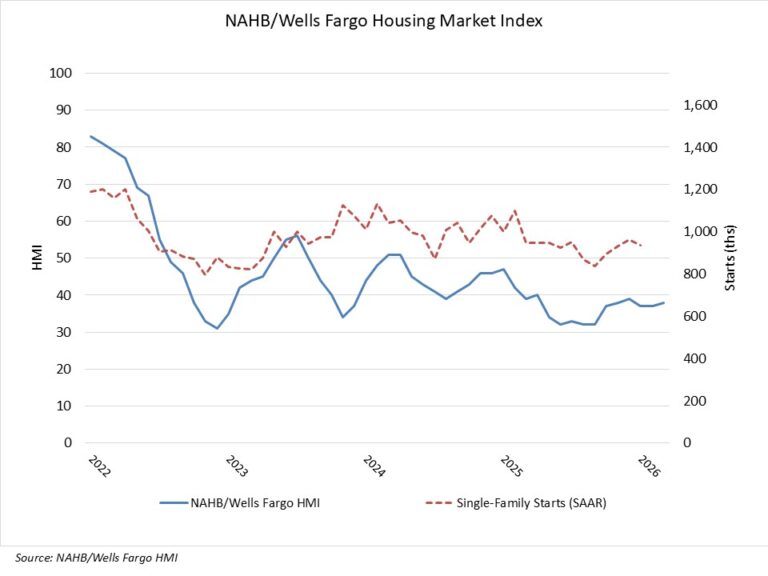

Builder sentiment inched up in March even as builders continue to express affordability concerns stemming from elevated construction costs and shortages of buildable lots and labor.

Builder confidence in the market for newly built single-family homes rose one point to 38 in March, following a revised upward one-point revision in February, according to the National Association of Home Builders (NAHB)/Wells Fargo Housing Market Index (HMI). All responses to the March survey were received after the conflict with Iran started.

Affordability for buyers and builders remains a top concern. Many buyers remain on the fence waiting for lower interest rates and due to economic uncertainty.

While the Freddie Mac 30-year fixed rate mortgage averaged 6.05% in February, the lowest since August 2022, downpayment hurdles and uncertainty from the conflict with Iran and the price of oil will be headwinds going forward. The administration’s executive orders issued last week to reduce regulatory burdens associated with home building are a positive step toward increasing attainable housing supply.

The latest HMI survey also revealed that 37% of builders cut prices in March, up slightly from 36% in February. The average price reduction remained stable at 6%. The use of sales incentives was 64% in March, down one percentage point from February, and marking the 12th consecutive month this share exceeded 60%.

Derived from a monthly survey that NAHB has been conducting for more than 40 years, the NAHB/Wells Fargo HMI gauges builder perceptions of current single-family home sales and sales expectations for the next six months as “good,” “fair” or “poor.” The survey also asks builders to rate traffic of prospective buyers as “high to very high,” “average” or “low to very low.” Scores for each component are then used to calculate a seasonally adjusted index where any number over 50 indicates that more builders view conditions as good than poor.

All three of the major HMI indices posted gains in March. The HMI index gauging current sales conditions increased one point to 42 from February to March, the index measuring future sales gained two points to 49 and the index charting traffic of prospective buyers posted a three-point increase to 25.

Looking at the three-month moving averages for regional HMI scores, the Northeast held steady at 44, the Midwest was unchanged at 43, the South held constant at 35 and the West fell two points to 31. The HMI tables can be found at nahb.org/hmi.


This article was originally published by a eyeonhousing.org . Read the Original article here. .
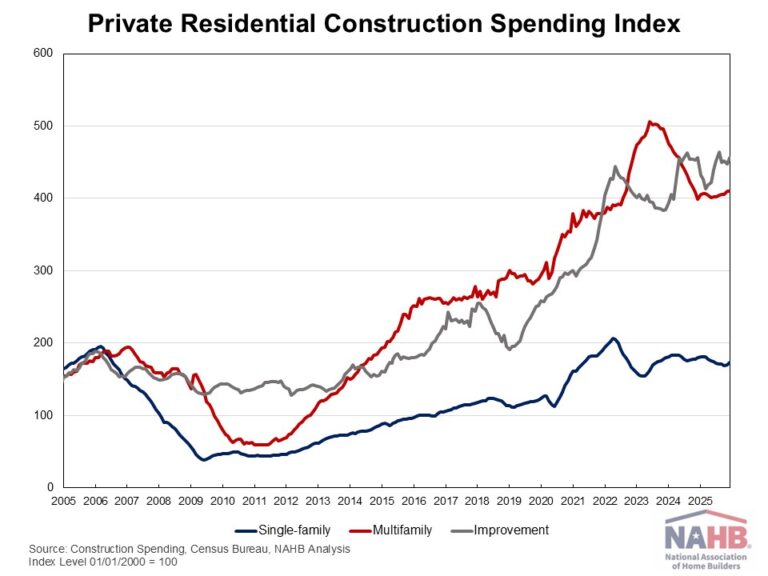

Private residential construction spending was up 1.5% for the last month of 2025. This modest gain was driven primarily by increased spending on home improvements and single-family construction. Despite this increase, total spending remained 1.3% lower than a year ago, reflecting the continued impact of housing affordability challenges facing the sector.

According to the latest construction spending data from the U.S. Census, single-family construction spending was up by 1.6% in December, consistent with the soft builder confidence reflected in the NAHB/Wells Fargo Housing Market Index (HMI). Compared to a year ago, single-family construction spending decreased 3.6%. Meanwhile, multifamily construction spending edged up 0.1% in December, marking a seventh consecutive month of modest gains. Compared to a year earlier, multifamily spending was 2.9% higher. Improvement spending (remodeling) rose 1.8% for the month but stayed flat relative to a year ago.

The NAHB construction spending index is shown in the graph below. The index illustrates how   spending on single-family construction has slowed since early 2024 under the pressure of elevated interest rates and concerns over building material tariffs. Multifamily construction spending growth has also slowed down after the peak in July 2023, with the index largely plateauing since late 2024. In contrast, improvement spending has been on an upward trend since the beginning of 2025.

Spending on private nonresidential construction was down 1.8% over a year ago. The annual private nonresidential spending decrease was primarily driven by a $26 billion drop in manufacturing construction spending, followed by a $2 billion decrease in healthcare construction spending.


This article was originally published by a eyeonhousing.org . Read the Original article here. .
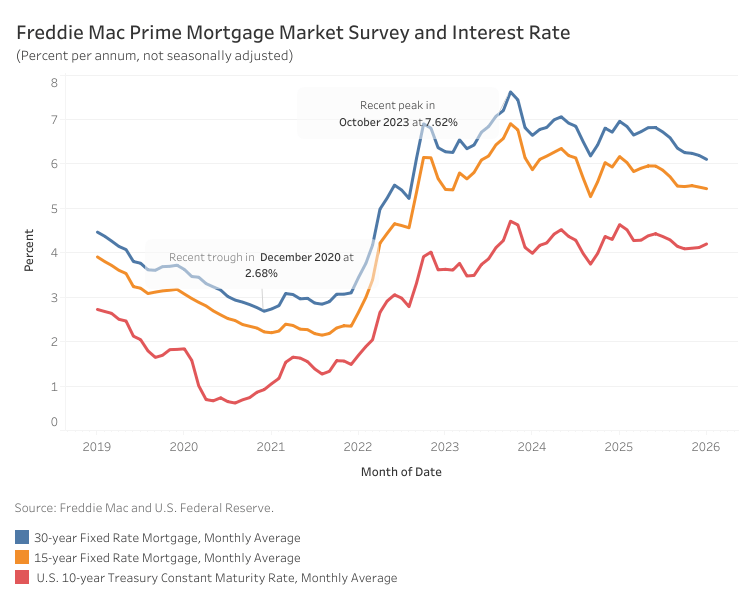

Long-term mortgage rates continued to decline in January. According to Freddie Mac, the 30-year fixed-rate mortgage averaged 6.10% last month, 9 basis points (bps) lower than December. Meanwhile, the 15-year rate declined 4 bps to 5.44%. Compared to a year ago, the 30-year rate is lower by 86 bps. The 15-year rate is also lower by 72 bps.

The 10-year Treasury yield, a key benchmark for long-term borrowing, averaged 4.20% in January – an increase of 8 bps from the previous month, but remained considerably lower than last year by 43 bps. While mortgage rates typically move in tandem with the treasury yields, the spread between the two narrowed during the month. Reports that the Trump administration encouraged Fannie Mae and Freddie Mac to expand purchases of mortgage-backed securities (MBS) boosted demand for MBS, pushing mortgage rates lower.

However, treasury yields rose sharply in the final week of January from global and fiscal pressures. The impact of the rift with Europe and the broader reduction of international purchases of U.S. Treasuries has left a measurable impact on U.S. interest rates. The 10-year Treasury rate at the beginning of 2026 was at 4.11%. That rate has now increased to 4.26%. This unfortunately means the beneficial impact of the $200 billion of additional acquisition of Fannie Mae and Freddie Mac MBS by those GSEs has been partially offset by international concerns.


This article was originally published by a eyeonhousing.org . Read the Original article here. .
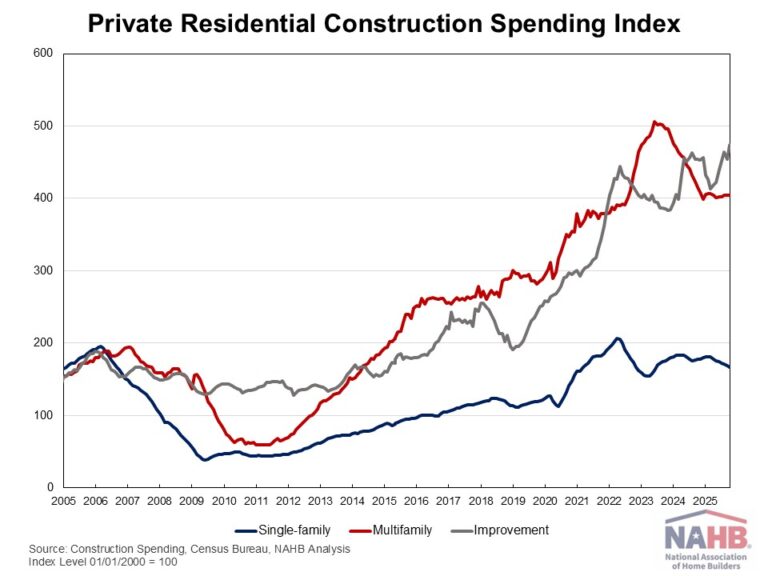

Private residential construction spending was up 1.3% in October, rebounding from a 1.4% decline in September 2025. This modest gain was primarily driven by increased spending on home improvements. Despite this increase, total spending remained 1.3% lower than a year ago, as the housing sector continues to navigate the economic uncertainty stemming from ongoing tariff concerns and elevated mortgage rates.

According to the latest U.S. Census construction spending data, single-family construction spending declined 1.3% in October, consistent with the soft builder confidence reflected in the NAHB/Wells Fargo Housing Market Index (HMI). Compared to a year ago, single-family construction spending decreased by 6.1%. Meanwhile, multifamily construction spending edged down 0.2% in October after four consecutive months of modest gains. Compared to a year earlier, multifamily spending was still down 2.8%. Improvement spending (remodeling) rose 4.5% for the month and was up 4.4% compared to a year ago.

The NAHB construction spending index is shown in the graph below. The index illustrates how   spending on single-family construction has slowed since early 2024 under the pressure of elevated interest rates and concerns over building material tariffs. Multifamily construction spending growth has also slowed down after the peak in July 2023, with the index largely plateauing since late 2024. In contrast, improvement spending has been on an upward trend since the beginning of 2025.

Spending on private nonresidential construction was down 2.6% over a year ago. The annual private nonresidential spending decrease was primarily driven by a $23 billion drop in manufacturing construction spending, followed by a $3.8 billion decrease in commercial construction spending.


This article was originally published by a eyeonhousing.org . Read the Original article here. .
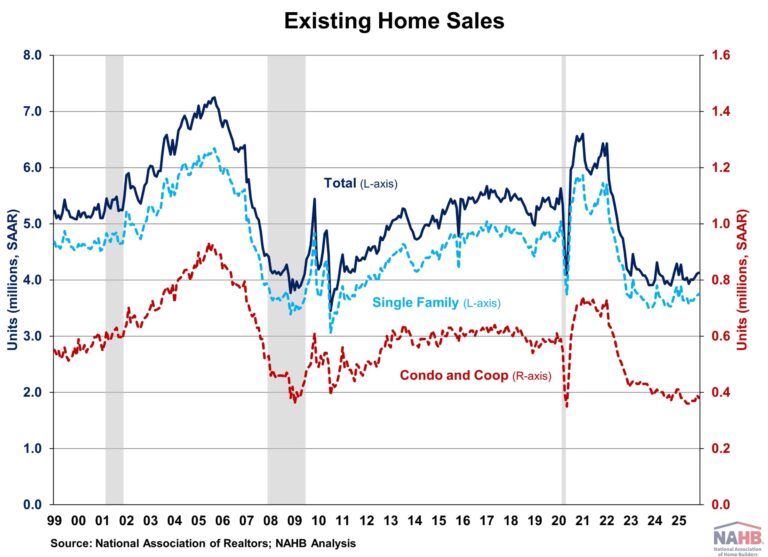

Existing home sales rose for the third consecutive month in November as lower mortgage rates continued to boost home sales, according to the National Association of Realtors (NAR). However, the increase remained modest as mortgage rates still stayed above 6% while down from recent highs. The weakening job market also weighed on buyer activity.

Meanwhile, inventory fell for the fourth consecutive month as homeowners with record-high housing wealth held back from listing properties. Relatively tight supply continued to push home prices higher and challenge housing affordability, even as wage growth outpaced home price gains.

Total existing home sales, including single-family homes, townhomes, condominiums, and co-ops, rose 0.5% to a seasonally adjusted annual rate of 4.13 million in November, the highest level since February. However, on a year-over-year basis, sales were 1.0% lower than a year ago.

The existing home inventory level was 1.43 million units in November, down 5.9% from October but up 7.5% from a year ago. At the current sales rate, November unsold inventory sits at a 4.2-months’ supply, down from 4.4-months in October but up from 3.8-months in November 2024. Inventory between 4.5 to 6 months’ supply is generally considered a balanced market.

Homes stayed on the market for a median of 36 days in November, up from 34 days last month and 32 days in November 2024.

The first-time buyer share was 30% in November, down from 32% in October but unchanged from a year ago.

The November all-cash sales share was 27% of transactions, down from 29% in October but up from 25% a year ago. All-cash buyers are less affected by changes in interest rates.

The November median sales price of all existing homes was $409,200, up 1.2% from last year. This marks the 29th consecutive month of year-over-year increases. The median condominium/co-op price in November was up 0.1% from a year ago at $358,600.  Recent gains for home inventory will put downward pressure on resale home prices in most markets in 2025.

Existing home sales in November were mixed across the four major regions. Sales rose in the Northeast (+4.1%) and South (+1.1%), fell in the Midwest (-2.0%), and remained unchanged in the West. On a year-over-year basis, sales were unchanged in the Northeast and South (2.8%), while down in the Midwest (-3.0%) and West (-1.3%).

The Pending Home Sales Index (PHSI) is a forward-looking indicator based on signed contracts. The PHSI rose from 74.9 to 76.3 in October. On a year-over-year basis, pending sales were 0.4% lower than a year ago, according to the National Association of Realtors’ data.


This article was originally published by a eyeonhousing.org . Read the Original article here. .

Pin It