Though new and existing homes remain largely unaffordable, the needle moved slightly in the right direction in the second half of 2025, according to the latest data from the National Association of Home Builders (NAHB)/Wells Fargo Cost of Housing Index (CHI). The CHI results from the fourth quarter of 2025 show that a family earning the nation’s median income of $104,200 needed 34% of its income to cover the mortgage payment on a median-priced new home. Low-income families, defined as those earning only 50% of median income, would have to spend 67% of their earnings to pay for the same new home.
In the last three quarters of 2025, the income share needed to buy a new home declined from 36% in the second quarter, to 35% in the third quarter and 34% in the final quarter of 2025. These figures indicate a slight improvement in affordability.
The same trend holds true for existing homes. A typical family would have to pay 37% of their income for a median-priced existing home in the second quarter, 36% in the third quarter and 34% in the final three months of 2025. A low-income family would need to pay 69% of their earnings to make the same mortgage payment on an existing home in the fourth quarter.
The U.S. data for the percentage of earnings needed to purchase a new home in the fourth quarter is based on a national median new home price of $405,300 and median income of $104,200. The fourth quarter median new home price is down 1.2% from $410,100 in the third quarter. The corresponding price for an existing home in the fourth quarter fell to $414,900, 2.8% down from $426,800 in the previous quarter. The average 30-year mortgage rate moved lower from 6.65% in the third quarter to 6.32% in the fourth quarter.
CHI is also available for 175 metropolitan areas, calculating the percentage of a family’s income needed to make the mortgage payment on an existing home based on the local median home price and median income in those markets.
In eight out of 175 markets in the fourth quarter, the typical family is severely cost-burdened (must pay more than 50% of their income on a median-priced existing home). In 69 other markets, such families are cost-burdened (need to pay between 31% and 50%). There are 98 markets where the CHI is 30% of earnings or lower.
The Top 5 Severely Cost-Burdened Markets
San Jose-Sunnyvale-Santa Clara, Calif., was the most severely cost-burdened market in the CHI, where 80% of a typical family’s income is needed to make a mortgage payment on an existing home. This was followed by:
Urban Honolulu, Hawaii (69%)
San Francisco-Oakland-Fremont, Calif. (63%)
San Diego-Chula Vista-Carlsbad, Calif. (62%)
Barnstable Town, Mass. (56%)
Miami-Fort Lauderdale-West Palm Beach, Fla. (56%)
Naples-Marco Island, Fla. (56%)
Low-income families would have to pay between 111% and 159% of their income in all seven of the above markets to cover a mortgage.
The Top 5 Least Cost-Burdened Markets
By contrast, many of the least cost-burdened markets were located in Illinois. In the top five least cost-burdened markets, typical families needed to spend just 16-18% of their income to pay for a mortgage on an existing home. These markets are:
Decatur, Ill. (16%)
Elmira, N.Y. (16%)
Springfield, Ill. (17%)
Peoria, Ill. (17%)
Davenport-Moline-Rock Island, Iowa-Ill. (18%)
Low-income families in these markets would have to pay between 32% and 36% of their income to cover the mortgage payment for a median-priced existing home.
Visit nahb.org/chi for tables and details.


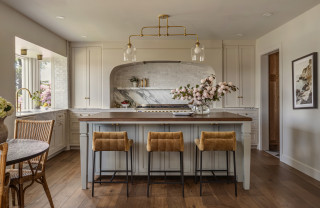


Kitchen at a Glance
Who lives here: A family
Location: Vienna, Virginia
Size: 256 square feet (24 square meters)
Designer-builder: Winn Design + Build
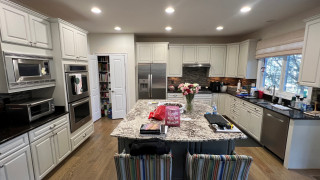
Before: Heavy traditional-style white cabinets stopped short of the ceiling and didn’t provide the storage the family needed. An abundance of stainless steel appliances overwhelmed the room, while a dated, busy tile backsplash created visual clutter. Dark granite countertops along the perimeter and a lighter granite on the island also felt out of step with the homeowners’ goals. They did want to keep the white oak flooring and have it refinished. “It continues into adjacent rooms,” says design-build pro Michael Winn.
The sink on the right and the rangetop on the back wall worked well but the left wall felt disjointed. A cramped grouping of wall ovens, a hulking microwave and a toaster oven sitting on the countertop crowded an awkward run of cabinetry. “They also had a workstation there that ends up for most people being a gathering space for papers,” Winn says. “We did away with that and cleaned things up.”
The large stainless steel refrigerator also made the cooking area feel tight. “To the left of that was the pantry closet,” Winn says. “It was a step-in pantry that simply consisted of deep shelves, so things would get lost in the back.”