Adults ages 55 and older make up a large and growing share of the U.S. population and play an important role in the U.S. housing market. In 2024, around 103 million Americans were ages 55 or older, ranging from adults still in the labor force to retirees. Using data from the latest American Community Survey, this analysis shows the demographic and housing characteristics of the 55+ population.
Among the 55+ population, adults 55-64 accounted for the largest share, at 40.5%. Another 34.6% were ages 65-74, followed by ages 75-84 at 18.8%. Adults 85 and older stood at about 6.3 million, representing 6.2% of the 55+ population. Overall, 60.9% of adults ages 55 and older were not in the labor force, while 37.9% were employed and 1.2% were unemployed. This reflects the large share of older adults who have transitioned out of employment as they move into retirement.
Single-family detached homes are the most common living arrangements for the 55+ population, but the pattern changes with age. More than 72% of adults ages 55-64 and 65-74 lived in single-family detached homes, compared with about 70% of those ages 75-84, and 58% of adults 85 and older. At the same time, multifamily housing becomes more common at older ages, rising from about 15% among adults ages 55-74, to 22.2% among those 85 and older. The shares living in group quarters also increased sharply with age, from less than 2% among adults ages 55-74 to 9.7% among those 85 and older.
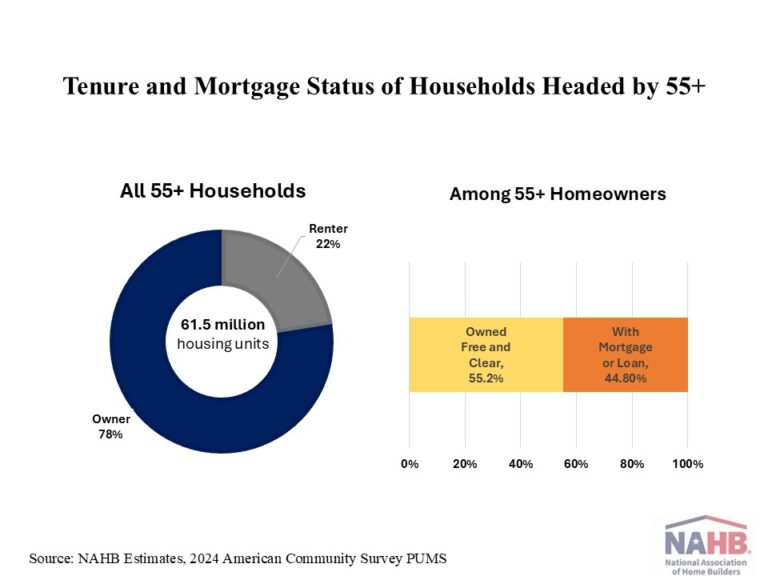
Looking more closely at the housing stock occupied by the 55+ population, the analysis next focuses on households headed by someone 55 or older. In 2024, these households occupied about 61.5 million housing units, accounting for 46.3% of all occupied housing units. Homeownership was widespread among these households, with 78% owner-occupied and 22% renter-occupied. Households headed by someone 55 or older accounted for about 55% of all owner-occupied homes, showing their substantial presence in the nation’s housing stock.
Among homeowners 55 and older, 55% owned their homes free and clear, while 44.8% had a mortgage or other housing loan. Moreover, mortgage-free homeownership also increases with age. About 41% of homeowners ages 55-64 owned their home free and clear, compared with 58% of those ages 65-74, 69% of those ages 75-84, and 82% of homeowners age 85 and older. On the other hand, the share of homeowners with a mortgage or loan fell from nearly 59% among ages 55-64 to about 18% among those age 85 and older.
Around half of homeowners 55 or older lived in homes built before 1980, including 24.5% in homes built between 1960 and 1979 and 25.4% in homes built before 1960. Homes built between 1980 and 1999 accounted for the largest share, at 27.4%, while only 22.6% of older households lived in homes built after 2000. This concentration of older homeowners in relatively aging housing stock signals a growing market for remodeling, maintenance and aging-in-place improvements.
Long residential duration was also common among homeowners 55 or older, showing the substantial share of aging in place among older Americans. Overall, around 29% of homeowners had lived in their current home for 30 years or more, while another 23% had lived in their home for 20 to 29 years. Length of residence increased with the age of the homeowner. Among homeowners ages 55-64, 14% had lived in their current home for at least 30 years. This share rose to 32% among homeowners ages 65-74, 43% among those ages 75-84, and 56% among homeowners ages 85 and older.
Older homeowners typically reported lower values for their homes The share reporting home values below $200,000 increased steadily with age, from 24.0% among homeowners ages 55–64 to 29.9% among those age 85 and older. By contrast, the share reporting values of $500,000 or more generally declined with age. Among homeowners ages 55–64, 33.2% reported home values of at least $500,000, compared with 26.6% of homeowners age 85 and older. Although reported home values tended to be lower at older ages, older homeowners were also much more likely to own their homes free and clear. As a result, many continued to hold substantial housing assets even at advanced ages.
Housing cost burdens[1] were generally manageable for homeowners 55 and over, but severe housing cost burdens increased at advanced ages. Overall, about 75% of the households headed by the 55+ population spent less than 30% of their household income on housing cost, while 12.8% spent between 30% and 49.9% and 12% spent 50% or more. The share of severely cost-burdened households, those spending at least half of their income on housing, increased steadily with age, from 9.6% among householders ages 55–64 to 12.3% among those ages 65–74, 14.3% among those ages 75–84, and 18.0% among householders age 85 and older. This pattern coincided with substantially lower household incomes at older ages, as labor force participation and employment rates tend to decline with age. Median household income for homeowners declined from about $105,700 for homeowners ages 55–64 to $45,800 for those age 85 or older.
Taken together, the data show that a large share of the 55+ population stayed in single-family detached homes, while multifamily housing and group quarters became more common among the oldest adults. At the same time, long residential tenure, high rates of mortgage-free home ownership, and the large share of older households in aging housing stock show the importance of remodeling and aging-in-place solutions as the 55+ population continues to grow.
[1] Housing cost burden calculation is for homeowners who report their household income.
This article was originally published by a eyeonhousing.org . Read the Original article here. .
