Tag

Declines

Browsing


Single-family permitting activity continued to weaken through the first seven months of 2026, while multifamily permitting remained stronger compared with the same period last year. Although single-family permits declined in most regions and states, multifamily permitting increased in three of the four regions, led by significant gains in the Northeast and West.

Over the first seven months of the year, the number of single-family permits issued nationwide reached 546,826. Compared with the same period in 2025, this represents a 3.3 percent decline from the July 2025 total of 565,208. In contrast, multifamily permitting activity remained stronger, with 304,876 permits issued nationwide, marking a 6.3 percent increase compared with the same period last year.

Regionally, year-to-date single-family permitting declined in three out of the four regions through July. The Midwest was essentially flat, with a 1.1 percent increase. The South declined 2.6 percent, the West fell 6.1 percent, and the Northeast posted the largest decline, at 9.6 percent. Multifamily permits increased in three of the four regions, led by the Northeast (39.9 percent), followed by the West (16.2 percent), and the Midwest (4.1 percent). The South was the only region to post a decline, with multifamily permits falling 6.5 percent, driven largely by reduced permitting activity in major metropolitan areas across the region.

At the state level, 20 states and the District of Columbia recorded increases in single-family permits compared with the same period last year, with gains ranging from 69.6 percent in the District of Columbia to 0.3 percent in Louisiana. The remaining 30 states posted declines. Nevada recorded the steepest decline, with single-family permits falling 27.5 percent.

The ten states issued the highest number of single-family permits accounted for 62.5 percent of all single-family permits issued nationwide. Texas led the nation with 87,795 permits issued through July 2026, although this represented a 3.1 percent decline from the same period in 2025. Florida, the second-highest state, recorded a 2.8 percent decline, while North Carolina, ranking third, posted a 7.7 percent decrease.

Through July, 30 states and the District of Columbia recorded increases in multifamily building permits, while 19 states experienced declines. Alaska remained unchanged. The District of Columbia posted the largest percentage increase, with multifamily permits rising 108.9 percent, from 541 to 1,130 units. In contrast, Nevada recorded the steepest decline, with permits falling 42.0 percent, from 3,916 to 2,271 units.

The ten states issued the highest number of multifamily permits accounted for 61.0 percent of all multifamily permits issued nationwide. Through the first seven months of 2026, Texas, which issued the largest number of multifamily permits, posted a 20.5 percent decline compared with the same period last year. California, the second-highest state, recorded a 25.9 percent increase, while Florida, ranking third, saw multifamily permits decrease by 31.2 percent.

At the local level, the following are the ten metropolitan areas with the highest number of single-family permits issued.

Below are the ten metropolitan areas with the highest levels of multifamily permitting activity.


This article was originally published by a eyeonhousing.org . Read the Original article here. .


Building a new single-family home took less time in 2025 compared to the previous three years. On average, it now takes 8.8 months from start to finish. That time includes 1.4 months for authorization to start construction and another 7.4 months to finish construction.

Data from the Census Bureau’s Survey of Construction shows that single-family construction timelines have shortened as pandemic-era supply chain challenges have eased. However, the time period is still around 1.6 months longer than the average completion time in 2015. The longer construction timeline may reflect several headwinds facing builders, including a more stringent regulatory environment and an ongoing skilled labor shortage.

Among all single-family houses completed in 2025, homes built for sale required the shortest amount of time, 7.4 months from obtaining building permits to completion. Meanwhile, homes built by owners (portion of custom home building) required the longest time, 14.3 months. Homes built by hired contractors took about 11.7 months (the larger portion of custom home building), and homes built-for-rent required about 12.4 months from authorization to completion.

The chart below illustrates that permit-to-completion time differs across home sizes. The smallest single-family homes, under 1,200 sq. ft., required 12.2 months to finish, relatively longer than every other size homes except those over 5,000 sq. ft. This prolonged period is primarily because half of these smaller homes are constructed specifically for rental purposes, which typically takes longer building time from authorization.

In contrast, homes ranging from 1,200 to 3,999 sq. ft. are built at the average building time, typically around 9 months. As the size increases beyond 4,000 sq. ft., there is a noticeable upward trend in completion times. Homes of 4,000-4,999 sq. ft. take about 10.7 months, while those between 5,000- 5,999 sq. ft. extend to around 12 months. Homes over 6,000 sq. ft. take the longest to build, requiring 16.3 months from permit to finish.

The average time from authorization to completion also varies regionally across divisions. The division with the longest duration was New England (13.5 months), followed by the Middle Atlantic (12.6 months), the Pacific division (10.3 months), the East South Central division (9.1 months), and the Mountain division (9.1 months) in 2025. These five divisions exceeded the nation’s average of 8.8 months. The shortest period, 7.6 months, is registered in the South Atlantic division. The average waiting period from permit to construction start varies from the shortest time of 1 month in the East North Central and the West North Central to the longest of 1.8 months in New England.

The SOC also collects additional information for houses built for sale, including a sale date when buyers sign sale contracts or make a deposit. Looking at single-family homes built for sale and completed in 2025, 12.3% were sold before construction started, 29.3% sold while under construction, 18.5% sold during the month of completion, and 31.5% sold after completion. The share of completed houses remaining unsold was 8.3% at the point of survey. Compared with 2024, a larger share of new single-family homes remained on the market until after construction was completed. The share sold after completion rose from 27.0% to 31.5%, while the share sold while under construction fell from 33.0% to 29.3%, and the share sold before construction began declined from 15.2% to 12.3%. These shifts suggest that, despite shorter construction timelines, builders faced a weaker sales environment in 2025.


This article was originally published by a eyeonhousing.org . Read the Original article here. .


Single-family built-for-rent (SFBFR, or built-to-rent (BTR)) construction fell back in the second quarter of 2026, as a higher cost of financing, increased multifamily supply and policy concerns over Congressional legislation related to institutional capital froze parts of the development market. Fortunately, changes by the House of Representatives addressed a harmful Senate proposal. The housing legislation, as enacted into law, does not include a prohibition against institutional capital financing BTR housing. Stabilization for BTR housing should be reached in the coming months.

According to NAHB’s analysis of data from the Census Bureau’s Quarterly Starts and Completions by Purpose and Design, there were approximately 15,000 single-family built-for-rent (SFBFR) starts during the second quarter of 2026. This is down measurably from the second quarter of 2025 (18,000).

Over the last four quarters, 63,000 such homes began construction, which is a 16% decrease compared to the 75,000 estimated BTR starts for the prior four quarter period.

The BTR market is a source of inventory amid challenges regarding housing affordability and down payment requirements in the for-sale market, particularly during a period when a growing number of people want more space and a single-family structure. Single-family built-for-rent construction differs in structural characteristics compared to other newly-built single-family homes, particularly with respect to home size.

Given the relatively small size of this market segment, the quarter-to-quarter movements typically are not statistically significant. The current four-quarter moving average of market share (just under 7%) is nonetheless higher than the historical average of 2.7% (1992-2012).

Importantly, as measured for this analysis, the estimates noted above include only homes built and held by the builder for rental purposes. The estimates exclude homes that are sold to another party for rental purposes, which NAHB estimates may represent another three to five percent of single-family starts based on industry surveys.

The Census data note an elevated share of single-family homes built as condos (non-fee simple), with this share averaging about 3% over recent quarters. Some, but certainly not all, of these homes will be used for rental purposes. Additionally, it is theoretically possible that some single-family built-for-rent units are being counted in multifamily starts, as a form of “horizontal multifamily,” given that these units are often built on a single plat of land. However, spot checks by NAHB with permitting offices indicate no evidence of this data issue occurring.a

With the onset of the Great Recession and declines in the homeownership rate, the share of built-for-rent homes increased in the years after the recession. While the market share of SFBFR homes is small, it has clearly expanded. Given affordability challenges in the for-sale market, the SFBFR market will likely retain an elevated market share.


This article was originally published by a eyeonhousing.org . Read the Original article here. .
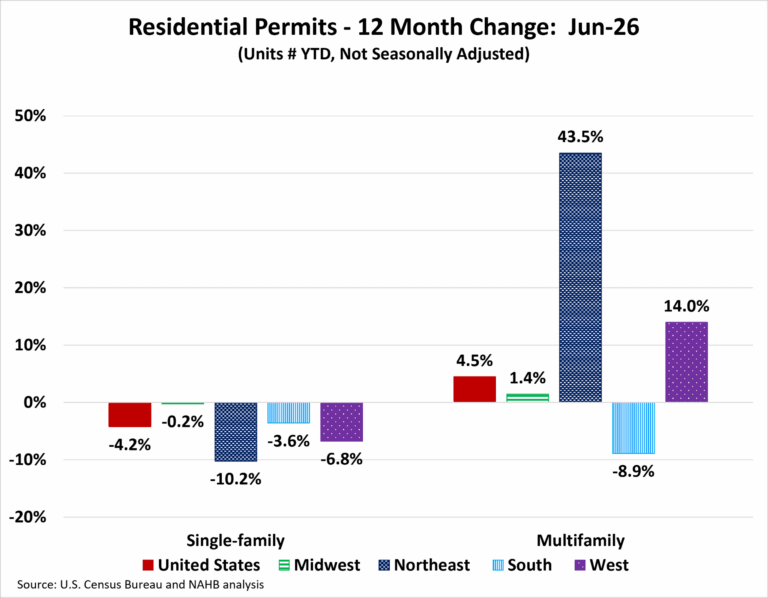

Single-family permitting activity continued to weaken through the first half of 2026, while multifamily permitting remained somewhat stronger compared with the same period last year.

Over the first six months of the year, the number of single-family permits issued nationwide reached 465,301. Compared with the same period in 2025, this represents a 4.2 percent decline from the June 2025 total of 485,935. In contrast, multifamily permitting activity remained stronger, with 255,751 permits issued nationwide, marking a 4.5 percent increase from the same period last year.

Regionally, year-to-date single-family permitting declined in all four regions through June. The Midwest was essentially flat, while the South declined 3.6 percent, the West fell 6.8 percent, and the Northeast posted the largest decline, at 10.2 percent. Multifamily permits increased in three of the four regions, led by the Northeast (43.5 percent), followed by the West (14.0 percent) and the Midwest (1.4 percent). The South was the only region to post a decline, with multifamily permits falling 8.9 percent, driven largely by reduced permitting activity in major metropolitan areas across the region.

At the state level, 13 states and the District of Columbia recorded year-over-year increases in single-family permits through June, with gains ranging from 65.2 percent in the District of Columbia to 1.0 percent in Idaho. California reported no change, while the remaining 35 states posted declines. Nevada recorded the steepest decline, with single-family permits falling 26.0 percent.

The ten states issuing the highest number of single-family permits accounted for 62.8 percent of all single-family permits issued nationwide. Texas led the nation with 75,274 permits issued through June 2026, although this represented a 3.6 percent decline from the same period in 2025. Florida, the second-highest state, recorded a 5.0 percent decline, while North Carolina, ranking third, posted a 9.2 percent decrease.

Through June, 33 states and the District of Columbia recorded increases in multifamily building permits, while 17 states experienced declines. The District of Columbia posted the largest percentage increase, with multifamily permits rising 137.5 percent, from 469 to 1,114 units. In contrast, Nevada recorded the steepest decline, with permits falling 51.2 percent, from 3,866 to 1,888 units.

The ten states issuing the highest number of multifamily permits accounted for 61.0 percent of all multifamily permits issued nationwide. Through the first six months of 2026, California, which issued the largest number of multifamily permits, posted a 26.1 percent increase compared with the same period last year. Texas, the second-highest state, recorded a 23.7 percent decline, while Florida, ranking third, saw multifamily permits decrease by 41.3 percent.

At the local level, the following are the ten metropolitan areas with the highest number of single-family permits issued.

Below are the ten metropolitan areas with the highest levels of multifamily permitting activity. It is worth noting that the largest multifamily markets continue to show declines. Gains for multifamily permitting are occurring in smaller markets and for smaller builders.


This article was originally published by a eyeonhousing.org . Read the Original article here. .


Residential building material prices, excluding energy, rose 0.5% in June and were up 4.6% from a year ago. Lower energy prices were apparent in June, as energy input prices fell 10.3% over the month. Meanwhile, prices for services rose 5.2% over the year, and were up 1.0% from the previous month.

The Producer Price Index for final demand declined 0.3% in June, after rising 0.6% in May. Compared to a year ago, final demand prices were up 5.5%. The index for final demand services rose 0.3% in June, while the index for final demand goods fell 1.4% over the month.

The price index for inputs to new residential construction fell 0.1% in June and was up 6.2% from last year. The price of goods used in new residential construction (including energy) was down 0.8% over the month and up 6.9% from last year, while the price of services was up 1.0% over the month and up 5.2% from last year. The decline in the overall residential input price index was largely driven by lower goods prices, particularly energy-related inputs.

Input Goods

The goods component has a larger importance to the inputs to residential construction price index, representing around 60% of the total. On a monthly basis, the price of input goods to new residential construction was down 0.8% in June, the first monthly decline since December of last year.

The input goods to residential construction index can be further broken down into two separate components, one measuring energy inputs with the other measuring remaining goods. The latter of these two components simply represents building materials used in residential construction, which makes up around 93% of the goods index. Energy input prices fell 10.3% in June but were 40.9% higher than a year ago. Building material prices were up 0.5% in June and up 4.6% compared to one year ago.

Among input goods, energy costs continue to show the largest price increase from a year ago. Diesel fuel costs were up 65.7% from a year ago in June. Outside of energy products, roofing asphalt product prices were up 9.2% from a year ago and rose 4.0% in June alone. Softwood lumber prices showed upward movement in June, with prices 7.0% higher than a year ago. Ready-mix concrete prices were up 1.9% from a year ago, while gypsum building material prices were down 1.1% from a year ago.

Input Services

Prices for service inputs to residential construction rose 1.0% in June. On a year-over-year basis, service input prices were up 5.2%. The price index for service inputs to residential construction can be broken out into three separate components: a trade services component, a transportation and warehousing services component, and a services excluding trade, transportation, and warehousing component (other services).

The most significant component is trade services (around 60%), followed by other services (around 29%), and finally transportation and warehousing services (around 11%). The largest component, trade services, was up 4.7% from a year ago. The price of transportation and warehousing services rose 16.0%, while prices for other services were up 2.0% over the year.


This article was originally published by a eyeonhousing.org . Read the Original article here. .


In 2024, the number of second homes in the U.S. was 6.2 million, accounting for 4.3% of the nation’s housing stock, according to NAHB estimates. This reflects a modest decline from 2022, when the number reached 6.5 million. This decline suggests some cooling following the pandemic-era surge in second home demand.

Despite the recent decline, second homes remain highly concentrated in a few states. Florida had the largest stock of second homes, with 943,881 units accounting for 15.2% of the national total. Overall, half of the nation’s second homes are located in just eight states: Florida, California, New York, Texas, Michigan, North Carolina, Arizona, and Pennsylvania.

A closer look at county-level data shows that the concentration of second homes is not simply restricted to conventional locations like beachfront areas. In total, 738 counties across all 50 states had second homes making up at least 10% of the local housing stock. Only Washington D.C. was the exception, reporting a second home share of 1.7%. Moreover, 272 counties—around 8% of all counties nationwide—had second homes accounting for at least 20% of housing units.

In some areas, second homes dominate the local housing market. Counties where at least half of their housing stock is second homes were widely spread over in fourteen states. Of these counties, there were three counties in Colorado, two counties in Utah, California, Massachusetts, Wisconsin, and Pennsylvania, and one county each in Alaska, Idaho, Maryland, Michigan, Minnesota, Missouri, New Jersey, and New York. These national patterns are shown in the interactive map below.

Counties with more than 25,000 second homes are mostly located in or near metropolitan areas.  The top ten counties with the most second homes account for around 11% of second home stocks, most of which are in Arizona, Florida, California, Massachusetts, and New York. Of the top 10 counties regarding absolute numbers of second homes, only two counties (Barnstable County, Massachusetts, and Collier County, Florida) had more than 20% of their housing stock in second homes.

In terms of methodology, this analysis focuses on the number and location of second homes that would qualify for the home mortgage interest deduction by individuals and uses the Census Bureau’s 2024 American Community Survey (ACS). It does not account for homes held primarily for investment or business purposes.

NAHB estimates are based on the definition used for home mortgage interest deduction: a second home is a non-rental property that is not classified as taxpayer’s principal residence. Examples could be: (1) a home that used to be a primary residence due to a move or a period of simultaneous ownership of two homes due to a move; (2) a home under construction for which the eventual homeowner acts as the builder and obtains a construction loan (Treasury regulations permit up to 24 months of interest deductibility for such construction loans); or (3) a non-rental seasonal or vacation residence. However, homes under construction are not included in this analysis because the ACS does not collect data on units under construction.


This article was originally published by a eyeonhousing.org . Read the Original article here. .
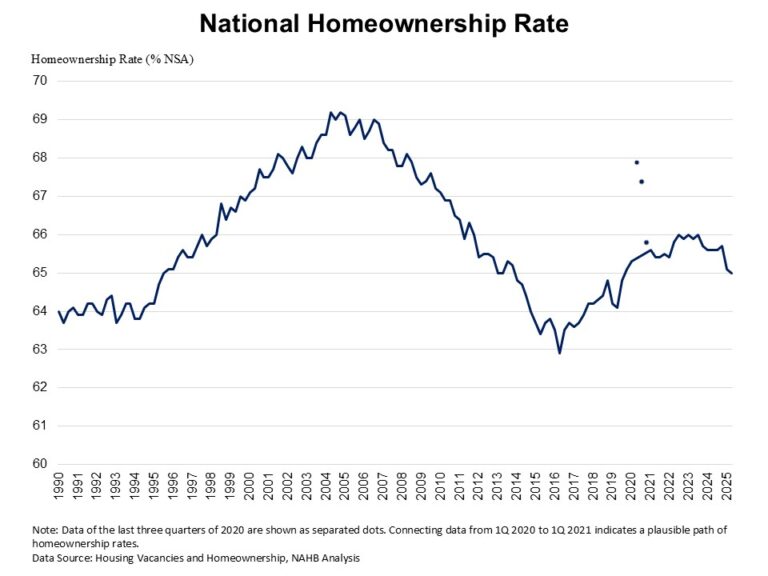

The latest homeownership rate declined to 65% in the second quarter of 2025, marking its lowest level since late 2019, according to the Census’s Housing Vacancy Survey (HVS). With mortgage interest rates remaining elevated and housing supply still tight, housing affordability is at a multidecade low. Compared to the peak of 69.2% in 2004, the homeownership rate is currently 4.2 percentage points lower and remains below the 25-year average rate of 66.3%.

Compared to the previous quarter, the homeownership rate dropped by 0.1 percentage point.[OD1]  Additionally, homeownership rates dropped amongst almost all age groups. Householders aged 45-54 experienced the largest drop, declining by 1.9 percentage points from 71.1% to 69.2%. The 35-44 age group saw a 1.2 percentage point decrease, decreasing from 62.2% to 61%. Among younger households, the homeownership rate for those under 35 dropped 1percentage points to 36.4% in the second quarter of 2025, hovering near the lowest rate in the last 6 years. This age group, particularly sensitive to mortgage rates and the inventory of entry-level homes. However, homeownership rates for householders aged 55-64 and 65 years and over stayed unchanged from a year ago.

The national rental vacancy rate inched down to 7% for the second quarter of 2025, after steadily increasing since 2021. Meanwhile, the homeowner vacancy rate stayed at 1.1%, remaining near the survey’s 67-year low of 0.7%.

The housing stock-based HVS revealed that the count of total households increased to 132.5 million in the second quarter of 2025 from 131.3 million a year ago. This increase was driven entirely by renter household growth, which added 1.2 million new households. Meanwhile, the number of owner-occupied households declined by 39,000 over the same period.

Discover more from Eye On Housing

Subscribe to get the latest posts sent to your email.


This article was originally published by a eyeonhousing.org . Read the Original article here. .


In 2024, there were 24,000 homes that exceeded 5,000 square feet, equating to a 2.3% market share of all new homes started. Both the number and market share for 5,000+ square foot homes experienced declines from 2023, according to the annual data from the Census Bureau’s Survey of Construction (SOC).

The number of homes started in 2024 exceeding 5,000 square feet dropped to 24,000, a decrease from 26,000 in 2023. In 2006, the number of new 5,000+ square foot homes reached a peak of 45,000. This number proceeded to drop during the Great Recession and hit a low of 11,000 in 2009. Since 2013, the number has remained consistently above 20,000, with a recent peak of 33,000 in 2021.

Of the total number of new homes started in 2024, 2.3% had 5,000+ square feet or more of finished space, down from 2.8% in 2023.  The decline marks the third consecutive drop in the share of homes this size, down from a recent peak of 2.9% in 2021.  In 2015, the 5,000+ square foot share reached a record high of 3.9%.  Since then, it has fluctuated between 2.3% and 3.1%.

Tabulating the major characteristics of 5,000+ square foot homes started in 2024, the data show 83% have a porch, 79% have a finished basement, 71% have a patio, 69% have four or more bathrooms, 66% have a 3-or-more car garage, 54% have five bedrooms or more, and 50% belong to a community association.

Discover more from Eye On Housing

Subscribe to get the latest posts sent to your email.


This article was originally published by a eyeonhousing.org . Read the Original article here. .
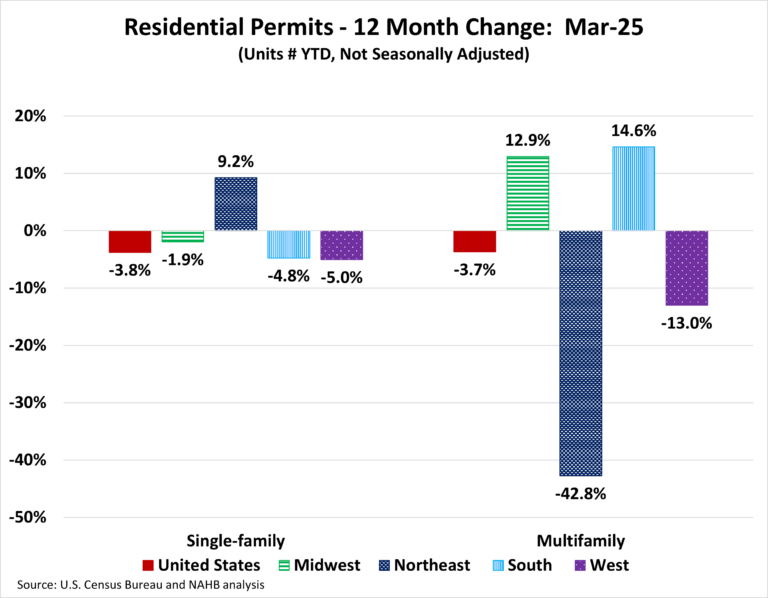

Permits continue a downhill trend for the third month in a row. Over the first three months of 2025, the total number of single-family permits issued year-to-date (YTD) nationwide reached 232,221. On a year-over-year (YoY) basis, this is a decline of 3.8% over the March 2024 level of 241311. For multifamily, the total number of permits issued nationwide reached 113,344. This is 3.7% below the March 2024 level of 117,695.

Year-to-date ending in March, single-family permits were down in three out of the four regions. The Northeast posted an increase of 9.2%. The Midwest was down by 1.9%, the South was down by 4.8%, and the West was down by 5.0% in single-family permits during this time. For multifamily permits, two out of the four regions posted increases. The South was up by 14.6% and the Midwest was up by 12.9%. Meanwhile, the West posted a decline of 13.0% and the Northeast declined steeply by 42.8%.

Between March 2025 YTD and March 2024 YTD, 20 states posted an increase in single-family permits. The range of increases spanned 29.6% in Alaska to 0.2% in Utah. The remaining 30 states and the District of Columbia reported declines in single-family permits with New Mexico reporting the steepest decline of 32.7%.

The ten states issuing the highest number of single-family permits combined accounted for 64.3% of the total single-family permits issued. Texas, the state with the highest number of single-family permits, issued 38,425 permits over the first three months 2025, which is a decline of 5.5% compared to the same period last year. The second highest state, Florida, was down by 8.8%, while the third highest, North Carolina, posted a decline of 0.1%.

Between March 2025 YTD and March 2024 YTD, 23 states and the District of Columbia recorded growth in multifamily permits, while 27 states recorded a decline. Alaska (+533.3%) led the way with a sharp rise in multifamily permits from 12 to 76, while New York had the biggest decline of 64.8% from 11,316 to 3,984.

The ten states issuing the highest number of multifamily permits combined accounted for 61.7% of the multifamily permits issued. Over the first three months of 2025, Florida, the state with the highest number of multifamily permits issued, experienced an increase of 48.8%. Texas, the second-highest state in multifamily permits, saw a decline of 0.5%. California, the third largest multifamily issuing state, decreased by 22.7%.

At the local level, below are the top ten metro areas that issued the highest number of single-family permits.

For multifamily permits, below are the top ten local areas that issued the highest number of permits.

Discover more from Eye On Housing

Subscribe to get the latest posts sent to your email.


This article was originally published by a eyeonhousing.org . Read the Original article here. .
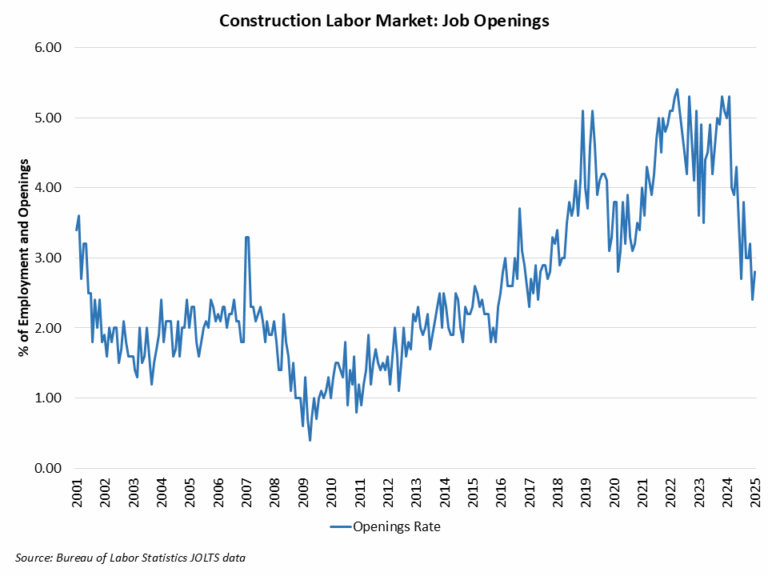

After a period of slowing associated with declines for some elements of the residential construction industry, the count of open construction sector jobs remained lower than a year ago, per the January Bureau of Labor Statistics Job Openings and Labor Turnover Survey (JOLTS).

The number of open jobs for the overall economy increased from 7.51 million in December to 7.74 million in January. This is notably smaller than the 8.47 million estimate reported a year ago and reflects a softened aggregate labor market. Previous NAHB analysis indicated that this number had to fall below 8 million on a sustained basis for the Federal Reserve to feel more comfortable about labor market conditions and their potential impacts on inflation. With estimates remaining below 8 million for national job openings, the Fed in theory should be able to cut further despite a recent pause. However, tariff proposals may keep the Fed on pause in the coming quarters.

The number of open construction sector jobs increased from a revised 205,000 in December to 236,000 in January. This nonetheless marks a significant reduction of open, unfilled construction jobs than that registered a year ago (407,000) due to a slowing of construction activity because of ongoing elevated interest rates.

The construction job openings rate edged higher to 2.8% in January, significantly down year-over-year from 4.8%.

The layoff rate in construction stayed low (1.8%) in January. The quits rate moved higher to 2% in January, near to its rate from a year ago.

Discover more from Eye On Housing

Subscribe to get the latest posts sent to your email.


This article was originally published by a eyeonhousing.org . Read the Original article here. .

Pin It