Tag

Costs

Browsing


How much is a real estate agent commission—and who actually pays it? These are common questions among homebuyers and sellers navigating a real estate transaction, and the answers have changed recently.

In most cases, real estate agents are paid through commission fees based on the home’s final sale price. But following new guidelines from the National Association of Realtors®—which took effect on Aug. 17, 2024—new rules are now 9in place for how these commissions are disclosed, negotiated, and paid. The goal: more transparency and flexibility for both buyers and sellers.

Whether you’re planning to list your home or buy one, here’s what to know about real estate agent fees, how much they typically cost, who pays them, and how the process works under the new rules.

Who pays the real estate agent commissions?

Traditionally, home sellers paid the commission for both their own listing agent and the buyer’s agent. However, under the 2024 NAR settlement, that has changed: Buyers are now responsible for compensating their own agent—unless otherwise negotiated.

That said, sellers can still choose to offer compensation to the buyer’s agent. Here’s how it works now:

Your agent must conspicuously disclose to you and obtain your approval for any payment or offer of payment that a listing broker will make to another broker acting for buyers.

This disclosure must be made to you in writing in advance of any payment or agreement to pay another broker acting for buyers, and must specify the amount or rate of such payment.

If you choose to approve an offer of compensation, there are changes to how this can happen.

You as the seller can still make an offer of compensation, but your agent cannot include it on a multiple listing service. An MLS is a local marketplace used by both buyer brokers and listing brokers to share information about properties for sale.

You as the seller can still offer buyer concessions on an MLS (for example, concessions for buyer closing costs).

If you choose to compensate a buyer’s agent

When the sellers set a listing price for the home, they usually take the real estate agent’s commission into account—and consider it the cost of doing business. (Here’s how to find a real estate agent in your area.)

Do you have to pay a real estate agent’s commission?

No—you’re not required to use a real estate agent when buying or selling a home. But going it alone means taking on all the responsibilities yourself.

Real estate agents bring experience in the following:

Pricing and market strategy

Listing and promotion (via the MLS and marketing channels)

Negotiating offers and terms

Managing paperwork and ensuring a smooth closing

Also, keep in mind: Agents are typically paid only when the sale closes, so their incentives are aligned with your success.

Can you negotiate real estate agent commission fees?

Yes. Real estate commission rates are negotiable. There are no federal or state laws that mandate a fixed rate.

While the standard commission is often between 5% and 6% of the sale price (split between buyer’s and seller’s agents), the actual rate depends on the following:

Local market conditions

Agent experience

Scope of services

You can also consider alternative models:

Transactional agreements: Limited service from a licensed agent for a flat fee or reduced commission

Discount brokerages: Online platforms or firms offering reduced rates in exchange for scaled-back service

What is dual agency in real estate?

It’s not a common situation in real estate, but if the agent you’ve hired to represent you also represents the seller of the house you’re buying, it’s called dual agency. Also known as transaction brokers, dual agents represent the interests of both the buyer and the seller.

Some states have made dual agency illegal in a real estate transaction to outright eliminate any question that the agent was neutral in representing the seller and the buyer. But in the states that allow dual agency, agents are required by law to disclose that they’ll be representing both sides to their clients.

Critics who advise against dual agency worry about potential conflicts of interest—the chance that the interests of both the buyer and seller will not be met.

What do closing costs cover?

Closing costs are the additional fees paid at the end of a real estate transaction—separate from the agent commission.

Loan processing and origination fees

Title company charges

Appraisal and survey fees

Recording fees

Homeowners insurance and property taxes (prorated)

HOA dues (if applicable)

The amount of the real estate closing costs will vary with each home sale/purchase and can range widely from 2% to 7% of the home’s purchase price. Typically, though, closing costs amount to about 3.5% of the sale price of a home, according to Leah Layman, a real estate agent in Augusta, GA.

Your agent will provide you with a buyer’s sheet outlining the closing costs. By federal law, you must receive a “good-faith” estimate of your closing costs from any lender you use in your real estate purchase.

Your negotiating skills (or your agent’s) come into play when it comes to who pays the closing costs. There is no cut-and-dried rule about who pays the closing costs—the seller or the buyer—but buyers usually cover the brunt of the costs (3% to 4% of the home’s price) compared with sellers (1% to 3%).

“Most closing costs are negotiable,” Layman says. “Do not let the agents or vendors convince you otherwise.”

Attorney fees, commission rates, recording costs, and messenger fees can all be negotiated down.

Sometimes, the buyer will have written into the contract that the seller will pay the buyer’s closing costs up to a certain percentage or amount.

“That’s why you need a good real estate agent to negotiate a contract for you,” Layman says.

If the closing costs are too steep and the sellers won’t chip in as much as buyers would like, the buyers can request that real estate closing costs be rolled into the mortgage.

How to know what you’ll pay in commissions and fees

All of the details about a real estate agent’s commission should be outlined in the contract that you sign when you hire an agent. This is typically referred to as a listing agreement, and it also specifies how long the agent will represent you. (Generally, listing agreements last 90 to 120 days.)

Also, keep in mind that there are some exceptions. For instance, rental agents work differently from purchase agents. It’s usually the landlord’s job to pay the rental agent’s fee, but that’s not set in stone.

Furthermore, the commission is usually higher when selling a vacant lot, since selling land often takes longer and requires more marketing dollars. Meanwhile, some auctions charge homebuyers a 5% “premium,” or commission.

As a seller, you want a real estate agent who can broker the best sales price and terms for you.

Remember, buying and selling a home might be the biggest financial transaction of your life, which is why you’ll want an expert on your side, even if that comes at an expense. Whether you’re the buyer or the seller, the listing price isn’t the only number you should focus on. Those fees outside the price of the house can add up, and you don’t want to be hit with any surprises late in the game.

To learn more, check out our Guide to Real Estate Commissions, which covers everything homebuyers and sellers need to know.

Allaire Conte contributed to this report.



This article was originally published by a www.realtor.com . Read the Original article here. .


Energy input prices increased in March at their fastest pace since June of 2020 as the conflict in Iran shocked critical global supply chains. Building material prices, excluding energy, rose for the eleventh straight month. Price growth for trade services slowed while transportation and warehousing price growth accelerated.  

The Producer Price Index for final demand increased 0.5% in March, after rising 0.5% in February. The index for final demand services was unchanged in March, while the index for final demand goods rose 1.6% over the month.

The price index for inputs to new residential construction rose 1.2% in March and was up 3.8% from last year. The price of goods used in new residential construction was up 1.8% over the month and up 4.3% from last year, while the price of services was up 0.3% over the month and up 3.1% from last year.

Input Goods

The goods component has a larger importance to the inputs to residential construction price index, representing around 60% of the total. On a monthly basis, the price of input goods to new residential construction was up 1.8% in March.

The input goods to residential construction index can be further broken down into two separate components, one measuring energy inputs with the other measuring remaining goods. The latter of these two components simply represents building materials used in residential construction, which makes up around 93% of the goods index.

Energy input prices rose 21.4% in March and were 20.8% higher than one year ago. The monthly increase in March was the largest since prices rose 30.6% in June 2020. Building material prices were up 0.4% in March and up 3.1% compared to one year ago.

Among input goods, the largest year-over-year increase was for No. 2 diesel fuel as prices were 51.2% higher than a year ago. Metal molding and trim continued to show high price increases, as there were up 45.5% from last year. On the opposite end, the largest yearly declines in prices were for particleboard and fiberboard with prices down 15.7%. Notably, asphalt reported a price decline of 12.3% in March. For key inputs, ready-mix concrete prices were 0.5% higher than a year ago while softwood lumber prices were 7.8% lower than a year ago.

Input Services

Prices for service inputs to residential construction reported an increase of 0.3% in March. On a year-over-year basis, service input prices were up 3.1%. The price index for service inputs to residential construction can be broken out into three separate components: a trade services component, a transportation and warehousing services component, and a services excluding trade, transportation, and warehousing component (other services).

The most significant component is trade services (around 60%), followed by other services (around 29%), and finally transportation and warehousing services (around 11%). The largest component, trade services, was up 3.3% from a year ago. The price of transportation and warehousing services rose 6.2%, while prices for other services were up 1.5% over the year.

Expanded Inputs to New Construction Data

Within the PPI that BLS publishes, new experimental data was recently published regarding inputs to new construction. The data expands existing inputs to industry indexes by incorporating import prices with prices for domestically produced goods and services. With this additional data, users can track how industry input costs are changing among domestically produced products and imported products. This data focuses on new construction, but the complete dataset includes indices across numerous industries that can be found here on BLS website.

New construction input prices are primarily influenced by domestically produced goods and services, with domestic products accounting for 90% of the weight of the industry index for new construction. Imported goods make up the remaining 10% of the index.

The latest available data, for January 2026, showed that domestically produced goods continue to show price growth compared to imported goods used in new construction. On a year-over-year basis, the index for domestic goods increased 2.6%, while prices for imported goods have fallen 2.7%.


This article was originally published by a eyeonhousing.org . Read the Original article here. .


Single-family construction lending fell in the fourth quarter, according to data released by the Federal Deposit Insurance Corporation (FDIC). The decline in the outstanding volume of acquisition, development and construction (AD&C) loans occurred even with two Federal Reserve rate cuts in the fourth quarter. Additionally, NAHB’s AD&C Financing Survey points to continued tightening in credit conditions in the fourth quarter notwithstanding the latest decline in financing rates. Economic uncertainty remains a leading factor behind the persistence of tighter financing conditions for residential construction.

In the fourth quarter of 2025, the total level of outstanding AD&C loans fell to $456.3 billion, down 1.5% from the third quarter. The quarterly decline was led by a drop in other real estate development loans, which decreased 1.8% over the quarter to $365.2 billion. Meanwhile, the volume of 1-4 family residential construction and land development loans declined to $91.1 billion in the fourth quarter, down 0.2% from a quarter earlier. Although the volume of 1-4 family residential construction loans fell over the quarter, the outstanding amount was up 1.7% from last year. This marked the second straight quarter showing a year-over-year increase.

It is worth noting that the FDIC data represent only the stock of loans, not changes in the underlying flows, so it is an imperfect data source. Nonetheless, lending remains much reduced compared with years past. The current amount of existing 1-4 family residential AD&C loans now stands 56% lower than the peak level of residential construction lending of $204 billion reached during the first quarter of 2008. Alternative sources of financing, including equity partners, have supplemented this capital market in recent years.

Quality Metrics of Construction Loans

The volume of loans that are 30+ days past due or nonaccrual status fell for the third consecutive quarter, to $985.3 million. As a share of the total 1-4 family residential construction loan volume, this accounts for 1.1%.

Breaking this out further, the level of loans 30-89 days past due was $414.6 million, while the volume in nonaccrual status was $522.1 million. The nonaccrual loan volume fell from $593.4 million in the third quarter and the 30-89 past due volume fell from $418.5 million.

Loans are classified as nonaccrual when one or more of the following conditions apply: the loan is 90 days or more past due on principal or interest (unless it is well-secured and in the process of collection); the bank no longer expects full repayment of principal and interest; or the borrower’s financial condition has significantly deteriorated, warranting cash-basis accounting.

Which Size Banks are Lending?

Of the outstanding $91.1 billion in 1-4 family residential constructions loans, banks between $1 billion and $10 billion in total assets held the largest share at $32.2 billion (35.3%) at the end of 2025. Banks with assets between $10 and $250 held the next largest share at $30.1 billion (33.0%). The smallest banks, those with under $1 billion in assets, held $19.8 billion (21.7%) while the largest banks, with over $250 billion in total assets, had $9.0 billion (9.9%).

The distribution of banks holding 1-4 family residential construction loans is significantly different from the composition of all bank assets. At the end of 2025, the total amount of assets held by FDIC-insured banks was $25.26 trillion. Most of the banking industry’s assets are held by banks with over $250 billion in total assets, at 60.3%. This large bank asset group is comprised of just 16 banks as of the fourth quarter of 2025. Banks with between $10 billion and $250 billion in total assets held 25.3% of the industry’s total assets, as banks with $1 billion to $10 billion held 10.1%. Banks with under $1 billion in total assets had a market share of 4.3%.


This article was originally published by a eyeonhousing.org . Read the Original article here. .


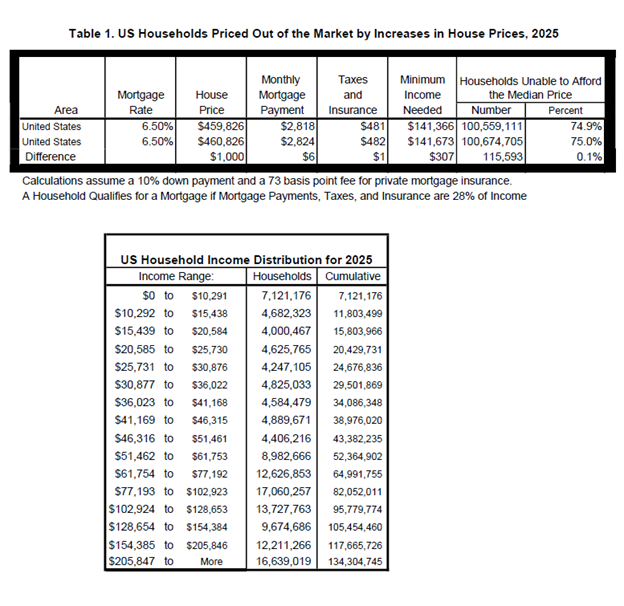
Housing affordability remains a critical issue, with 74.9% of U.S. households unable to afford a median-priced new home in 2025, according to NAHB’s latest analysis. With a median price of $459,826 and a 30-year mortgage rate of 6.5%, this translates to around 100.6 million households priced out of the market, even before accounting for further increases in home prices or interest rates. A $1,000 increase in the median price of new homes would price an additional 115,593 households out of the market.

The 2024 priced-out estimates for all states and the District of Columbia and over 300 metropolitan statistical areas are shown in the interactive map below. It highlights the growing housing affordability challenges across the United States. In 23 states and the District of Columbia, over 80% of households are priced out of the median-priced new home market. This indicates a significant disconnect between rising home prices and household incomes.

Maine stands out as the state with the highest share of households (91.2%) unable to afford the state’s median new home price of $682,223. High-cost states such as Connecticut and Rhode Island follow closely, with 88.3% and 87.8% of households, respectively, struggling to afford new homes. Even in states with relatively lower median new home prices, affordability remains a major concern. For example, in Mississippi, where the median home price is $275,333, 70.2% of households still find these new homes out of reach. Meanwhile, Delaware, the state with better affordability in the analysis, has a median new home price of $373,666. However, around 58.2% of households in Delaware still struggle to afford a new home. Even modest price increases, such as an additional $1,000, could push thousands more households from affording these median priced new homes. For instance, in Texas, such an increase could price out over 11,000 households.

It also shows the 2025 priced-out estimates for over 300 metropolitan statistical areas. The analysis estimates how many households in each metro area earn enough income to qualify for mortgages on median-priced new homes. In high-cost areas like the San Jose-Sunnyvale-Santa Clara, CA metro area, where new homes largely target high-income Silicon Valley residents, only 10% of all households meet the minimum income threshold of $437,963 required to qualify for a loan on a median priced new home. In contrast, in more affordable metro areas like Sierra Vista-Douglas, AZ, where the median new home price is $150,893, nearly two-thirds of households can afford a median priced new home. While higher home prices generally result in higher monthly mortgage payments and higher income thresholds, the relationship between home prices and affordability is not always linear. Factors like property taxes and insurance payments can also significantly impact monthly housing costs, adding complexity to affordability calculations.

The affordability of new homes together with the population size of a metro area, significantly influence the priced-out impact of a $1,000 increase in new home prices. In metro areas where new homes are already unaffordable to most households, the effect of such an increase tends to be small. For instance, in the San Jose-Sunnyvale-Santa Clara, CA metro area, an additional $1,000 increase to the home price affects only 259 households, as only 10% of all households could afford such expensive new homes in the first place. Here, the additional price increase only affects a narrow share of high-income households at the upper end of the income distribution, where affordability is already stretched.

In contrast, metro areas, where new homes are more broadly affordable, experience a larger priced-out effect. A $1,000 increase in the median new home price affects a larger share of households in the “thicker part” of the income distribution. For example, in the Dallas-Fort Worth-Arlington, TX metro area, a $1,000 increase in new home price would disqualify 2,882 households from affording a median-priced new home. This is the largest priced-out effect among all metro areas, driven by the combination of relatively moderate home prices and a substantial population base.

More details, including priced-out estimates for every state and over 300 metropolitan areas, and a description of the underlying methodology, are available in the full study.

Discover more from Eye On Housing

Subscribe to get the latest posts sent to your email.


This article was originally published by a eyeonhousing.org . Read the Original article here. .


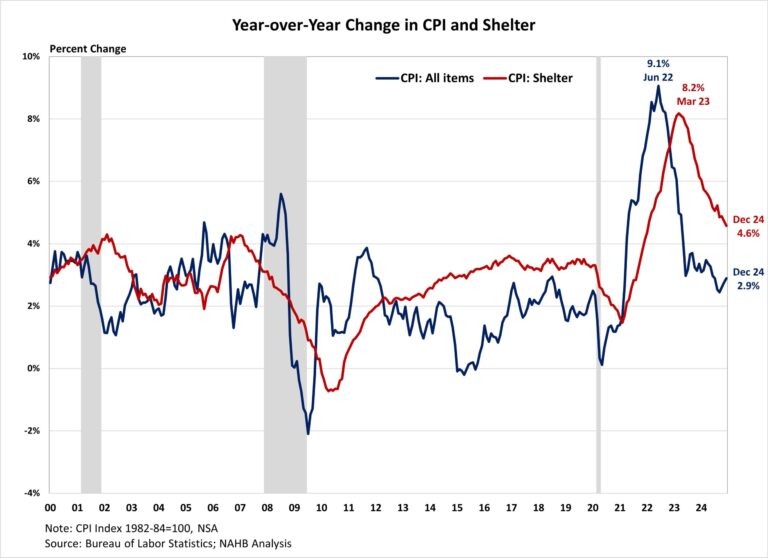
Inflation edged up to a five-month high in December as energy prices surged, accounting for more than 40% of the monthly headline increase. Inflation ended 2024 at a 2.9% rate, down from 3.4% a year ago, although the last mile to the Fed’s 2% target continues to be challenging. While core inflation remained stubborn due to elevated shelter and other service costs, housing costs showed signs of cooling – the year-over-year change in the shelter index remained below 5% for a fourth straight month and posted its lowest annual gain since January 2022, suggesting a continued moderation in housing inflation.

While the Fed’s interest rate cuts could help ease some pressure on the housing market, its ability to address rising housing costs is limited, as these increases are driven by a lack of affordable supply and increasing development costs. In fact, tight monetary policy hurts housing supply because it increases the cost of AD&C financing. This can be seen on the graph below, as shelter costs continue to rise at an elevated pace despite Fed policy tightening. Additional housing supply is the primary solution to tame housing inflation.

Furthermore, the election result has put inflation back in the spotlight and added additional   risks to the economic outlook. Proposed tax cuts and tariffs could increase inflationary pressures, suggesting a more gradual easing cycle with a slightly higher terminal federal funds rate. However, economic growth could also be higher with lower regulatory burdens. Given the housing market’s sensitivity to interest rates, a higher inflation path could extend the affordability crisis and constrain housing supply as builders continue to grapple with lingering supply chain challenges. During the past twelve months, on a non-seasonally adjusted basis, the Consumer Price Index rose by 2.9% in December, according to the Bureau of Labor Statistics’ report. This followed a 2.7% year-over-year increase in November. Excluding the volatile food and energy components, the “core” CPI increased by 3.2% over the past twelve months, after holding steady at 3.3% for three months. The component index of food rose by 2.5%, while the energy component index fell by 0.5%.

On a monthly basis, the CPI rose by 0.4% in December on a seasonally adjusted basis, after a 0.3% increase in November. The “core” CPI increased by 0.2% in December, after rising  0.3% for three consecutive months.

The price index for a broad set of energy sources rose by 2.6% in December, with increases across all categories including gasoline (+4.4%), fuel oil (+4.4%), natural gas (+2.4%) and electricity (+0.3%). Meanwhile, the food index rose 0.3%, after a 0.4% increase in November. Both indexes for food away from home and food at home increased by 0.3%.

The index for shelter (+0.3%) was the largest contributor to the monthly increase in all items index, accounting for nearly 37% of the total increase. Other top contributors that rose in December include indexes for airline fares (+3.9%), used cars and trucks, (+1.2%) and new vehicles (+0.5%). Meanwhile, the index for personal care (-0.2%) was among the few major indexes that decreased over the month. The index for shelter makes up more than 40% of the “core” CPI, rose by 0.3% in December, the same increase last month. Both indexes for owners’ equivalent rent (OER) and rent of primary residence (RPR) increased by 0.3% over the month. Despite the moderation, shelter costs remained the largest contributors to headline inflation.

NAHB constructs a “real” rent index to indicate whether inflation in rents is faster or slower than overall inflation. It provides insight into the supply and demand conditions for rental housing. When inflation in rents is rising faster than overall inflation, the real rent index rises and vice versa. The real rent index is calculated by dividing the price index for rent by the core CPI (to exclude the volatile food and energy components). In December, the Real Rent Index rose by 0.1%. Over the twelve months of 2024, the monthly growth rate of the Real Rent Index averaged 0.1%, slower than the average of 0.2% in 2023.

Discover more from Eye On Housing

Subscribe to get the latest posts sent to your email.


This article was originally published by a eyeonhousing.org . Read the Original article here. .


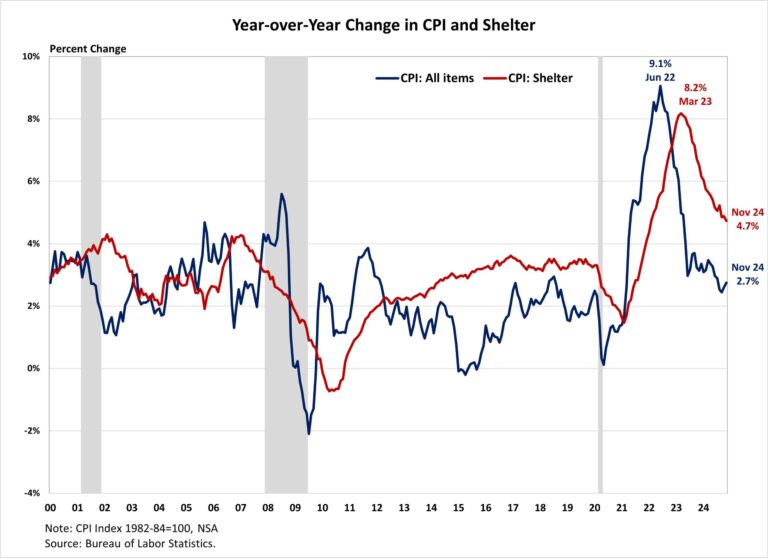
Inflation picked up to 2.7% in November, while matching expectations, the last mile to the Fed’s 2% target proves to be the most challenging. Shelter costs continued to be the main driver of inflation, contributing nearly 40% of the monthly increase. However, the year-over-year change in the shelter index remained below 5% for a third straight month and posted its lowest annual gain since February 2022, suggesting moderation in housing inflation.

While the Fed’s interest rate cuts could help ease some pressure on the housing market, its ability to address rising housing costs is limited, as these increases are driven by a lack of affordable supply and increasing development costs. In fact, tight monetary policy hurts housing supply because it increases the cost of AD&C financing. This can be seen on the graph below, as shelter costs continue to rise at an elevated pace despite Fed policy tightening. Additional housing supply is the primary solution to tame housing inflation.

Furthermore, the election result has put inflation back in the spotlight and added some downside risks to the economic outlook. Proposed tax cuts and tariffs could increase inflationary pressures, suggesting a more gradual easing cycle with a slightly higher terminal federal funds rate. Given the housing market’s sensitivity to interest rates, this could extend affordability crisis and constrain housing supply as builders continue to grapple with lingering supply chain challenges.

During the past twelve months, on a non-seasonally adjusted basis, the Consumer Price Index (CPI) rose by 2.7% in November, according to the Bureau of Labor Statistics’ report. This followed a 2.6% year-over-year increase in October. Excluding the volatile food and energy components, the “core” CPI increased by 3.3% over the past twelve months, the same increase as in the previous two months. The component index of food rose by 2.4%, while the energy component index fell by 3.2%.

On a monthly basis, the CPI rose by 0.3% in November on a seasonally adjusted basis, after a 0.2% increase in October. The “core” CPI increased by 0.3% in November, the same increase as in the past three months.

The price index for a broad set of energy sources rose by 0.2% in November, with declines in electricity (-0.4%) offset by increases in gasoline (+0.6%), natural gas (+1.0%) and fuel oil (+0.6%). Meanwhile, the food index rose 0.4%, after a 0.2% increase in October. The index for food away from home increased by 0.3% and the index for food at home rose by 0.5%.

The index for shelter (+0.3%) was the largest contributor to the monthly increase in all items index, accounting for nearly 40% of the total increase. Other top contributors that rose in November include indexes for used cars and trucks (+2.0%), household furnishings and operations (+0.6%), medical care (+0.3%) and new vehicles (+0.6%). Meanwhile, the index for communication (-1.0%) was among the few major indexes that decreased over the month.

The index for shelter makes up more than 40% of the “core” CPI, rose by 0.3% in November after a 0.4% in October. Both indexes for owners’ equivalent rent (OER) and rent of primary residence (RPR) increased by 0.2% over the month. For the rent index, it was the smallest monthly increase since April 2021 and July 2021. Despite the moderation, shelter costs remained the largest contributors to headline inflation. 

NAHB constructs a “real” rent index to indicate whether inflation in rents is faster or slower than overall inflation. It provides insight into the supply and demand conditions for rental housing. When inflation in rents is rising faster than overall inflation, the real rent index rises and vice versa. The real rent index is calculated by dividing the price index for rent by the core CPI (to exclude the volatile food and energy components).

In November, the Real Rent Index fell by 0.1%, marking its first negative reading since December 2021. Over the first eleven months of 2024, the monthly growth rate of the Real Rent Index averaged 0.1%, slower than the average of 0.2% in 2023.

Discover more from Eye On Housing

Subscribe to get the latest posts sent to your email.


This article was originally published by a eyeonhousing.org . Read the Original article here. .


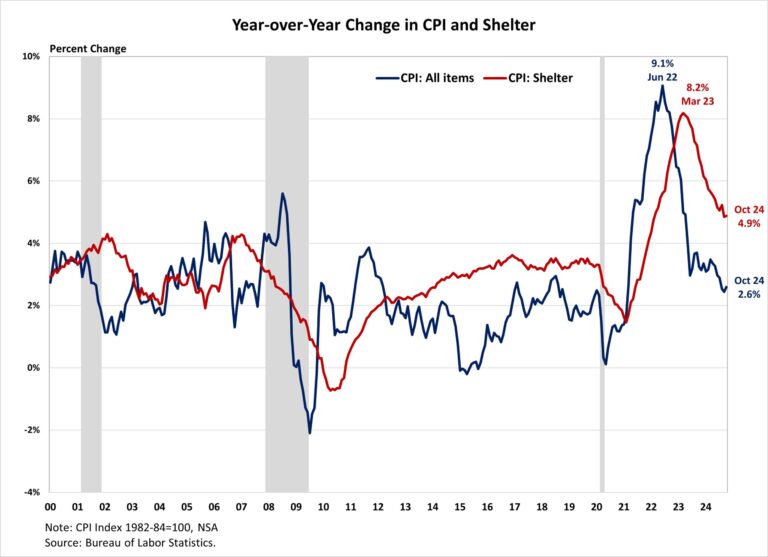
Inflation picked up again in October, showing the last mile to the 2% target will be the hardest. Shelter costs remained the main driver of inflation, accounting for over 65% of the 12-month increase in the all items less food and energy index. However, the year-over-year change in the shelter index has been below 5% for the second consecutive month, signaling some moderation in housing inflation.

While the Fed’s interest rate cuts could help ease some pressure on the housing market, its ability to address rising housing costs is limited, as these increases are driven by a lack of affordable supply and increasing development costs. In fact, tight monetary policy hurts housing supply because it increases the cost of AD&C financing. This can be seen on the graph below, as shelter costs continue to rise at an elevated pace despite Fed policy tightening. Additional housing supply is the primary solution to tame housing inflation.

Furthermore, the 2024 election result has put inflation back in the spotlight and added some downside risks to the economic outlook. Proposed tax cuts and tariffs could increase inflationary pressures, suggesting a more gradual easing cycle with a slightly higher terminal federal funds rate. Given the housing market’s sensitivity to interest rates, this could extend affordability crisis and constrain housing supply as builders continue to grapple with lingering supply chain challenges.

The Bureau of Labor Statistics reported that the Consumer Price Index (CPI) rose by 0.2% in October on a seasonally adjusted basis, the same increase seen over the previous three months. Excluding the volatile food and energy components, the “core” CPI increased by 0.3% in October, the same increase as in August and September.

The price index for a broad set of energy sources remained unchanged in October, with declines in gasoline (-0.9%) and fuel oil (-4.6%) offset by increases in electricity (+1.2%) and natural gas (+0.3%). Meanwhile, the food index rose 0.2%, after a 0.4% increase in September. The index for food away from home increased by 0.2% and the index for food at home rose by 0.1%.

The index for shelter (+0.4%) was the largest contributor to the monthly increase in all items index, accounting for over 50% of the total increase. Other top contributors that rose in October include indexes for used cars and trucks (+2.7%), airline fares (+3.2%), medical care (+0.3%) and recreation (+0.4%). Meanwhile, the top contributors that experienced a decline include indexes for apparel (-1.5%), communication (-0.6%) and household furnishings and operations (-0.1%).

The index for shelter makes up more than 40% of the “core” CPI. The index saw a 0.4% rise in October, following an increase of 0.2% in September. The indexes for owners’ equivalent rent (OER) and rent of primary residence (RPR) increased by 0.4% and 0.3% over the month. These gains have been the largest contributors to headline inflation in recent months. 

During the past twelve months, on a non-seasonally adjusted basis, the CPI rose by 2.6% in October, following a 2.4% increase in September. The “core” CPI increased by 3.3% over the past twelve months, the same increase as in September. The food index rose by 2.1%, while the energy index fell by 4.9%.

NAHB constructs a “real” rent index to indicate whether inflation in rents is faster or slower than overall inflation. It provides insight into the supply and demand conditions for rental housing. When inflation in rents is rising faster than overall inflation, the real rent index rises and vice versa. The real rent index is calculated by dividing the price index for rent by the core CPI (to exclude the volatile food and energy components).

In October, the Real Rent Index remained unchanged for the second consecutive month. Over the first ten months of 2024, the monthly growth rate of the Real Rent Index averaged 0.1%, slower than the average of 0.2% in 2023.

Discover more from Eye On Housing

Subscribe to get the latest posts sent to your email.


This article was originally published by a eyeonhousing.org . Read the Original article here. .


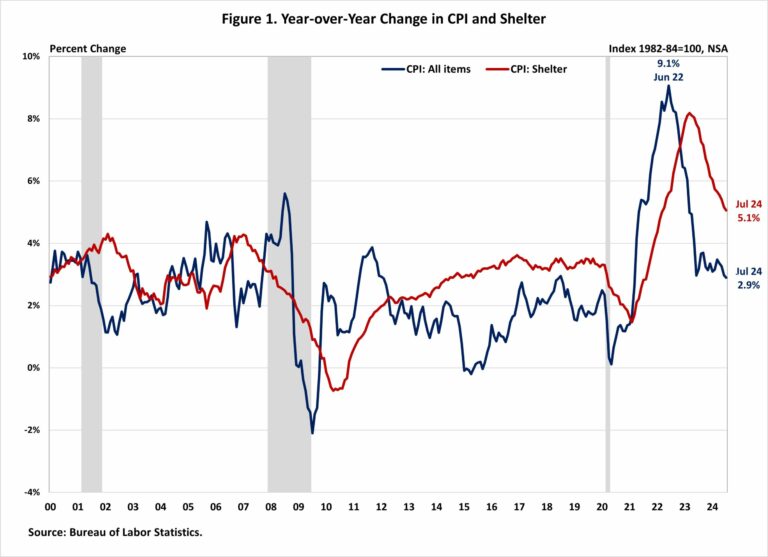
Inflation dropped below a 3% annualized growth rate for the first time since March 2021 even though housing costs continue to climb. Nonetheless, the headline reading is another dovish signal for future monetary policy, following signs of weakness in the most recent job report.   

Despite a slowdown in the year-over-year increase, shelter costs continue to exert significant upward pressure on inflation, contributing nearly 90% of the monthly increase in overall inflation and over 70% of the total 12-month increase in core inflation. As consistent disinflation and a cooling labor market bring the economy into better balance, the Fed is likely to further solidify behind the case for rate cuts, which could help ease some pressure on the housing market.

The Fed’s ability to address rising housing costs is limited because increases are driven by a lack of affordable supply and increasing development costs. Additional housing supply is the primary solution to tame housing inflation. However, the Fed’s tools for promoting housing supply are constrained. In fact, further tightening of monetary policy would hurt housing supply because it would increase the cost of AD&C financing. This can be seen on the graph below, as shelter costs continue to rise despite Fed policy tightening. Nonetheless, the NAHB forecast expects to see shelter costs decline further in the coming months.  This is supported by real-time data from private data providers that indicate a cooling in rent growth.

The Bureau of Labor Statistics reported that the Consumer Price Index (CPI) rose by 0.2% in July on a seasonally adjusted basis, after declining 0.1% in June. Excluding the volatile food and energy components, the “core” CPI increased by 0.2% in July, after a 0.1% increase in June.

The price index for a broad set of energy sources remained flat in July, with increases in electricity (+0.1%) and fuel oil (+0.9%) offsetting a decline in natural gas (-0.7%). The natural gas index was unchanged in July. Meanwhile, the food index rose 0.2%, as it did in June. The index for food away from home increased by 0.2% and the index for food at home rose 0.1%.

In July, the index for shelter (+0.4%) continued to be the largest contributor to the monthly increase in all items index. Among other top contributors that rose in July include indexes for motor vehicle insurance (+1.2%) as well as household furnishings and operations (+0.3%). Meanwhile, the top contributors that experienced a decline in July include indexes for used cars and trucks (-2.3%), medical care (-0.2%), airline fares (-1.6%), and apparel (-0.4%). The index for shelter makes up more than 40% of the “core” CPI. The index saw a 0.4% rise in July, following an increase of 0.2% in June. The indexes for owners’ equivalent rent (OER) increased by 0.4% and rent of primary residence (RPR) rose by 0.5% over the month. These gains have been the largest contributors to headline inflation in recent months. 

During the past twelve months, on a non-seasonally adjusted basis, the CPI rose by 2.9% in July, following a 3.0% increase in June. The “core” CPI increased by 3.2% over the past twelve months, following a 3.3% increase in June. This was the slowest annual gain since April 2021. Over the past twelve months, the food index rose by 2.2%, and the energy index increased by 1.1%. This marks the fifth consecutive month of year-over-year increases for the energy index since February 2024.

NAHB constructs a “real” rent index to indicate whether inflation in rents is faster or slower than overall inflation. It provides insight into the supply and demand conditions for rental housing. When inflation in rents is rising faster than overall inflation, the real rent index rises and vice versa. The real rent index is calculated by dividing the price index for rent by the core CPI (to exclude the volatile food and energy components). In July, the Real Rent Index rose by 0.3%, after a 0.2% increase in June. Over the first seven months of 2024, the monthly growth rate of the Real Rent Index averaged 0.1%, slower than the average of 0.2% in 2023.

Discover more from Eye On Housing

Subscribe to get the latest posts sent to your email.


This article was originally published by a eyeonhousing.org . Read the Original article here. .

Pin It