Tag

Burdens

Browsing


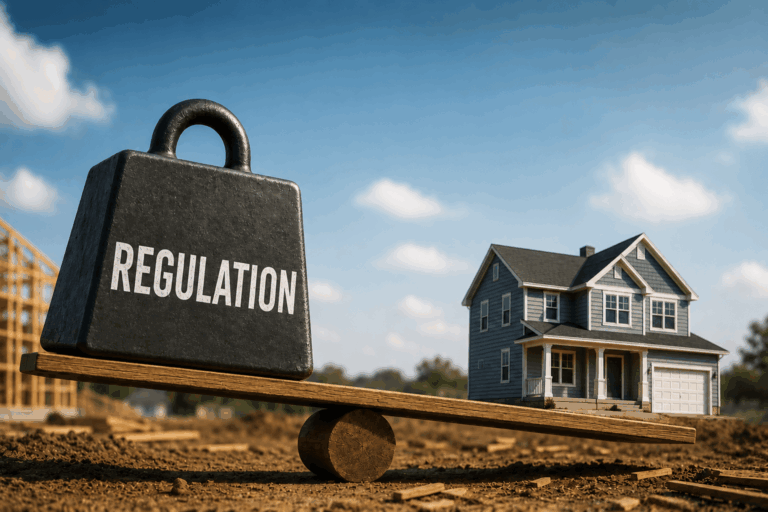
A new NAHB study shows that, on average, regulations imposed by government at all levels account for $131,734, or 26.4%, of the final price of a new single-family home built for sale. Of this amount, $46,795 is due to a higher price for the finished lot, attributable to regulations imposed during the lot’s development. The remaining $84,939 is the result of regulatory costs imposed on the builder during construction, after the builder purchases the finished lot.

The individual line items in the above figure range from under $2,000 per home for the pure cost of delay during the construction phase of the project, to more than $40,000 for changes in building codes over the past 10 years.

Results show that the cost of regulation climbed at its fastest rate between consecutive surveys. The current estimate of $131,734 is over 40% higher than the $93,871 figure from the 2021 study, and more than double the NAHB’s initial estimate of $65,224 back in 2011.

The estimate of $46,795 in regulatory costs incurred during lot development is based largely on the “Land Developer Survey on Regulatory Costs” conducted by NAHB in March of 2026. The $84,939 estimate of regulatory costs during the construction phase is based largely on questions in the March 2026 survey for the NAHB/Wells Fargo Housing Market Index (HMI). Data from the two surveys were combined with information on average construction times, interest rates, profit margins etc. to produce estimates of regulatory costs as a percentage—either of the price of a lot purchased by a builder, or of the builder’s narrowly defined cost of construction. The percentages were then converted to dollars using the January 2026 average new home price of $499,500 from the first release of the U.S. Census Bureau’s New Residential Sales report. For more information on the methodology, including both survey questionnaires and a complete documentation of all other information incorporated into the estimates, please consult the full study.

Regulatory costs are one of several factors, including record increases of tariff rates on building materials, ongoing skilled labor shortage, a dearth of available lots and tighter lending conditions, currently limiting the supply of housing—particularly housing for the entry-level market, where additional inventory is most needed.


This article was originally published by a eyeonhousing.org . Read the Original article here. .
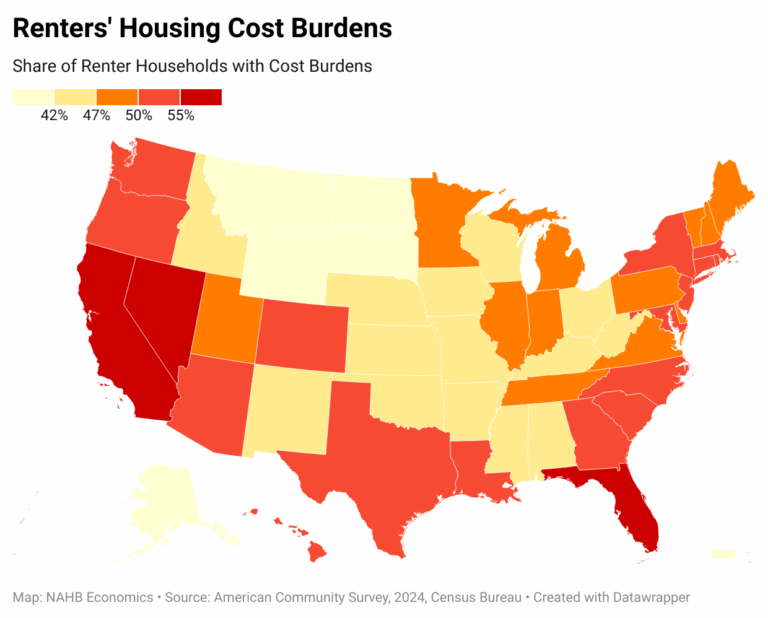

The housing affordability crisis continues to disproportionately affect renters, with more than half of renter households experiencing high-cost burdens — i.e., paying 30% or more of their income on rent and utilities. At the same time, current home owners, buoyed by significant home equity gains and locked in by below-market mortgage rates, are in a more advantageous financial position to weather the growing affordability crisis. According to the latest 2024 American Community Survey (ACS), more than half of all renter households (50.3%), or 23.2 million, are burdened by housing costs. Among home owners, this share is less than a quarter (24.3%) representing 21 million households. As a result, states and counties with higher shares of renters in their housing markets are more likely to have higher overall shares of households with cost burdens.

Geographically, Florida, Nevada, and California have the largest concentration of cost-burdened renters. In Florida, 60% of all renters pay more than 30% of their income on rent and utilities. In Nevada, the share is 57%, and in California, 55% of renters experience housing cost burdens. Even in states with comparatively low renter cost-burden rates—such as South Dakota, Alaska, and North Dakota—more than one-third of renters still spend 30% or more of their income on housing.

For home owners, cost-burden rates are generally lower, but the geographic pattern mirrors that of renters. California, Florida, and several Northeastern states report the highest shares of cost-burdened home owners. California faces the most severe affordability challenges, with one in three owners paying more than 30% of their income for housing. Florida and Hawaii follow closely, with 31% of existing home owners struggling to afford their homes.

At the opposite end of the spectrum, nine states in the Midwest and South report that fewer than 20% of homeowners are cost-burdened. West Virginia and North Dakota have the lowest rates, at just 16%.


This article was originally published by a eyeonhousing.org . Read the Original article here. .
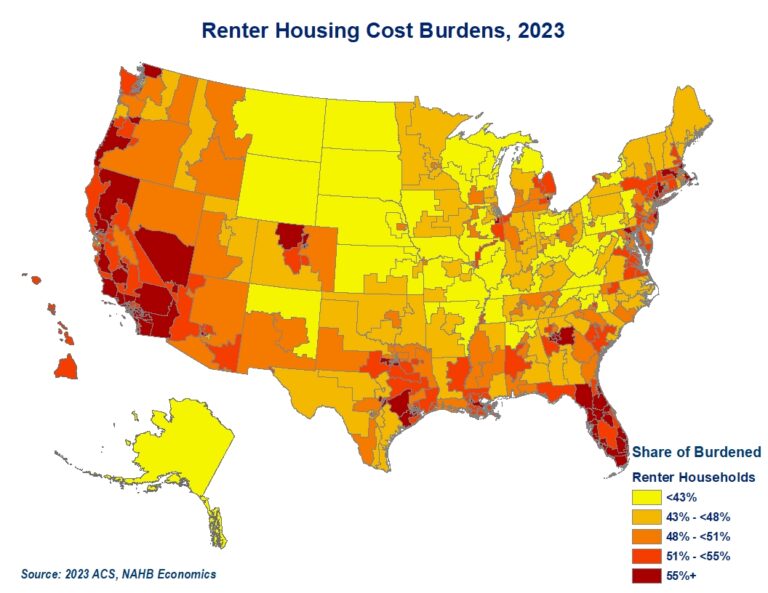

While the lack of affordable housing dominates the headlines across the nation, congressional districts with higher shares of renter households are disproportionately affected by the current affordability crisis. Geographically, the districts with the largest housing cost burdens are heavily concentrated in California, Florida, and the coastal Northeast.

Buoyed by significant home equity gains and locked in by below-market mortgages rates, current home owners are in a more advantageous financial position to weather the growing affordability crisis. At the same time, renters are facing the worst affordability on record. According to the latest 2023 American Community Survey (ACS), more than half of all renter households, or 23 million, spend 30 percent or more of their income on housing, and therefore are considered burdened by housing costs. Among home owners, the share of households that are cost burdened is less than a quarter (24%). Nevertheless, this amounts to 20.6 million owner households who experience housing cost burdens. As a result, congressional districts where housing markets are dominated by renters are more likely to register higher overall shares of households with cost burdens.

In a typical congressional district, about a third of all households, renters and owners combined, experience housing cost burdens. In contrast, in the ten congressional districts with the highest burden rates, more than half of all households spend 30% or more of their income on housing.

The highest burden rates are found in five districts each in California and New York and two in Florida (see the chart above). In New York’s 15th and 13th, 55% and 52% of households, respectively, are burdened with housing costs. The vast majority of these households are renters, as reflected by the low homeownership rates in these districts, 16% and 13%, respectively. Similarly, the remaining top 10 districts with the highest shares of burdened households have homeownership rates well below the national average of 65%. On the list, only Florida’s 20th and 24th have homeownership rates that exceed 50%. Since congressional districts are drawn to represent roughly the same number of people, higher shares typically translate into larger counts of cost burdened households. To capture any remaining differences, the size of the bubbles in the chart correlates with the overall number of burdened households.

On the rental side, nine out of eleven worst burdened districts are in Florida. Close to two thirds of renters in Florida’s 26th, 20th, 25th and 19th are burdened with housing costs. The renter burden rates are similarly high in Florida’s 28th, 21st, 24th, 13th, and 23rd, where the shares of housing cost burdened renters are between 63% and 64%. Only California’s 27th and 29th register slightly higher burden shares exceeding 64%. At the other end of the spectrum is Wisconsin’s 7th, where just a third of renter households experience housing cost burdens.

Florida, New York, and California stand out for simultaneously having congressional districts with the highest shares of cost burdened renters and owners. The heaviest owner burden rates dozen consists of five congressional districts in New York and California each and two in Florida. In New York’s 9th and 8th districts, 43% and 42% of home owners, respectively, spend 30% of more of their income on housing. While high property taxes contribute heavily to owners’ burden in New York and California, fast rising insurance premiums strain home owners’ budgets in Florida.

The list of congressional districts with the lowest ownership burden rates include Alabama’s 5th, West Virginia’s 1st and 2nd, North Dakota’s at-Large, South Carolina’s 4th, Indiana’s 4th, 5th, and 6th, Arkansas 3rd, Tennessee’s 2nd, Missouri’s 3rd and 6th. Less than 17% of home owners in these districts spend 30% of their income or more on housing.

Additional housing data for your congressional district are provided by the US Census Bureau here.

Discover more from Eye On Housing

Subscribe to get the latest posts sent to your email.


This article was originally published by a eyeonhousing.org . Read the Original article here. .

Pin It