Nationally, nearly 140 million people in the United States routinely commuted to work, according to NAHB analysis of the 2023 American Community Survey data. Among these people, approximately 23.8 million people spent more than 90 minutes each day going to and from their place of employment, and nearly 12.5 million commuters traveled at least 120 minutes daily.
According to the Nobel Prize winner Daniel Kahneman’s research (2004), “commuting to work” was one of the least enjoyable activities and was most frequently associated with negative feelings during the day. While much research has revealed that longer commute times are associated with lower happiness and well-being, research by political scientists Benjamin Newman, Joshua Johnson, and Patrick Lown found that commuting significantly decreases political participation. People with long commute times are less involved in politics.
As the presidential election approaches, it is worth noting the variation in commute times across congressional districts. By analyzing the data from the American Community Survey (ACS) 1-year estimates, we summarize trends in the mean travel time among U.S. workers between 2010 and 2023 and also provide a deeper understanding of geographic patterns and the variation in commute times across congressional districts. In this article, “mean travel time to work” is calculated by dividing the total one-way commute time by the number of workers who commute. It indicates the average time workers spend traveling from home to work daily.
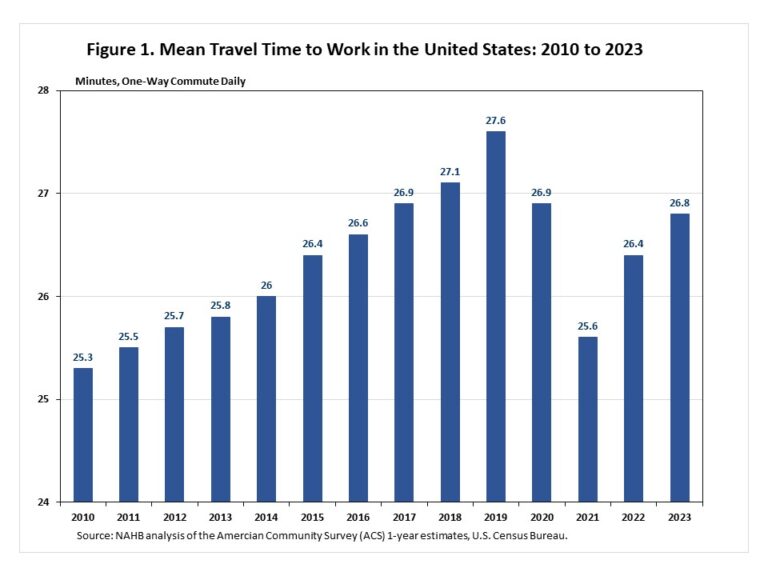
From 2010 to 2019, the mean travel time to work in the United States increased every year. In 2021, the COVID-19 pandemic led to a significant increase in remote work, meanwhile, the mean travel time to work decreased dramatically. Since then, the mean travel time to work increased by 1.2 minutes to 26.8 minutes in 2023 but remained below its historic high of 27.6 minutes in 2019.
Commute times vary across congressional districts and show geographical patterns. The map above illustrates the variation in the mean travel time to work in 2023 by five categories from light teal to dark blue (data is not available for Texas’s 27th congressional district). The lightest teal represents these congressional districts where people spend 17.2 – 19.9 minutes traveling to work daily, while the dark blue marks these congressional districts where people spend 35 minutes or more traveling to work daily, on average.
Noticeably, most people in the Mountain and West North Central Divisions have smaller travel times than those in the coastal states. In the least mean travel time category (between 17.2 and 19.9 minutes), there are 12 congressional districts in total. These include two congressional districts in both Nebraska and Iowa, one in Kansas, Texas, Montana, and Oregon, and four at-large congressional districts in South Dakota, North Dakota, Wyoming, and Alaska. Nebraska’s 3rd congressional district, one of the largest non-at-large districts in the United States, had the least mean travel time to work among all 436 congressional districts. People from Nebraska’s 3rd district spent only 17.2 minutes traveling to work on average and 80% of them drove alone to work. It was followed by Kansas’s 1st congressional district and Texas’s 19th congressional district.
Within the top mean travel time category, people spend 35 minutes or more traveling to work daily. It includes 12 congressional districts in New York, three in California, two in Maryland, and one in both Virginia and New Jersey.
It is no surprise that New York had the longest commute time in the United States. The mean travel time to work was 32.8 minutes daily, on average. Out of 26 congressional districts in New York, 18 of them had higher mean travel time to work than the national average of 26.8 minutes. The top eight congressional districts with the highest mean travel time to work were all in New York.
A larger share of people who worked outside their county of residence partially explains longer commute times in congressional districts where people spent 35 minutes or more traveling to work daily. For example, New York’s 5th congressional district, with the highest mean travel time to work of 45.5 minutes, reported that 45.3% of people worked outside their county of residence. Meanwhile, congressional districts in the least mean travel time category reported a significantly smaller share of people who worked outside their county of residence. Only 18% of people in Nebraska’s 3rd congressional district worked outside their county of residence. The majority of people in these districts worked in their county of residence.
Housing is a key issue for long commute times as it affects the distance between home and work. The results from NAHB’s HBGI showed that since the beginning of the COVID-19 pandemic housing demand has shifted from higher-density core areas to low-density markets, where homes are larger and more affordable. Additionally, a published study (2022) found that lack of affordable housing increased commute times as people moved to lower-cost housing in the outer reaches of major metro areas. To reduce commute times, the authors suggest creating and preserving dedicated affordable housing units, changing zoning to allow for more housing development, relaxing housing regulations to facilitate higher-density development, increasing government housing subsidies, and adopting tenant protections.
Additional data for your congressional district are provided by the US Census Bureau here.
Discover more from Eye On Housing
Subscribe to get the latest posts sent to your email.


I think of this as the first-aid kit phenomenon: When you need a Band-Aid, you may also need some antibiotic ointment, maybe some tweezers to remove a splinter, and a gauze pad. In a first-aid kit, everything you need to complete the task of caring for your injury is conveniently located in one place.
When you’re organizing your stuff, remember this and group everything you need to complete a task in the same place. For example, you could make one box for medications, another for spare office supplies, one for holiday cookie cutters and sprinkles, and so on. Labeled shoebox-size boxes, buckets or baskets work well for grouping small items together.