Tag

Weakens

Browsing


Confidence in the market for new multifamily housing weakened year-over-year in the second quarter, according to the Multifamily Market Survey (MMS) by the National Association of Home Builders (NAHB). The MMS produces two separate indices. The Multifamily Production Index (MPI) had a reading of 43, down three points year-over-year, while the Multifamily Occupancy Index (MOI) had a reading of 74, down eight points year-over-year.

Multifamily developer sentiment is currently constrained by regulatory barriers and difficulty obtaining financing. The recently enacted 21st Century ROAD to Housing Act should provide some relief with respect to these challenges, but these policies will take time to implement. Meanwhile, rental housing demand is being supported by improving job growth during the second quarter of 2026. It is clear that supply-side headwinds continue to weigh on multifamily developer sentiment. In addition to relatively high interest rates and other financing issues, developers are finding it difficult to obtain approvals and utility connections in some parts of the country. High material prices and shortages of skilled labor also remain significant impediments

Multifamily Production Index (MPI)

The MMS asks multifamily developers to rate the current conditions as “good”, “fair”, or “poor” for multifamily starts in markets where they are active. The index and all its components are scaled so that a number above 50 indicates that more respondents report conditions as good rather than poor. The MPI is a weighted average of four key market segments: three in the built-for-rent market (garden/low-rise, mid/high-rise, and subsidized) and the built-for-sale (or condominium) market.

There were three components which experienced decreases year-over-year during the second quarter. The component measuring subsidized units fell seven points to 54, the component measuring mid/high-rise dropped four points to 32, and the component measuring garden/low-rise dipped two points to 48. Meanwhile, the component measuring built-for-sale units was the only one to increase year-over-year, up three points to 38.

Multifamily Occupancy Index (MOI)

The survey also asks multifamily property owners to rate the current conditions for occupancy of existing rental apartments in markets where they are active as “good”, “fair”, or “poor”.  Like the MPI, the MOI and all its components are scaled so that a number above 50 indicates more respondents report that occupancy is good than poor. The MOI is a weighted average of three built-for-rent market segments (garden/low-rise, mid/high-rise, and subsidized). 

Although all three components declined year-over-year, they all remained above the break-even point of 50 for the second quarter of 2026. The mid/high-rise component dropped 11 points to 62, the subsidized component decreased eight points to 82, and the garden/low-rise component fell seven points to 77.

The MMS was re-designed in 2023 to produce results that are easier to interpret and consistent with the proven format of other NAHB industry sentiment surveys. Until there is enough data to seasonally adjust the series, changes in the MMS indices should only be evaluated on a year-over-year basis.

Please visit NAHB’s MMS web page for the full report.


This article was originally published by a eyeonhousing.org . Read the Original article here. .


Private residential construction spending declined 0.3% in June, while substantial downward revisions to improvement (remodeling) spending significantly altered the sector’s recent trajectory. According to the latest construction spending data from the U.S. Census Bureau, private residential construction spending stood at a seasonally adjusted annual rate (SAAR) of $877.1 billion in June, down 0.3% from the revised May estimate and 4.7% lower than a year earlier. May’s monthly change was also revised downward, from an initially reported 0.3% increase to a 0.3% decline.

Although remodeling was the only residential category to increase in June, the gain was modest at 0.1%. When compared to a year ago, spending has declined 7.2%. The latest April and May estimates have also been revised significantly lower by the Census. April’s month-over-month change was revised from a 1.6% increase to a 10.1% decline, while May’s change was revised from a 0.9% increase to a 0.4% decline. On a year-over-year basis, April was revised from a 10.0% increase to a 2.6% decline, and May was revised from an 8.1% increase to a 5.5% decline.

Revisions to single-family and multifamily construction spending were minor and did not alter the direction of their monthly movements. In June 2026, single-family construction spending decreased 0.6% in June, consistent with the weak builder sentiment reflected in the NAHB/Wells Fargo Housing Market Index (HMI); on a yearly basis, single-family spending is down 3.3%. Multifamily construction spending also decreased 0.7% from May, and 1.5% from a year ago.

The NAHB construction spending index is shown in the graph below. The index illustrates how spending on single-family construction has slowed since early 2024, reflecting the impacts of elevated interest rates and ongoing uncertainty over building material tariffs. Multifamily construction spending growth has also slowed down after the peak in June 2023, with the index largely plateauing since late 2024. 

In contrast, improvement spending has been on an upward trend since 2023, supported in part by the aging housing stock and sustained demand for renovation. However, the latest revision indicates that a slowdown could be happening in 2026.

For private nonresidential construction, spending increased 0.1% in June to a SAAR of $745.3 billion but remained 4.7% below its year-earlier level. Meanwhile, spending on data centers, a subcategory within office construction remained strong, increasing 7.0% month-over-month and 45.8% year-over-year. The share of data centers as a percentage of spending on office construction has grown from 45.8% a year ago to 59.0% in June 2026.


This article was originally published by a eyeonhousing.org . Read the Original article here. .


Running counter to the data for the full economy, the count of open, unfilled positions in the construction industry increased in December, per the delayed Bureau of Labor Statistics Job Openings and Labor Turnover Survey (JOLTS). The current level of open jobs is down measurably from two years ago due to declines in construction activity, particularly in housing.

The number of open jobs for the overall economy declined as the labor market weakened at the end of 2025, falling from 6.982 million in November to 6.542 million in December. The December reading was down from a year ago (7.508 million).

Previous NAHB analysis indicated that this number had to fall below eight million on a sustained basis for the Federal Reserve to move forward on interest rate reductions. With estimates remaining below eight million for national job openings, the Fed, in theory, should be able to cut further.

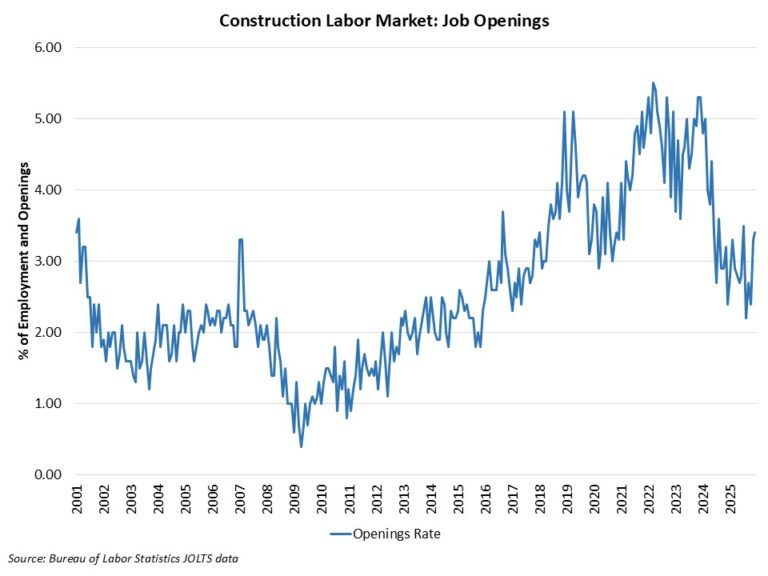
The number of open construction sector jobs increased from 284,000 in November to 292,000 in December. This total is higher compared to a year ago (205,000), although the reading is notably lower than two years ago. The chart below notes the declining trend that has been in place for unfilled construction jobs since the Fed raised the federal funds rate and home building weakened. While home building employment was declining during the second half of 2025, other subsectors of the construction industry have expanded (e.g. data centers).

The construction job openings rate increased to 3.4% in December, higher than the 3.2% rate estimated a year ago.

The layoff rate in construction declined to 1.5% in December. The quits increased to 1.5% for the month.


This article was originally published by a eyeonhousing.org . Read the Original article here. .
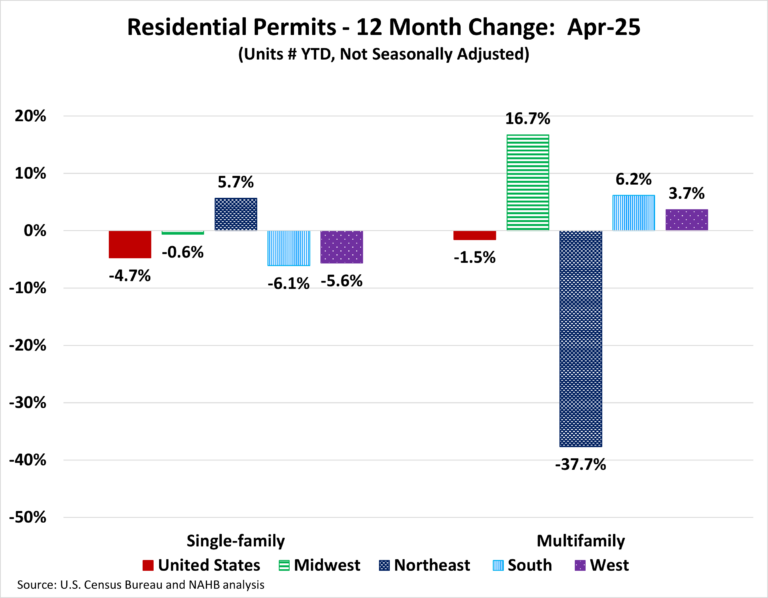

Housing permits continued a downhill trend for the fourth month in a row, pointing to a broader residential construction slowdown for 2025. Over the first four months of 2025, the total number of single-family permits issued year-to-date (YTD) nationwide reached 320,259. On a year-over-year (YoY) basis, this is a decline of 4.7% over the April 2024 level of 336,124. For multifamily, the total number of permits issued nationwide reached 154,668. This is 1.5% below the April 2024 level of 157,076.

Year-to-date ending in April, single-family permits were down in three out of the four regions. The Northeast posted an increase of 5.7%. The Midwest was down by 0.6%, the West was down by 5.6%, and the South was down by 6.1% in single-family permits during this time. For multifamily permits, three out of the four regions posted increases. The Midwest was up by 16.7%, the South was up by 6.2%, and the West was up by 3.7%. Meanwhile, the Northeast declined steeply by 37.7%.

Between April 2025 YTD and April 2024 YTD, 18 states posted an increase in single-family permits. The range of increases spanned 27.0% in Hawaii to 0.2% in Maine. The remaining 32 states and the District of Columbia reported declines in single-family permits with New Mexico reporting the steepest decline of 27.5%.

The ten states issuing the highest number of single-family permits combined accounted for 63.6% of the total single-family permits issued. Texas, the state with the highest number of single-family permits, issued 52,654 permits over the first four months of 2025; This is a decline of 7.4% compared to the same period last year. The second highest state, Florida, decreased by 9.3%, while the third highest, North Carolina, posted a decline of 1.5%.

Between April 2025 YTD and April 2024 YTD, 26 states recorded growth in multifamily permits, while 24 states and the District of Columbia recorded a decline. Alaska (+312.5%) led the way with a sharp rise in multifamily permits from 24 to 99, while New York had the biggest decline of 58.7% from 14,389 to 5,946.

The ten states issuing the highest number of multifamily permits combined accounted for 61.1% of the multifamily permits issued. Over the first four months of 2025, Florida, the state with the highest number of multifamily permits issued, experienced an increase of 18.7%. Texas, the second-highest state in multifamily permits, saw an increase of 6.8%. California, the third largest multifamily issuing state, increased by 0.2%.

At the local level, below are the top ten metro areas that issued the highest number of single-family permits.

For multifamily permits, below are the top ten local areas that issued the highest number of permits.

Discover more from Eye On Housing

Subscribe to get the latest posts sent to your email.


This article was originally published by a eyeonhousing.org . Read the Original article here. .

Pin It