Tag

Upward

Browsing


The share of new homes with decks inched upward, from an all-time low of 17.4% in 2024 to 17.8% in 2025, according to NAHB tabulation of data from the HUD/Census Bureau Survey of Construction (SOC).

Historically, the share of new homes with decks dropped significantly between 2017 (23.8%) and 2021 (17.5%). Since then, the share has remained largely stable, fluctuating only within the relatively narrow band between 17.4% and 17.8%. Against that backdrop, the share of new homes with patios was generally rising, until it began edging downward in 2024 and 2025. However, prior to 2021, there was an extended period when patios on new homes were trending upward while decks were trending downward. This resulted in a -0.85 correlation between the percentages of new homes with patios and decks over the period of 2005 through 2025—indicating that patios and decks have functioned as substitutes for each other over time.  In the SOC, the definitions of the two are fairly similar. A deck is a floored area without a roof, not sitting directly on the ground. A patio is a floored area, with or without a roof, sitting directly on the ground.

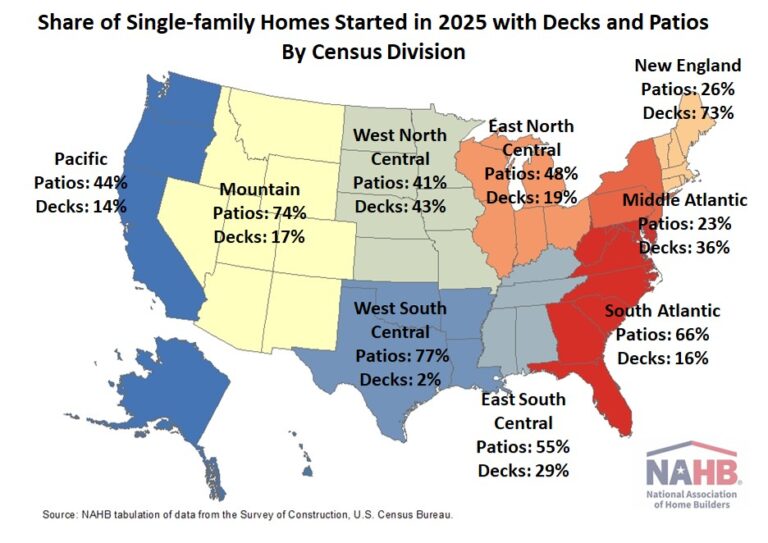
Decks and patios also tend to function as substitutes for each other across geographic areas. Among single-family homes started in 2025, decks were noticeably more common in places where patios were comparatively rare. For example, only 26% of the homes in the New England Census Division included patios, while a high of 73% came with decks. Conversely, a divisional high 77% of new homes included patios in the West South Central, while only 2% included decks. Across all nine divisions, the correlation between the percentages of new homes with decks and patios was -0.76.

After New England, decks on new homes were most common in the West North Central (43%), Middle Atlantic (36%) and East South Central (29%) divisions.

Additional detail on the characteristics of new-home decks is available from the Annual Builder Practices Survey (BPS) conducted by Home Innovation Research Labs.

In addition to size, geographic differences in new home deck materials continue to exist. On a square foot basis, builders favor treated wood in the South Atlantic, East South Central, and Mountain divisions. In New England and the East North Central, composite material predominates. In the Middle Atlantic and West North Central, builders are close to evenly split between treated wood and composite. In the West South Central and Pacific divisions, where decks on new homes are comparatively rare, concrete is the top choice.

Of course, decks can be—and often are—added after the home itself is built. In the fourth-quarter 2025 survey for the NAHB Remodeling Market Index, decks tied for sixth place on the list of most common  projects reported by professional remodelers.


This article was originally published by a eyeonhousing.org . Read the Original article here. .
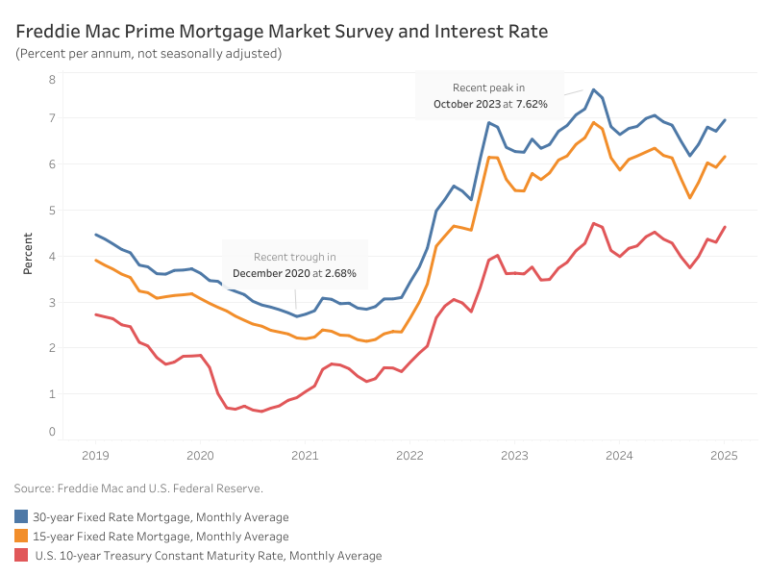

Mortgage rates edged higher in January, with the average 30-year fixed-rate mortgage reaching 6.96%. Rates had been climbing steadily since mid-December—even surpassing 7%—before easing in recent weeks as the bond market stabilized following news that President Donald Trump postponed tariffs plans to February 1.

According to Freddie Mac, the average rate for a 30-year fixed-rate mortgage rose 24 basis points (bps) from December, extending a two-year trend of fluctuations between 6% and 7%. Meanwhile, the 15-year fixed-rate mortgage increased 23 bps to land at 6.13%.

The 10-year Treasury yield, a key benchmark for mortgage rates, averaged 4.63% in November—33 basis points higher than December’s average. A strong economy, coupled with ongoing uncertainty over inflation due to tax cuts and tariffs, continues to put upward pressure on yields. This uncertainty is also reflected in the increased range for the projected 2025 core PCE inflation in the December FOMC economic projections, now estimated between 2.1% and 3.2%, compared to a narrower 2.1% to 2.5% range in September.

Discover more from Eye On Housing

Subscribe to get the latest posts sent to your email.


This article was originally published by a eyeonhousing.org . Read the Original article here. .
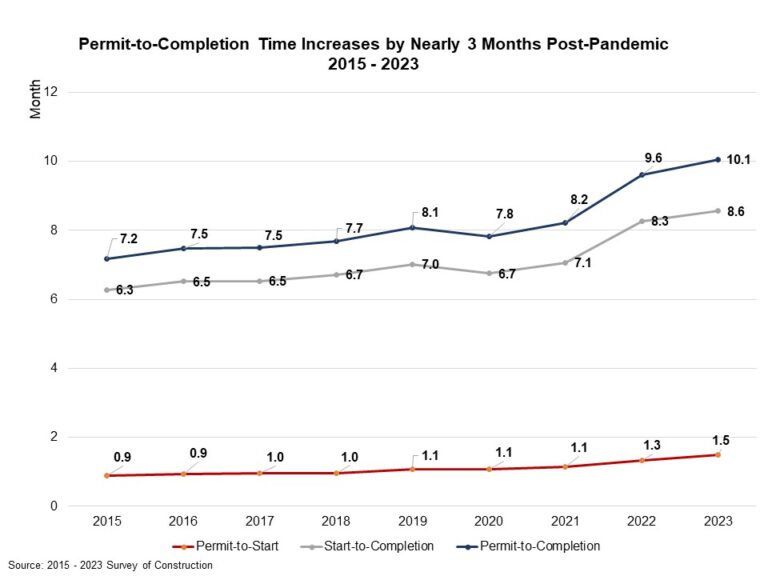

The average completion time of a single-family house in 2023 was approximately 10.1 months, breaking down to 1.5 months for authorization to start construction and another 8.6 months to finish construction. According to the Census Bureau’s Survey of Construction, the permit-to-completion time has been on an upward trend since 2015. Currently, it is almost 3 months longer than the average completion time in 2015. This extended duration is largely attributable to a more stringent regulatory environment, ongoing supply-chain challenges and a shortage of skilled labor.

Among all single-family houses completed in 2023, homes built for sale required the shortest amount of time, 8.9 months from obtaining building permits to completion. Meanwhile, homes built by owners (custom builds) required the longest time, 15.2 months. Homes built by hired contractors tookabout12.1 months, and homes built-for-rent took about 12.2 months from authorization to completion.

The time from permit to start for all types of homes was longer in 2023. The period of time necessary to start construction required, on average, 1.5 months in 2023. In contrast, prior to 2017 construction typically started within the same month after obtaining building authorization. Between authorization and the start of construction, built for sale and built by contractors on owner’s land required 1.5 months and 1.4 months respectively. The permit-to-start time was even longer for homes built-for-rent and custom builds (1.6 months).

The chart below illustrates that permit-to-completion time differs across home sizes. The smallest single-family homes, under 1,200 sq. ft., required 13 months to finish, relatively longer than larger homes under 5,000 sq. ft. This prolonged period is primarily because half of these smaller homes are constructed specifically for rental purposes, which typically takes longer building time from authorization. In contrast, homes ranging from 1,200 to 3,999 sq. ft. are built at the average building time, typically around 10 months. As the size increases beyond 4,000 sq. ft., there is a noticeable upward trend in completion times. Homes with 4,000-4,999 sq. ft. take about 12 months, while those between 5,000- 5,999 sq. ft. extend to a little more than 14 months. Homes over 6,000 sq. ft. take the longest to build, requiring almost 18 months from permit to finish.

The average time from authorization to completion also varies across divisions. The division with the longest duration was New England (13.9 months), followed by the Middle Atlantic (13.2 months), the Mountain division (11.4 months), and the Pacific division (11.2 months) in 2023. These four divisions exceeded the nation’s average of10.1 months. The shortest period, 8.9 months, is registered in the South Atlantic division. The average waiting period from permit to construction start varies from the shortest time of 0.9 months in the East North Central to the longest of 2 months in New England.

The SOC also collects additional information for houses built for sale, including a sale date when buyers sign sale contracts or make a deposit. Looking at single-family homes built for sale and completed in 2023, 17.2% were sold before construction started, 41.8% sold while under construction, 15.6% sold during the month of completion, and 19.7% sold after completion. The share of completed houses remaining unsold was 5.8% at point of survey.

Discover more from Eye On Housing

Subscribe to get the latest posts sent to your email.


This article was originally published by a eyeonhousing.org . Read the Original article here. .
Pin It