Tag

Uncertainty

Browsing


Economic uncertainty stemming from tariff issues, elevated mortgage rates and rising building material costs pushed single-family housing starts lower in April.

Overall housing starts increased 1.6% in April to a seasonally adjusted annual rate of 1.36 million units, according to a report from the U.S. Department of Housing and Urban Development and the U.S. Census Bureau.

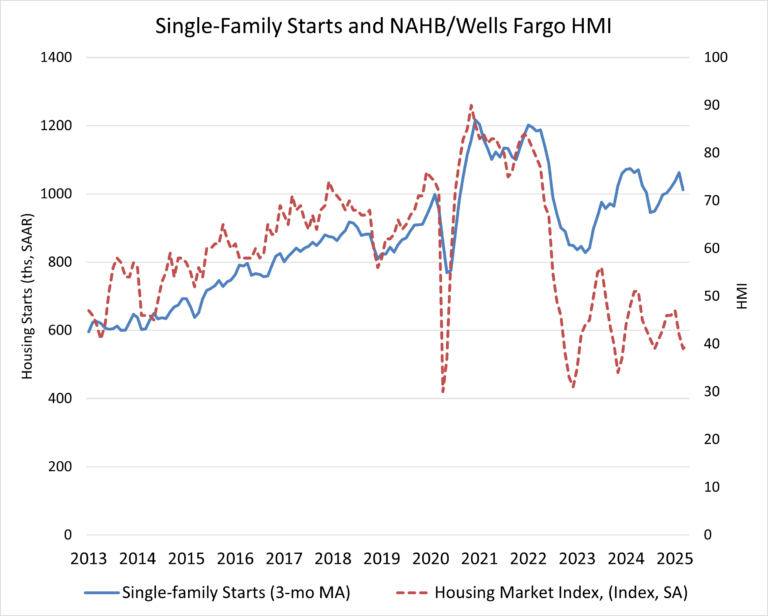
The April reading of 1.36 million starts is the number of housing units builders would begin if development kept this pace for the next 12 months. Within this overall number, single-family starts decreased 2.1% to a 927,000 seasonally adjusted annual rate and are down 12.0% compared to April 2024. On a year-to-date basis, single-family starts are down 7.1%. The three-month moving average (a useful gauge given recent volatility) is down to 991,000 units, as charted below.

The multifamily sector, which includes apartment buildings and condos, increased 10.7% to an annualized 434,000 pace. The three-month moving average for multifamily construction has trended upward to a 406,000-unit annual rate. On a year-over-year basis, multifamily construction is up 30.7%.

On a regional and year-to-date basis, combined single-family and multifamily starts were 19.8% higher in the Northeast, 4.4% higher in the Midwest, 3.4% higher in the West , and 7.4% lower in the South.

The total number of single-family homes and apartments under construction was 1.4 million units in April. This is the lowest total since June 2021. Total housing units now under construction are 14.3% lower than a year ago. Single-family units under construction fell to a count of 630,000—down 7.1% compared to a year ago. The number of multifamily units under construction has fallen to 788,000 units. This is down 15.6% compared to a year ago.

On a 3-month moving average basis, there are currently 1.3 apartments completing construction for every one that is beginning construction. While apartment construction starts are down, the number of completed units entering the market is rising due to prior elevated construction levels. Year-to-date, the pace of completions for apartments in buildings with five or more units is down 3.4% in 2025 compared to 2024. An elevated pace of completions in 2025 for multifamily construction will place some downward pressure on rent growth.

Overall permits decreased 4.7% to a 1.41-million-unit annualized rate in April. Single-family permits decreased 5.1% to a 922,000-unit rate and are down 6.2% compared to April 2024. Multifamily permits decreased 3.7% to a 490,000 pace but are up 2.9% compared to April 2024.

Looking at regional permit data on a year-to-date basis, permits were 5.1% higher in the Midwest, 3.5% lower in the West, 3.8% lower in the South, and 20.3% lower in the Northeast.

Discover more from Eye On Housing

Subscribe to get the latest posts sent to your email.


This article was originally published by a eyeonhousing.org . Read the Original article here. .


The Federal Reserve remained on pause with respect to rate cuts at the conclusion of its May meeting, maintaining the federal funds rate in the 4.25% to 4.5% range. Characterizing current market conditions, the central bank noted that the “unemployment rate has stabilized at a low level in recent months, and labor market conditions remain solid.” However, the Fed noted that “inflation remains somewhat elevated.”

Today’s statement acknowledged the weak first quarter GDP report via a reference to “swings in net exports have affected data” but otherwise the economy continues to expand at a “solid pace.” The Fed also reiterated its commitment to maintain maximum employment and bring inflation back to its 2% target rate.

With respect to monetary policy, the Fed noted that uncertainty for the U.S. economy has increased. Mindful of its dual mandate (price stability and maximum employment), the Fed noted that the “risks of higher unemployment and higher inflation have risen.” This statement reflects the complex situation the Fed currently faces, with risks to both sides of its policy mandate increasing.

While todays statement does not explicitly reference tariff policy, the debate over tariffs is an obvious candidate for the source of these rising risks that would harm the labor market and raise prices. Indeed, Chair Powell referenced industry reports of tariff risks in his press conference. Many economists, who as a profession dislike tariffs, would argue that the Fed would likely move further on normalizing monetary policy and reducing rates, if not for the risks of future tariff policy.

In the meantime, as Chair Powell noted, otherwise solid economic conditions leave the Fed with moderately restrictive policy and “in a good place to wait and see” with respect to future policy.

Today’s statement noted that the Federal Open Market Committee “will carefully assess incoming data, the evolving outlook, and the balance of risks.” In particular, the Fed will review “readings on labor market conditions, inflation pressures and inflation expectations, and financial and international developments.”

While the list of data sources the Fed is watching seems like everything but the kitchen sink, the Fed should be sure to watch sinks, windows, lighting fixtures, and other building material pricing and availability to gauge future economic and inflation conditions. Shelter inflation remains a leading source of ongoing elevated inflation. And shelter inflation can only be reduced by building more attainable housing.

Discover more from Eye On Housing

Subscribe to get the latest posts sent to your email.


This article was originally published by a eyeonhousing.org . Read the Original article here. .
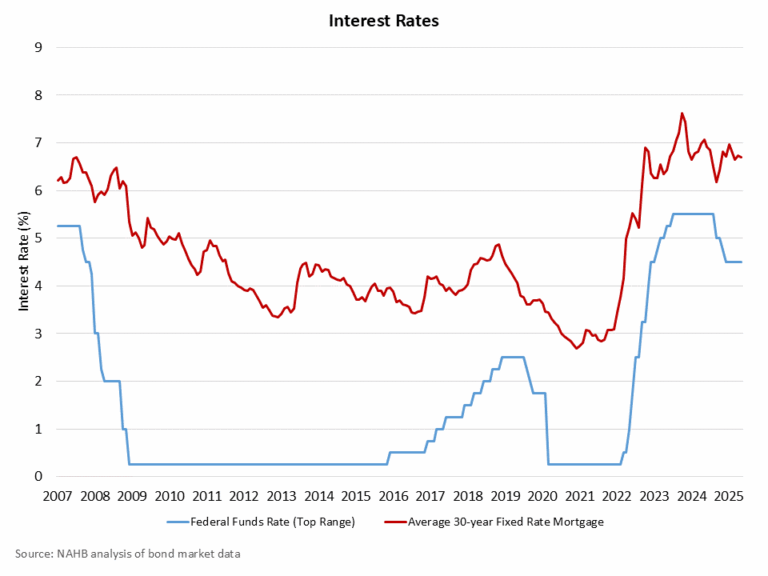

Constrained housing affordability conditions due to elevated interest rates, rising construction costs and labor shortages led to a reduction in housing production in March.

Overall housing starts decreased 11.4% in March to a seasonally adjusted annual rate of 1.32 million units, according to a report from the U.S. Department of Housing and Urban Development and the U.S. Census Bureau.

The March reading of 1.32 million starts is the number of housing units builders would begin if development kept this pace for the next 12 months. Within this overall number, single-family starts decreased 14.2% to a 940,000 seasonally adjusted annual rate over the month and are down 9.7% compared to March 2024. On a year-to-date basis, single-family starts are down 5.6%. The three-month moving average (a useful gauge given recent volatility) is down to 1.01 million units, as charted below.

The multifamily sector, which includes apartment buildings and condos, decreased 3.5% to an annualized 384,000 pace. The three-month moving average for multifamily construction has trended upward to a 381,000-unit annual rate. On a year-over-year basis, multifamily construction is up 48.8%.

On a regional and year-to-date basis, combined single-family and multifamily starts were 10.6% higher in the West, 8.6% higher in the Northeast, 3.3% higher in the Midwest, and 8.5% lower in the South.

The total number of single-family homes and apartments under construction was 1.4 million in March. This is the lowest total since July 2021. Total housing units now under construction are 15.2% lower than a year ago. Single-family units under construction fell to a count of 632,000—down 8.7% compared to a year ago. The number of multifamily units under construction has fallen to 759,000 units. This is down 20.0% compared to a year ago.

On a 3-month moving average basis, there are currently 1.5 apartments completing construction for every one that is beginning construction. While apartment construction starts are down, the number of completed units entering the market is rising due to prior elevated construction levels. Year-to-date, the pace of completions for apartments in buildings with five or more units is down 3.5% in 2025 compared to 2024. An elevated pace of completions in 2025 for multifamily construction will place some downward pressure on rent growth.

Overall permits increased 1.6% to a 1.48-million-unit annualized rate in March. Single-family permits decreased 2.0% to a 978,000-unit rate. Multifamily permits increased 9.3% to a 504,000 pace.

Looking at regional permit data on a year-to-date basis, permits were 4.7% higher in the Midwest, 0.4% higher in the South, 8.8% lower in the West and 24.7% lower in the Northeast.

Discover more from Eye On Housing

Subscribe to get the latest posts sent to your email.


This article was originally published by a eyeonhousing.org . Read the Original article here. .

Economic uncertainty, the threat of tariffs and elevated construction costs pushed builder sentiment down in March even as builders express hope that a better regulatory environment will lead to an improving business climate.

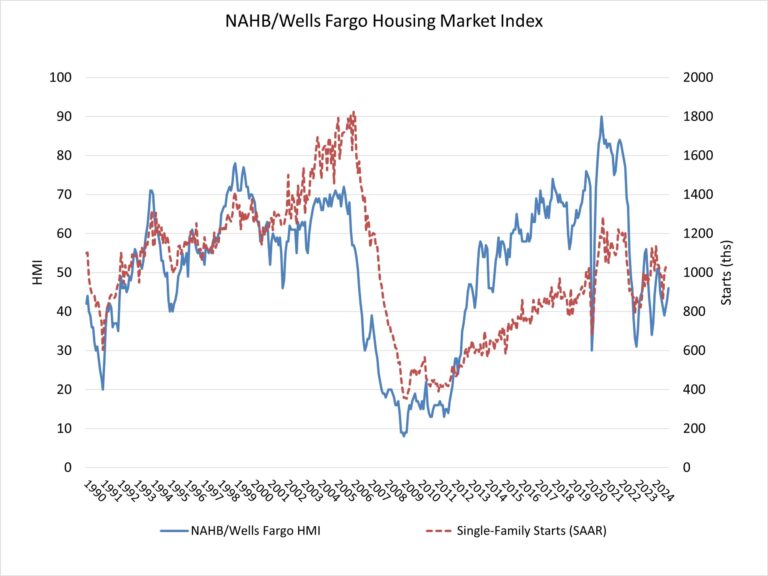
Builder confidence in the market for newly built single-family homes was 39 in March, down three points from February and the lowest level in seven months, according to the National Association of Home Builders (NAHB)/Wells Fargo Housing Market Index (HMI).

Builders continue to face elevated building material costs that are exacerbated by tariff issues, as well as other supply-side challenges that include labor and lot shortages. At the same time, builders are starting to see relief on the regulatory front to bend the rising cost curve, as demonstrated by the Trump administration’s pause of the 2021 IECC building code requirement and move to implement the regulatory definition of ‘waters of the United States’ under the Clean Water Act consistent with the U.S. Supreme Court’s Sackett decision.

Construction firms are facing added cost pressures from tariffs. Data from the HMI March survey reveals that builders estimate a typical cost effect from recent tariff actions at $9,200 per home. Uncertainty on policy is also having a negative impact on home buyers and development decisions.

The latest HMI survey also revealed that 29% of builders cut home prices in March, up from 26% in February. Meanwhile, the average price reduction was 5% in March, the same rate as the previous month. The use of sales incentives was 59% in March, unchanged from February.

Derived from a monthly survey that NAHB has been conducting for more than 35 years, the NAHB/Wells Fargo HMI gauges builder perceptions of current single-family home sales and sales expectations for the next six months as “good,” “fair” or “poor.” The survey also asks builders to rate traffic of prospective buyers as “high to very high,” “average” or “low to very low.” Scores for each component are then used to calculate a seasonally adjusted index where any number over 50 indicates that more builders view conditions as good than poor.

The HMI index gauging current sales conditions fell three points to 43 in March, its lowest point since December 2023. The gauge charting traffic of prospective buyers dropped five points to 24 while the component measuring sales expectations in the next six months held steady at 47.

Looking at the three-month moving averages for regional HMI scores, the Northeast fell three points in March to 54, the Midwest moved three points lower to 42, the South dropped four points to 42 and the West posted a two-point decline to 37. The HMI tables can be found at nahb.org/hmi.

Discover more from Eye On Housing

Subscribe to get the latest posts sent to your email.


This article was originally published by a eyeonhousing.org . Read the Original article here. .


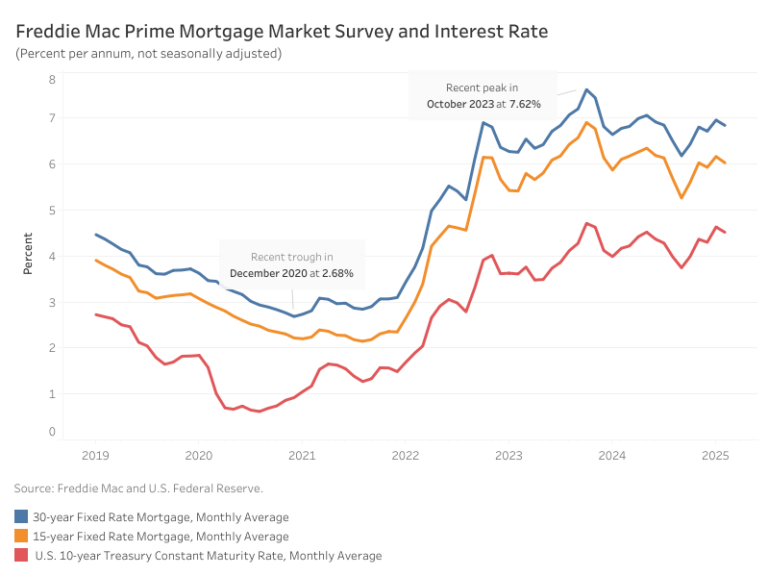
Mortgage rates declined marginally in February, with the average 30-year fixed-rate mortgage falling to 6.84%. After climbing steadily since December and peaking at 7.04% in mid-January, rates have been trending downward.

According to Freddie Mac, the average rate for a 30-year fixed-rate mortgage decreased 12 basis points (bps) from January, while the 15-year fixed-rate mortgage fell 13 bps to 6.03%. Although the recent decline in mortgage rates and an increase in the total single-family homes supply are positive signs for buyers, homebuying activity may remain sluggish due to persistent high prices and mortgage rates still exceeding 6%.

The 10-year Treasury yield declined 11 bps to an average of 4.52% in February, reversing its recent upward trend. This shift reflects concerns over a weakening U.S. economy due to inflationary pressures and increasing geopolitical risks. In response, the markets anticipate that the Federal Reserve will resume rate cuts later in the year.

Discover more from Eye On Housing

Subscribe to get the latest posts sent to your email.


This article was originally published by a eyeonhousing.org . Read the Original article here. .

Builder sentiment improved for the third straight month, and builders expect market conditions will continue to improve with Republicans winning control of the White House and Congress.

Builder confidence in the market for newly built single-family homes was 46 in November, up three points from October, according to the National Association of Home Builders (NAHB)/Wells Fargo Housing Market Index. Future sales expectations posted a notable increase in the November reading of builder sentiment.

While builder confidence is improving, the industry still faces many headwinds such as an ongoing shortage of labor and buildable lots along with elevated building material prices. Moreover, while the stock market cheered the election result, the bond market has concerns, as indicated by a rise for long-term interest rates. There is also policy uncertainty in front of the business sector and housing market as the executive branch changes hands.

The latest HMI survey also revealed that 31% of builders cut home prices in November. This share has remained essentially unchanged since July, hovering between 31% and 33%. Meanwhile, the average price reduction was 5%, slightly below the 6% rate posted in October. The use of sales incentives was 60% in November, slightly down from 62% in October.

Derived from a monthly survey that NAHB has been conducting for more than 35 years, the NAHB/Wells Fargo HMI gauges builder perceptions of current single-family home sales and sales expectations for the next six months as “good,” “fair” or “poor.” The survey also asks builders to rate traffic of prospective buyers as “high to very high,” “average” or “low to very low.” Scores for each component are then used to calculate a seasonally adjusted index where any number over 50 indicates that more builders view conditions as good than poor.

All three HMI sub-indices were up in November. The index charting current sales conditions rose two points to 49, the component measuring sales expectations in the next six months increased seven points to 64 and the gauge charting traffic of prospective buyers posted a three-point gain to 32.

Looking at the three-month moving averages for regional HMI scores, the Northeast increased four points to 55, the Midwest moved three points higher to 44, the South edged up one point to 42 and the West held steady at 41. HMI tables can be found at nahb.org/hmi.

Discover more from Eye On Housing

Subscribe to get the latest posts sent to your email.


This article was originally published by a eyeonhousing.org . Read the Original article here. .
Pin It