Tag

U.S

Browsing


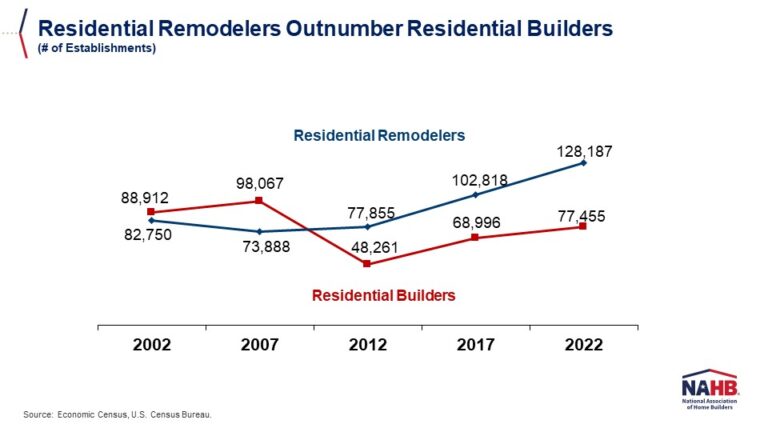
The number of residential remodelers in the U.S. has reached a record high of 128,187 establishments, 65% higher than the number of residential builders (single-family and multifamily), which stands at 77,455.  These official government counts were released by the U.S. Census Bureau as part of its 2022 Economic Census, which tallies American businesses every five years (in years ending in 2 and 7).

Growth in the number of remodelers significantly outpaced that of builders between 2017 and 2022. In that 5-year span, the remodeler count increased by 25% (102,818 to 128,187), while the number of builders grew at half that pace–by 12% (68,996 to 77,455).

A starker dichotomy emerges when comparing 2022 counts to those in 2007, prior to the financial crisis and the ensuing housing recession.  In that 15-year period, the official number of residential remodelers in the U.S. grew by 73% (73,888 to 128,187), while the official number of residential builders contracted by 21% (98,067 to 77,455).

Another way to analyze this data is by creating a combined universe of both builders and remodelers and then calculating each group’s share of the total. In 2022, for example, remodelers represented 62% of the total number of builders and remodelers in the U.S, while builders made up a minority share of 38%.  Remodelers have accounted for at least 60% of this total in the last three Economic Census (2012, 2017, and 2022). 

The last time builders comprised a majority share was in 2007, when they represented 57% of the combined total number of builders and remodelers in the country.

Discover more from Eye On Housing

Subscribe to get the latest posts sent to your email.


This article was originally published by a eyeonhousing.org . Read the Original article here. .


Lumber cost uncertainty has risen from the start of the year, driven in part by potential higher tariffs, particularly on Canadian softwood lumber. Despite the continued use and threat of tariffs, U.S. sawmill and wood preservation firms have not increased production to a level that replaces imports. In fact, utilization rates continue to fall, meaning they have the capacity to produce more lumber but are simply not operating at that level.

As these firms produce at lower levels, their employment has fallen over the past few quarters. At the same time, reduced foreign competition and artificially higher prices have lessened the incentive for firms to expand output, even as demand remains high. As a result, U.S. mills remain unable to meet the nation’s full lumber consumption needs.

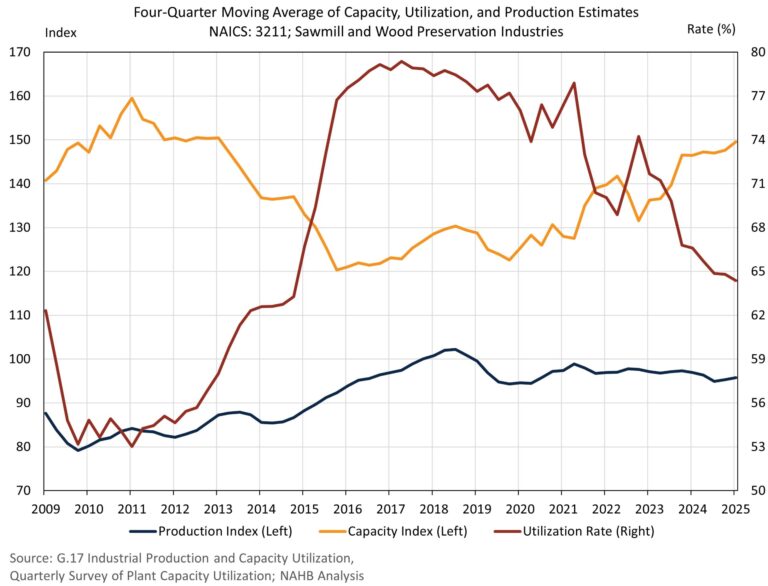
In the first quarter of 2025, sawmill and wood preservation firms continued to report lower capacity utilization coupled with stagnant production. The utilization rate, a ratio of actual production and potential production, was 64.4% in the first quarter on a four-quarter moving average basis. The utilization rate has continued to drop since 2017, as capacity (or the capability to produce) has increased, but production has remained lower than in 2018.

By combining the Federal Reserve’s production index and the Census Bureau’s utilization rate, we can compose a rough index estimate of what the current production capacity is for U.S. sawmills and wood preservation firms. Shown below is a quarterly estimate of the calculated production capacity index with production index and utilization rate estimates.  

Based on the data above, sawmill capacity has increased from 2015 but remains lower than peak levels in 2011. Most of the recent capacity gains took place in 2023, followed by little gain over the course of 2024. As evident above, there is ample room to increase production of domestic lumber, but current production levels remain much unchanged over the past several years. Looking at the Producer Price Index, lumber prices remain higher than 2024. At current pricing levels, producers may see no benefit of increasing output, as it would push prices lower since demand has fallen from the start of the year. Notably, even when prices were historically high in 2021 and 2022, producers were unable to increase their production significantly during these periods, potentially due to supply chain disruptions.

Employment at sawmills and wood preservations firms fell again in the first quarter to 88,533 workers. This marks the third consecutive quarter where employment fell in this industry. Tariff policies to protect the U.S. lumber industry have been in place since 2017 in the form of antidumping/countervailing duties. Tariff policies are typically intended to provide stability to the industry and increase employment but here, we are seeing the opposite effect.

These policies specifically place duties on imports of Canadian softwood lumber, where nearly a quarter of the U.S. softwood lumber supply originates. The current AD/CVD rates on Canadian softwood lumber are expected to double this fall to over 30%. Due to U.S. lumber production remaining level since the initial tariff policies were enacted in 2017, doubling these duty costs will likely not increase supply but simply increase costs.

Discover more from Eye On Housing

Subscribe to get the latest posts sent to your email.


This article was originally published by a eyeonhousing.org . Read the Original article here. .


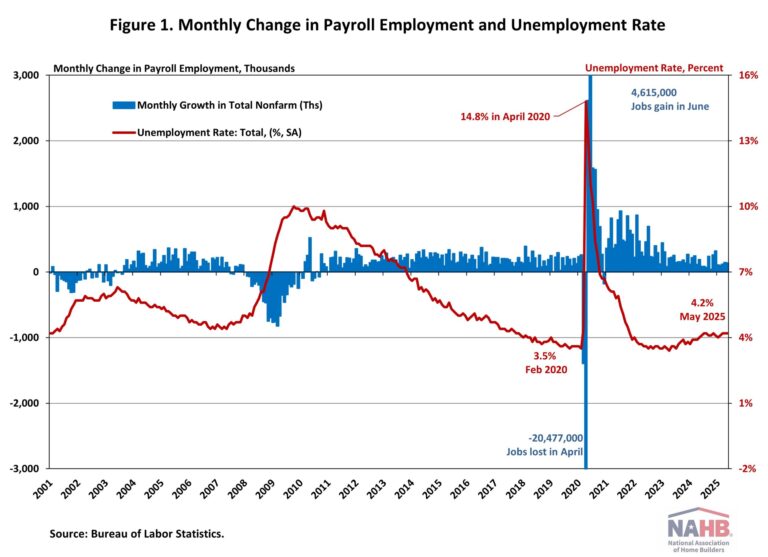
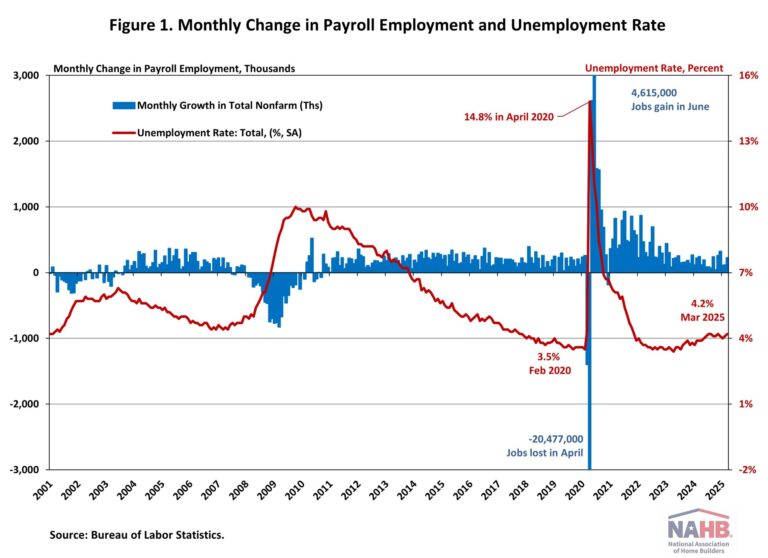
Despite ongoing economic and policy uncertainty, the labor market remains resilient, though early signs of softening are beginning to emerge. Job growth moderated in May, and employment figures for March and April were notably revised downward. The unemployment rate remained at 4.2%.

In May, wage growth remained unchanged. Year-over-year, wages grew at a 3.9% rate. Wage growth has been outpacing inflation for nearly two years, which typically occurs as productivity increases.

National Employment

According to the Employment Situation Summary reported by the Bureau of Labor Statistics (BLS), total nonfarm payroll employment rose by 139,000 in May, following a downwardly revised increase of 147,000 jobs in April. Since January 2021, the U.S. job market has added jobs for 53 consecutive months, making it the third-longest period of employment expansion on record. Monthly employment growth has averaged 124,000 per month in 2025, compared with the 168,000 monthly average gain for 2024.

The estimates for the previous two months were revised down. The monthly change in total nonfarm payroll employment for March was revised down by 65,000 from +185,000 to +120,000, while the change for April was revised down by 30,000 from +177,000 to +147,000. Combined, the revisions were 95,000 lower than previously reported.

The unemployment rate remained unchanged at 4.2% in May. Despite this stability, the overall labor force shrank with notable shifts. The number of employed persons decreased by 696,000, while the number of unemployed persons increased by 71,000.

Meanwhile, the labor force participation rate—the proportion of the population either looking for a job or already holding a job—decreased two percentage points to 62.4%. The overall labor force participation rate remains below its pre-pandemic levels of 63.3% at the beginning of 2020. Among individuals aged 25 to 54, the participation rate declined two percentage points to 83.4%. The rate for the prime working-age group (25 to 54) has been trending downward since peaking at 83.9% last summer.

In May, industries like health care (+62,000), leisure and hospitality (+48,000), and social assistance (+16,000) continued to see gains. Meanwhile, federal government lost 22,000 jobs in May and has shed 59,000 jobs since January 2025, reflecting the effects of government cutbacks. The BLS notes that “employees on paid leave or receiving ongoing severance pay are counted as employed in the establishment survey.”

Construction Employment

Employment in the overall construction sector rose by 4,000 in May, following a downwardly revised gain of 7,000 in April. While residential construction lost 7,400 jobs, non-residential construction employment added 11,300 jobs during the month.

Residential construction employment now stands at 3.3 million in May, broken down as 963,000 builders and 2.4 million residential specialty trade contractors. The six-month moving average of job gains for residential construction was -2,617 a month, reflecting job losses recorded in three of the past six months, specifically in January, March, and May of 2025. Over the last 12 months, home builders and remodelers experienced a net loss of 1,000 jobs, marking the first annual decline since September 2020. Since the low point following the Great Recession, residential construction has gained 1,360,600 positions.

In May, the unemployment rate for construction workers declined to 3.8% on a seasonally adjusted basis. The unemployment rate for construction workers has remained at a relatively lower level, after reaching 15.3% in April 2020 due to the housing demand impact of the COVID-19 pandemic.

Discover more from Eye On Housing

Subscribe to get the latest posts sent to your email.


This article was originally published by a eyeonhousing.org . Read the Original article here. .


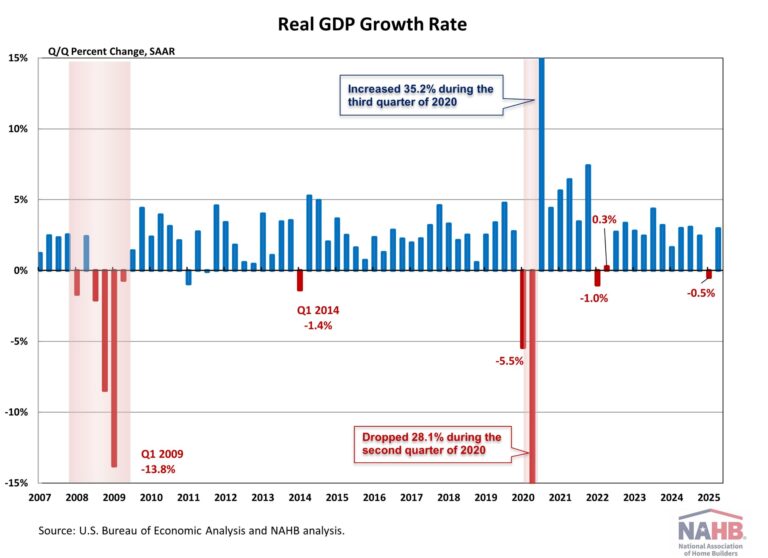
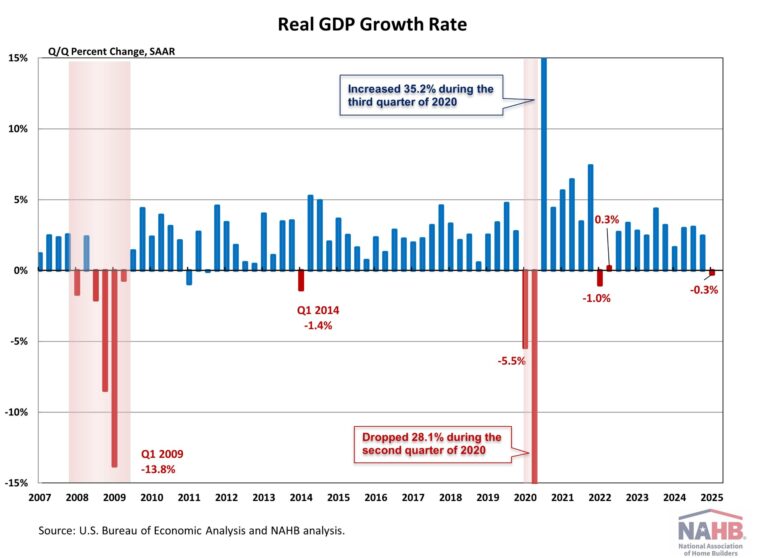
The U.S. economy contracted in the first quarter of 2025 for the first time in three years, driven by a sharp surge in pre-tariff imports, softening consumer spending, and a decline in government spending.

According to the “advance” estimate  released by the Bureau of Economic Analysis (BEA), real gross domestic product (GDP) decreased at an annual rate of 0.3% in the first quarter of 2025, following a 2.4% gain in the fourth quarter of 2024. This marks the first quarter of economic contraction since the first quarter of 2022. NAHB predicted a 0.2% increase for the first quarter of 2025.

Furthermore, the data from the GDP report suggests that inflationary pressure persisted. The GDP price index rose 3.4% for the first quarter, up from a 2.2% increase in the fourth quarter of 2024. The Personal Consumption Expenditures Price (PCE) Index, which measures inflation (or deflation) across various consumer expenses and reflects changes in consumer behavior, rose 3.6% in the first quarter. This is up from a 2.4% increase in the fourth quarter of 2024.

The contraction in real GDP primarily reflected a sharp increase in imports and a decrease in government spending.

Imports, which are a subtraction in the calculation of GDP, surged at an annualized rate of 41.3% in the first quarter, as businesses rushed to stockpile goods ahead of implementing tariffs. While goods imports spiked by 50.9%, services imports increased by 8.6%. The import surge contributed to a record-high trade deficit and subtracted more than five percentage points from the headline GDP figure.

Government spending decreased at an annual rate of 1.4% in the first quarter. Federal spending fell sharply by 5.1%, partially offset by a modest 0.8% increase in state and local government expenditures.

Consumer spending, a key driver of the economy, softened. It rose at an annual rate of 1.8%, the slowest pace in seven quarters. Spending on goods increased by 0.5%, while expenditure on services grew by 2.4%.

Private inventories were the largest contributor to the increase in gross private domestic investment.

Nonresidential fixed investment increased by 9.8%, with notable increases in equipment (+22.5%) and intellectual property products (+4.1%). Residential fixed investment posted a 1.3% gain, following a 5.5% increase in the previous quarter. Within residential categories, single-family structures rose 5.9%, improvements increased 3.6%, while multifamily structures fell 11.5%.

For the common BEA terms and definitions, please access bea.gov/Help/Glossary.

Discover more from Eye On Housing

Subscribe to get the latest posts sent to your email.


This article was originally published by a eyeonhousing.org . Read the Original article here. .


The U.S. job market unexpectedly accelerated in March, while the figures for January and February were revised downward substantially. The unemployment rate ticked up slightly to 4.2% in March, from 4.1% the previous month. This month’s jobs report highlights the continued resilience of the labor market despite sticky inflation, a drop in consumer confidence, mass federal government layoffs, and growing economic uncertainty.

Noticeably, residential construction employment has shown signs of weakness in recent months. In March, the six-month moving average of job gains for residential construction turned negative for the first time since August 2020. It reflects three significant drops in employment: 8,400 jobs in October 2024, 6,700 jobs in January 2025, and 9,800 jobs in March 2025. Additionally, the construction job openings rate has returned to 2019 levels, driven by a slowdown in construction activity.

In March, wage growth slowed. Year-over-year, wages grew at a 3.8% rate, down 0.3 percentage points from a year ago. Wage growth has been outpacing inflation for nearly two years, which typically occurs as productivity increases.

National Employment

According to the Employment Situation Summary reported by the Bureau of Labor Statistics (BLS), total nonfarm payroll employment rose by 228,000 in March, following a downwardly revised increase of 117,000 jobs in February. Since January 2021, the U.S. job market has added jobs for 51 consecutive months, making it the third-longest period of employment expansion on record.

The estimates for the previous two months were revised down. The monthly change in total nonfarm payroll employment for January was revised down by 14,000 from +125,000 to +111,000, while the change for February was revised down by 34,000 from +151,000 to +117,000. Combined, the revisions were 48,000 lower than previously reported.

The unemployment rate rose to 4.2% in March. While the number of employed persons increased by 201,000, the number of unemployed persons increased by 31,000.

Meanwhile, the labor force participation rate—the proportion of the population either looking for a job or already holding a job—rose one percentage point to 62.5%. For people aged between 25 and 54, the participation rate decreased two percentage points to 83.3%. While the overall labor force participation rate remains below its pre-pandemic levels of 63.3% at the beginning of 2020, the rate for people aged between 25 and 54 has been trending down since it peaked at 83.9% last summer.

In March, employment rose in health care (+54,000), social assistance (+24,000), and transportation and warehousing (+23,000). Employment in retail trade also added 24,000 jobs in March, partially reflecting the return of workers from a strike. However, within the government sector, federal government employment saw a decline of 4,000, following a loss of 11,000 jobs in February. The BLS notes that “employees on paid leave or receiving ongoing severance pay are counted as employed in the establishment survey.”

Construction Employment

Employment in the overall construction sector increased by 13,000 in March, following a gain of 14,000 in February. While residential construction saw a decline of 9,800 jobs, non-residential construction employment added 22,300 jobs for the month.

Residential construction employment now stands at 3.4 million in March, broken down as 958,000 builders and 2.4 million residential specialty trade contractors. The six-month moving average of job gains for residential construction was -2,883 a month, mainly reflecting the three months’ job loss over the past six months (October 2024, January 2025 and March 2025). Over the last 12 months, home builders and remodelers added 14,000 jobs on a net basis. Since the low point following the Great Recession, residential construction has gained 1,367,600 positions.

In March, the unemployment rate for construction workers declined to 4.3% on a seasonally adjusted basis. The unemployment rate for construction workers has remained at a relatively lower level, after reaching 15.3% in April 2020 due to the housing demand impact of the COVID-19 pandemic.

Discover more from Eye On Housing

Subscribe to get the latest posts sent to your email.


This article was originally published by a eyeonhousing.org . Read the Original article here. .


Sawmill and wood preservation firms reported lower capacity utilization rates coupled with level production and capacity throughout 2024. Despite no growth in production in 2024, utilization rates have trended downwards since 2017 as sawmills have expanded production capability. Even with more production capability, real output has not followed as output remains lower than 2018.

Capacity utilization rates are a ratio of actual production and potential production capabilities for firms. The utilization rate for sawmills and wood preservations firms was 64.7% in the fourth quarter on a four-quarter moving average basis. As utilization rates have shifted lower, the gap between full production capability and actual production has grown. Actual production is typically lower than full capability due to multiple factors ranging from insufficient materials and orders to lack of labor.

By combining the Federal Reserve’s production index and the Census Bureau’s utilization rate, we can compose a rough index estimate of what the current production capacity is for U.S. sawmills and wood preservation firms. Shown below is a quarterly estimate of the production capacity index. This capacity index measures the real output if all firms were operating at their full capacity.

Based on the data above, sawmill production capacity has increased from 2015 but remains lower than peak levels in 2011. Most of the recent capacity gains took place between 2023 and 2024, followed by little gain over the course of 2024. As evident above, there is ample room to increase production of domestic lumber, but current production levels remain much unchanged over the past several years.

Employment is an important factor for ensuring firms reach their full capacity. For sawmill and wood preservation firms, the number of employees declined to its lowest level since 2021, reporting an average of just over 89,000 employees across the industry in the fourth quarter. Employment declines, likely due to a weak lumber market in 2024, help explain why utilization rates have fallen. With fewer workers, it is less likely that a firm can increase production to its full capability.

Imports

Since U.S. firms do not produce at their full potential, imports help to supplement domestic supply, especially in the softwood lumber market. According to Census international trade data, existing tariffs on Canadian softwood lumber have not reduced the need for imports to meet domestic consumption but have made the U.S. more reliant on non-North American lumber, resulting in unnecessarily complex supply chains. The current AD/CVD Canadian softwood lumber tariff rate stands at 14.5% and is expected to double under the administrative review process by the Department of Commerce. Potential tariffs on lumber, such as the ongoing 232 investigation and 25% on all Canadian goods, could push tariffs rates on Canadian softwood lumber above 50% later this year. Higher tariffs on softwood lumber mean higher costs for builders who use lumber as a key input to construction. Given the current housing unaffordability crisis, any additional costs will continue push homeownership and affordable housing further out of reach for households in the U.S.

Discover more from Eye On Housing

Subscribe to get the latest posts sent to your email.


This article was originally published by a eyeonhousing.org . Read the Original article here. .


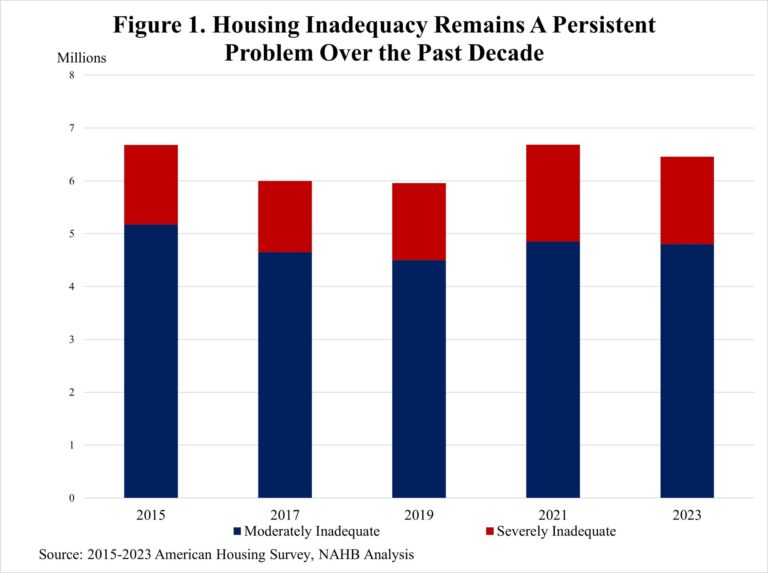
In 2023, nearly 6.45 million homes, around 5% of U.S housing stock, were classified as inadequate according to the American Housing Survey (AHS). Of these, 1.65 million homes were classified as severely inadequate, showing significant concerns over housing quality. While this reveals ongoing issues in nation’s housing conditions, it signals probable market growth for remodeling and home improvements in the year ahead.

The U.S. Department of Housing and Urban Development (HUD) defines physical adequacy based on whether a home meets the basic standard of “a decent home and a suitable living environment”. Homes are severely inadequate if they exhibit major deficiencies, such as exposed wiring, lack of electricity, missing hot or cold running water, or the absence of heating or cooling systems. Additionally, homes with at least five significant structural problems such as water leaks, large open cracks or holes in the floor also belong to this category.  Moderately inadequate homes have three or four significant structural issues, or have problems such as incomplete kitchen facilities, lack of vented heating equipment, or prolonged toilet breakdowns.

Housing inadequacy has remained a persistent issue over the past decade, shown in Figure 1.  In 2023, around 6.5 million households lived in moderately or severely inadequate housing. While the total number of inadequate homes declined slightly from 6.9 million in 2015 to 6.0 million in 2019, it rebounded to 6.7 million in 2021 and remained elevated in 2023.  The majority, around 4.8 million, of inadequate homes were moderately inadequate, while 1.65 million households lived in severely inadequate conditions in 2023.

The share of inadequate homes varies significantly by the age of the home (Figure 2). Older homes have higher rates of inadequacy. Homes built before 1940 have the highest inadequacy rate at 9%, followed by those built between 1940 and 1959 at 7%. While housing units from 1960 to 1979 show a moderate inadequacy rate of 5%, they account for the largest number of inadequate homes, with 1.2 million classified as moderately inadequate and 465,000 as severely inadequate in 2023. In contrast, newer homes (1980-Present) have lower inadequacy rates with the share steadily declining from 4% for homes built between 1980 and 1999 to 3% for those constructed from 2000 to the present.

Geographically, inadequate housing is most concentrated in smaller metro areas. Around 50.4% of moderately inadequate homes (2.4 million units) and 43.6% of severely inadequate homes (720,000 units) are in these areas in 2023. This trend is likely driven by aging housing stock and lower household income compared to major metro areas. However, major metro areas still have a substantial share of inadequate homes, with 29.7% of moderately inadequate (1.4 million) and 38.2% of severely inadequate units (631,000). Non-metro areas have the lowest total numbers, (953,000 moderately inadequate and 720,000 severely inadequate homes), though challenges persist.

In 2023, around 6.45 million households lived in inadequate housing, with more renters (3.5 million) than owners (2.8 million). Housing cost burdens varied greatly among these two groups: Among those households in inadequate homes, 1.9 million owners spent less than 30% of their income on housing, compared to 1.6 million renters. It suggests that many homeowners living in inadequate housing may indeed have the financial capacity to improve their housing conditions if they choose to do so. In contrast, renters in inadequate housing face greater financial constraints, with 1.1 million spending more than 50% of their income on housing, more than double the 480,000 cost-burdened owners. This disparity highlights the challenges renters are facing, including limited affordable housing options and a lack of control over property conditions.

Discover more from Eye On Housing

Subscribe to get the latest posts sent to your email.


This article was originally published by a eyeonhousing.org . Read the Original article here. .


Real GDP growth slowed in the fourth quarter of 2024, but the economy finished the year at a solid rate. While consumer spending continued to drive growth, gross private domestic investment detracted over a full percentage point mainly due to a decline in private inventories.

According to the “advance” estimate released by the Bureau of Economic Analysis (BEA), real gross domestic product (GDP) expanded at an annual rate of 2.3% in the fourth quarter of 2024, following a 3.1% gain in the third quarter of 2024. This quarter’s growth was higher than NAHB’s forecast of a 1.8% increase.

Furthermore, the data from the GDP report suggests that inflationary pressure persisted at the end of 2024. The GDP price index rose 2.2% for the fourth quarter, up from a 1.9% increase in the third quarter of 2024. The Personal Consumption Expenditures Price (PCE) Index, which measures inflation (or deflation) across various consumer expenses and reflects changes in consumer behavior, rose 2.3% in the fourth quarter. This is up from a 1.5% increase in the third quarter of 2024.

For the full year, real GDP grew at a healthy rate of 2.8% in 2024. It was slightly slower than the 2023 level of a 2.9% increase and matched NAHB’s forecast.

This quarter’s increase in real GDP primarily reflected increases in consumer spending, and government spending.

Consumer spending, the backbone of the U.S. economy, rose at an annual rate of 4.2% in the fourth quarter. This marks the highest annual growth rate since the first quarter of 2023. The increase in consumer spending reflected increases in both goods and services. While goods spending increased at a 6.6% annual rate, expenditures for services increased at a 3.1% annual rate.

In the fourth quarter, government spending increased at a 2.5% rate.

Nonresidential fixed investment decreased 2.2% in the fourth quarter. The decrease in nonresidential fixed investment reflected decreases in equipment (-7.8%) and structures (-1.1%). Meanwhile, residential fixed investment increased 5.3% in the fourth quarter after two consecutive quarters of declines. Within residential fixed investment, single-family structures rose 3.1% at an annual rate, improvements increased 2.7%, while multifamily structures declined 7.2%.

Compared to the third quarter, the deceleration in real GDP in the fourth quarter primarily reflected

downturns in gross private domestic investment and exports. Inventories fell and dragged down the contribution to real GDP by 0.93 percentage points. Imports decreased.

For the common BEA terms and definitions, please access bea.gov/Help/Glossary.

Discover more from Eye On Housing

Subscribe to get the latest posts sent to your email.


This article was originally published by a eyeonhousing.org . Read the Original article here. .


Real GDP of metropolitan areas rose 2.7% in 2023, with the “real estate, rental and leasing” sector contributing 0.34 percentage points and construction contracting growth by 0.11 percentage points. While many metro areas followed the national growth trend, each region has its unique economic narrative. This article explores the economic trends driving these outcomes, focusing on the leading metro areas in real GDP growth, the construction sector’s standout performers over a five-year period, and the top MSAs benefiting from growth in real estate, rental, and leasing.

In 2023, real GDP increased in 348 Metropolitan Statistical Areas (MSAs), decreased in 34 MSAs, and remained unchanged in 3 MSAs, according to the U.S. Bureau of Economic Analysis (BEA). The data, which was recently released in December 2024, shows the range of growth spanned from 42.9% in Midland, TX, to a contraction of -9.3% in Elkhart-Goshen, IN. Three MSAs—Ithaca, NY, Joplin, MO, and Longview, WA—saw no change in real GDP.

The oil and gas sector played a significant role in driving growth in many MSAs. Midland, TX, recorded the highest growth due to a surge in oil production, with the “mining, quarrying, and oil and gas extraction” industry contributing a hefty 41.2 percentage points to the metro area’s GDP growth. Furthermore, among the top five highest growth areas, four had this industry as the leading contributor.

Top Five MSAs by Real GDP Growth and Leading Contributing Industry

Metro Area2023 Real GDP Growth (%)Largest Contributing IndustryContribution (Percentage Points)Midland, TX42.9Mining, quarrying, and oil and gas extraction41.2Greeley, CO18.5Mining, quarrying, and oil and gas extraction15.5El Centro, CA16.4Agriculture, forestry, fishing, and hunting14.4Odessa, TX11.6Mining, quarrying, and oil and gas extraction7.1Wheeling, WV-OH10.7Mining, quarrying, and oil and gas extraction9.9

Construction Sector Growth (2018–2023)

From 2018 to 2023, the construction industry exhibited a mixed performance, with 140 MSAs reporting positive compound annual growth rates (CAGR), 188 recording declines, and 5 showing no change. States like Idaho, Arizona, and Florida emerged as hotspots for construction growth during this period while states in the East North Central division appear to have slowdowns in this sector.

Elizabethtown-Fort Knox, KY, led with a 14.4% CAGR in construction. This boom was primarily driven by the development of the BlueOval SK Battery Park, slated to begin production in 2025. This joint venture between Ford Motor Company and SK On, a South Korean electric vehicle (EV) supplier, is expected to be the largest EV battery manufacturing facility globally.

According to a study by the Hardin County Chamber of Commerce (HCCC), the project is estimated to:

Generate $1.6 billion in construction payroll.

Create 5,000 jobs by the end of 2025.

Require 3,100 additional housing units to accommodate new workers.

Top Five MSAs for Construction Growth (2018–2023):

Metro AreaCAGR (%)Average Contribution (Percentage Points)Elizabethtown-Fort Knox, KY14.40.45Clarksville, TN-KY10.80.03Punta Gorda, FL10.61.12Jacksonville, NC10.20.32The Villages, FL10.11.23

Real Estate, Rental, and Leasing Growth (2018–2023)

The real estate, rental, and leasing sector also showed robust growth in many regions, with 209 MSAs experiencing positive growth during the five-year period. The Villages, FL, recorded the highest CAGR at 14.1%, reflecting its status as the nation’s largest community designed for an aging population.

Other MSAs like Jonesboro, AR, saw significant real estate growth due to proximity to Arkansas State University, while Austin-Round Rock-Georgetown, TX, benefited from a population influx because of its thriving tech economy.

Top Five MSAs for Real Estate Growth (2018–2023):

Metro AreaCAGR (%)Average Contribution (Percentage Points)The Villages, FL14.13.6Jonesboro, AR12.11.2Twin Falls, ID10.81.1Austin-Round Rock-Georgetown, TX10.71.4El Centro, CA10.60.6

Visit NAHB’s dashboard for additional data and visualizations on demographics, housing market and the economy for all metro areas.

Discover more from Eye On Housing

Subscribe to get the latest posts sent to your email.


This article was originally published by a eyeonhousing.org . Read the Original article here. .


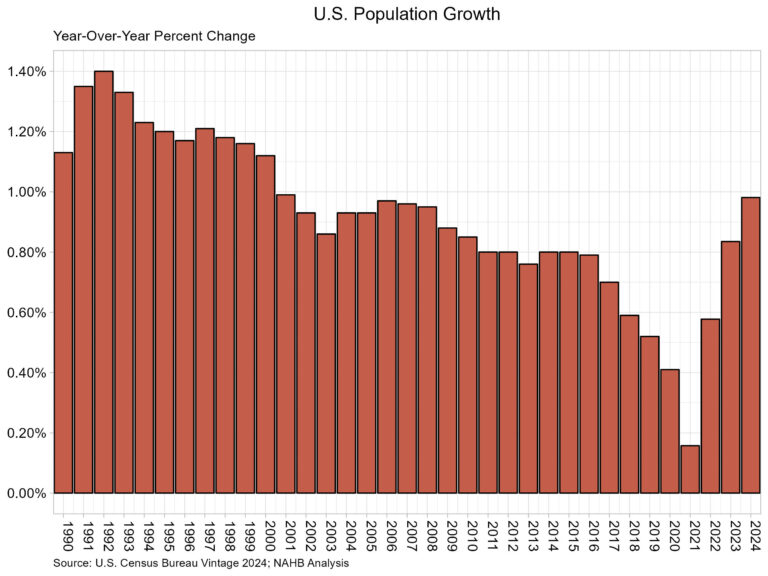
According to the U.S. Census Bureau’s latest estimates, the U.S. resident population grew by 3,304,757 to a total population of 340,110,988. The population grew at a rate of 0.98%, the highest rate since 0.99% in 2001. This also marked the third straight increase in the growth rate of the U.S. population. The vintage population estimates are released annually and represent the change in the U.S. population between July 1st of 2023 and 2024.

The Census Bureau reports that the primary source of population growth was net international migration (immigration), as international migration levels once again were higher than the previous year. The level of net international migration between 2023 and 2024 was 2,786,119. The second component of population growth is natural growth, which represents births minus deaths. Births totaled 3,605,563, down slightly from last year, while the number of deaths was reported at 3,086,925, also a decrease from last year. The natural growth, therefore, between 2023 and 2024 was 518,638.

Each region in the U.S. experienced population growth for the 2023-2024 period. The South led in population growth at 1.34% followed by the West at 0.85%. Meanwhile, the Midwest population grew 0.75%, while the Northeast grew the least at 0.59%.  

At the State level, 47 States and the District of Columbia had a population increase over the year. Of note, D.C. had the highest growth rate at 2.13%. Florida was second with population growth at 2.00% followed by Texas at 1.80%. Numerically, Texas experienced the largest population increase gaining 562,941. This was followed by Florida at 467,347 and California at 232,570.

Only three states lost population or remained level according to Census estimates. Vermont and West Virginia tied with a decline of 0.03%. Meanwhile Mississippi saw no population change.

California remained the most populous state by a healthy margin. California’s population was at 39,198,693, while the next most populous state was Texas at 31,290,831. To round out the top five States by total population the proceeding highest were Florida (23,372,215), New York (19,867,248), and Pennsylvania (13,078,751).

Discover more from Eye On Housing

Subscribe to get the latest posts sent to your email.


This article was originally published by a eyeonhousing.org . Read the Original article here. .

Pin It