Tag

Supply

Browsing


American housing market is facing a persistent shortage. Home prices have reached historic highs and affordability has declined. Normally, in response to higher prices, housing supply would increase. However, new home construction has not kept pace with population growth and household formation, especially following the surge of demand in the wake of the pandemic. Recent research has claimed that the relationship between prices and supply has become diluted over time because of regulatory barriers and political dynamics. 

 A recent working paper “America’s Housing Supply Problem: the Closing of the Suburban Frontier?” by economist Edward Glaser and Joseph Gyourko, took a deep dive into why the supply of new housing has shifted lower, especially in the sunbelt regions like Dallas, Atlanta, and Phoenix. These areas, which once led the nation in new home construction, are now seeing a sharp slowdown.  

This research showed that the once-strong link between increasing home prices and new home constructions has weakened or even reversed in many metro areas. The authors analyzed Census tract data from the 1970s to the 2010 to track how construction has responded to price changes over time. Housing markets that used to expand rapidly in response to higher prices are now largely unresponsive. This breakdown in market dynamics reflects the growing influence of regulatory barriers and political constraints. 

Land use regulations, zoning restrictions, and permitting processes have become more restrictive since the 2000s. These constraints increase the cost and difficulty of building new homes, even as home prices increase. Therefore, housing supply is less responsive to demand. The latest NAHB study on this topic shows that regulations now account for nearly $94,000 of the average new home price. Furthermore, housing supply is becoming endogenous or determined by local socioeconomic dynamics. As neighborhoods become more affluent, wealthier or in some cases higher educated, residents are more likely to oppose new development through changing the permit environment or increasing zoning restrictions. In effect, demand is no longer driving the supply through NIMBYism. 

The authors use prices and density to explore where and why new housing is built. The traditional negative relationship between density and housing construction has weakened, or in some cases, reversed in recent decades. The results show that housing supply growth has slowed significantly in low-density areas, particularly in the areas with higher home prices, where much of the housing expansion would traditionally have been expected. This shift reflects the growing impact of regulatory barriers, as suburban and low-density areas now face stricter zoning, and longer permitting processes. These factors make building more homes more difficult and less responsive to demands or market signals. 

The striking finding of this new analysis is that the traditional engine of home building in the South is weakening. The South has had stronger population growth and lower regulatory barriers to land development and home construction than most of the rest of the country.  But as incomes have increased, the authors claim that regulatory barriers have increased, slowing this once fast-growing region. 

Despite the higher home prices, builders face challenges, including higher interest rates, rising inflations, lot and labor shortages, and regulations, that prevent them from building more new homes. According to NAHB’s estimates, based on 2021 data, the U.S. needs 1.5 million additional units to fill the housing shortage gap. In short, the combination of regulatory barriers and economic headwinds continues to hamper housing production nationwide and these challenges are expanding to regions of the country that were once less affected. 

Discover more from Eye On Housing

Subscribe to get the latest posts sent to your email.


This article was originally published by a eyeonhousing.org . Read the Original article here. .


If someone in your home got sick or injured today, or if there was a natural disaster (knock on wood), would you have everything you need to care for yourself and the other members of your household? If you haven’t peeked in your medicine chest in recent memory, or simply haven’t gotten around to putting your emergency supplies together, here’s what to include in your kits, where to store them and how to maintain them properly. It’s sort of like having your teeth cleaned — you will feel good when it’s done.

Amelia Hallsworth PhotographySave Photo
1. First-aid kit. Too much stuff can be confusing to sort through in an emergency. Keep your supplies streamlined and well organized, and take the time to get familiar with each item in your kit before you need them.

Taking a first aid and CPR course from your local Red Cross is smart, particularly for those with kids or elders in the house.

Where to store it: Keep your first-aid supplies in a centrally located place (such as the kitchen or mudroom) for easy access in an emergency, and make sure every member of the household knows where it is.

If you have young children in the home, store it up high. For homes with both young and older kids, show the older children how to use a stepladder to retrieve the kit if needed, stressing that it is for emergencies only, and is not a toy.

Wanda Ely Architect Inc.Save Photo
What to include: In addition to any personal medications (inhaler for asthma, etc.), consider adding the following items to your kit. Bandages in assorted sizesAbsorbent compressesSterile gauze padsAntiseptic wipesCloth tapeAntibiotic ointmentSpace blanketNon-latex gloves (in case of allergy)ScissorsTweezersThermometerInstant cold compressRoller bandageHydrocortisone ointmentFirst aid bookletSee the Red Cross for a complete list.
Julie Ranee PhotographySave Photo

2. Medical kit. Being prepared for common illnesses, aches and pains can save a lot of hassle and midnight drugstore runs. Check expiration dates on your prescription medications, and return leftovers to the pharmacy (call ahead: most will accept them). Medications flushed down the toilet can enter our water supply; be on the safe side and take the time to dispose of them properly.

Davenport Building SolutionsSave Photo
Where to store: Humidity and heat can damage ingredients in most medications, so do not store them in the medicine cabinet, which tends to be humid. Try a hall closet or high kitchen cupboard (away from the stove) instead. If you have medications that must be refrigerated, and you have kids at home, store them in a locked box in the fridge to prevent accidental ingestion.

Because both over-the-counter and prescription medications can be dangerous when not taken as intended, it is best to keep them high and hidden, whether or not you have kids in the house. Safely dispose of unused, unneeded and expired medications.

California ClosetsSave Photo
What to include: Consider keeping the following items in your medical kit.
Antibiotic ointmentBand-AidsTweezersFever reducers and pain relieversAspirinThermometerRubbing alcoholHydrogen peroxideAntacidsAntihistaminesAnti-itch lotionLaxativesAnti-diarrhea medicationCold, cough and flu medicationsYou may wish to consider adding some natural remedies that serve the same purpose as one or more of the items above. Consult your health care practitioner for more ideas.
The Cavender DiarySave Photo
3. Emergency preparedness kit. If you’ve been putting off creating an emergency kit, make a point of doing so soon. Be prepared!

Where to store: Don’t hide your kit so deep in the basement or garage that you can’t find it when you need it. In the garage near the back door, in a coat closet near the front door or in the pantry are all good choices.

Storing your supplies in a brightly colored backpack is a smart choice, as it can easily be found and toted along if you ever needed to evacuate your home.

How to be prepared for an emergency evacuation

Julie Ranee PhotographySave Photo
What to include: The quickest and easiest way to ensure you have a well-stocked emergency kit is to order one from the Red Cross store. If you want to create your own, consult the list on the kit they offer, and gather the items yourself.

Supplement your basic kit with personal items you would want in an emergency: medications, favorite shelf-stable foods, a change of clothes for each person in the house, pet food, plus something to read, play or do. Finally, tuck in a list of emergency numbers and a solar charger for your cellphone.

Home & Garden Design, Atlanta – Danna Cain, ASLASave Photo
4. Supplemental kits for pets, car and more. Depending on your lifestyle (city dwellers may not need a car kit) and household (pets or not) you may want to put together a few smaller kits tailored to your needs. Homes with kids may want to keep a spare first-aid kit in the backyard or favorite play space where injuries are likely to occur, while very large homes may require several first-aid kits.

Maintaining your kits: Try to tie in maintaining your medical and emergency kits with another chore you do every six months or so, such as steam-cleaning your carpet or inspecting your gutters. Check for and dispose of expired items, and replace as necessary. Then give yourself a big pat on the back and revel in the feeling of being prepared.

More: How to pick an emergency generator


This article was originally published by a
www.houzz.com . Read the Original article here. .


Manufactured homes play a measurable role in the U.S. housing market by providing an affordable supply option for millions of households. According to the American Housing Survey (AHS), there are 7.2 million occupied manufactured homes in the U.S., representing 5.4% of total occupied housing and a source of affordable housing, in particular, for rural and lower income households.

Often thought of as synonymous to “mobile homes” or “trailers”, manufactured homes are a specific type of factory-built housing that adheres to the U.S. Department of Housing and Urban Development’s (HUD’s) Manufactured Home Construction and Safety Standards code. To qualify, a manufactured home must be a “movable dwelling, 8 feet or more wide and 40 feet or more long”, constructed on a permanent chassis.

The East South Central division (Alabama, Kentucky, Mississippi and Tennessee) have the highest concentration of manufactured homes, representing 9.3% of total occupied housing. The Mountain region follows with 8.5%, while the South Atlantic region holds 7.7%.

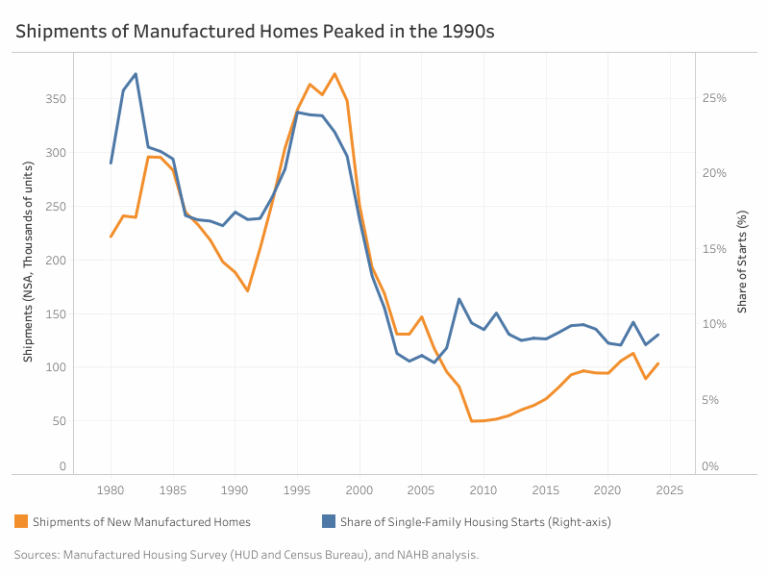
The 1990s saw a surge in manufactured home shipments, peaking in 1998. During this period, manufactured homes constituted 17% to 24% of new single-family homes.  However, shipments declined in the early 2000s, coinciding with a rapid increase in site-built housing construction leading up to the 2008 housing crisis. Since then, manufactured homes have stabilized at around 9% to 10% of new housing.

Characteristics of the 2023 Manufactured Home Stock

Given that most manufactured homes were produced in the 1990s, a significant portion of the existing manufactured home stock — approximately 72.2% — was built before 2000. Consequently, 7.7% of these homes are classified as inadequate compared to 5% of all homes nationwide. About 2% are considered severely inadequate and exhibit “major deficiencies, such as exposed wiring, lack of electricity, missing hot or cold running water, or the absence of heating or cooling systems”. However, with proper maintenance, manufactured homes can be as durable as site-built homes.

Currently, 57% of the occupied manufactured homes stock are single-section units, while 43% are multi-sections, according to the AHS. Single-section homes are manufactured homes that can be transported from factory to placement in a single piece while multi-sections are transported in multiple pieces and are joined on site. However, data from the Census show that newer shipments indicate a shift toward multi-section homes.

Most single-section homes are less than 1,000 square feet and contain five total rooms in the house — typically two bedrooms and three bathrooms. In contrast, multi-section homes usually range from 1,000 to 2,000 square feet and have six rooms, comprising three bedrooms and three bathrooms.

Demographics of Manufactured Homes Residents

Manufactured homes serve as a crucial housing option, particularly for those living in rural or non-metro areas. AHS data highlight a stark contrast between the locations of single-family and manufactured home residents. While most manufactured home residents (53%) live in rural areas, single-family residents are mostly concentrated (67%) in urbanized areas — defined as territories with a population of 50,000 or more. In comparison, only 33% of manufactured home residents reside in urbanized areas. Residents of both manufactured and single-family homes are less common in urban clusters — areas with populations between 2,500 and 50,000 — comprising just 13% and 9%, respectively.

The median age of a manufactured home householder is 55, the same as single-family householders. However, most manufactured home householders (37.8%) have an education attainment level of high school completion compared to single-family householders whose largest group (24.8%) have completed a bachelor’s degree.

Income disparities are also significant. The median household income for manufactured home residents is $40,000, far below the $85,000 median income for single-family householders. The gap widens among homeowners, with manufactured homeowners earning a median of $41,500 versus $93,000 for single-family homeowners.

Household CharacteristicManufactured Homes HouseholdSingle-Family HouseholdAge (Median)5555Majority Education Attainment LevelHigh school or equivalency (37.8%)Bachelor’s degree (24.8%)Annual Household Income (Median)$40,000$85,000Annual Household Income of Homeowners (Median)$41,500$93,000Sources: 2023 American Housing Survey (AHS) and NAHB analysis.

Cost of Buying and Owning Manufactured Homes

One of the key advantages of manufactured homes is affordability. The average cost per square foot for a new manufactured home in 2023 was $86.62, compared to $165.94 for a site-built home (excluding land costs) — a difference of $79.32 per square foot. This difference in cost has only grown over the decade from $51.84 per square foot in 2014. For a 1,500-square-foot home, this translates to a savings of approximately $118,980, and this savings has grown despite the average cost of manufactured homes increasing at a higher growth rate of 7.4% CAGR versus 6.1% CAGR for new single-family homes.

Owning a manufactured home is also more affordable in total housing cost, which includes mortgage payments, insurance, taxes, utilities and lot rent. According to the AHS, owners of a single-section manufactured home have a median total monthly housing cost of $563, while the cost for a multi-section home is $805. In contrast, the median monthly cost of owning a single-family home is $1,410.

Despite the lower costs associated with manufactured homes, affordability remains a challenge for many owners. Among single-section manufactured homeowners, 36.6% are considered cost-burdened, meaning they spend 30% or more of their income on housing. This is slightly higher than the 28.4% of multi-section manufactured homeowners and the 27.6% of single-family homeowners facing similar financial strain. This disparity underscores the reality that even though manufactured homes are a more affordable option, lower-income households are still disproportionately burdened by housing costs.

Manufactured Home Pricing

Data on manufactured home appreciation is limited. However, the Federal Housing Finance Agency (FHFA) publishes a quarterly house price index for manufactured homes. Comparing the indices for manufactured and site-built homes, manufactured homes have closely followed the appreciation trends of their site-built counterparts. Between the first quarter of 2000 and the last quarter of 2024, the index value for manufactured homes increased by a cumulative 203.7%, slightly surpassing the 200.2% increase for site-built homes. This indicates that the manufactured home markets face much of the same demand opportunities and supply challenges of the broader housing market.

It is important to note that this data reflects only manufactured homes financed through conventional mortgages as real property, acquired by Fannie Mae and Freddie Mac (the Enterprises). In contrast, the majority of new manufactured homes are titled as personal property, which is not eligible for conventional mortgage financing because the Enterprises do not acquire chattel loans. Nonetheless, it is common for manufactured homes to be placed on private land even though the unit is under a personal property title — a title that applies to movable assets, such as vehicles, tools or equipment, and furniture, whereas a real estate property title includes land and any structures permanently attached to it.

Despite this distinction, there has been a steady increase in the share of manufactured homes titled as real estate. Since 2014, the percentage of real estate-titled manufactured homes has grown from 13% to 20% in 2023, indicating a positive trend toward greater financial recognition and stability for these homes.

Zoning Restrictions and the Future of Manufactured Homes

Manufactured homes provide a cost-effective housing solution, particularly in rural areas where the transportation and material costs for site-built homes can be significantly higher. However, restrictive zoning laws often limit their placement in urban areas. Regulations such as bans on manufactured home communities and large lot size requirements can substantially increase costs, making it difficult to establish manufactured housing in cities. Reducing these zoning barriers could not only expand affordable housing options in high-cost urban areas but also improve access to essential services such as healthcare and economic opportunities for lower-income communities.

A successful example of zoning reform comes from Jackson, Mississippi, where city officials partnered with the Mississippi Manufactured Housing Association (MMHA) to launch a pilot program highlighting the potential of prefabricated and manufactured homes as affordable housing solutions. As part of the initiative, the city revised its zoning regulations to distinguish manufactured and modular housing from pre-1976 “mobile homes,” which had long been banned. Previously, manufactured homes were classified under the same category, restricting their placement. The new ordinance now permits manufactured housing within city limits, albeit with a discretionary use permit, paving the way for greater affordability and accessibility in urban housing.

Conclusion

Manufactured homes make up only 5% of the total housing stock but provide an alternative form of housing that meets the needs of various households, particularly in rural areas. Although they offer a lower-cost option compared with site-built homes, factors such as an aging housing stock, financing limitations and zoning restrictions could influence their accessibility and long-term viability.

Trends such as the increasing prevalence of multi-section homes and a growing share of units titled as real estate suggest a gradual shift in consumer preferences toward housing options that more closely resemble site-built homes in size, functionality and financing. As housing affordability remains a key concern, manufactured homes continue to play a role as an affordable supply in the broader housing landscape, and expanding their use through education, innovation and zoning reform could improve access to cost-effective housing.

Footnotes:

Discover more from Eye On Housing

Subscribe to get the latest posts sent to your email.


This article was originally published by a eyeonhousing.org . Read the Original article here. .


With the end of 2024 approaching, NAHB’s Eye on Housing is reviewing the posts that attracted the most readers over the last year. In June, Chief Economist Rob Dietz highlighted the importance of both new and existing home inventory in understanding housing market dynamics, emphasizing that while rising inventory may signal price moderation, the current low levels of resale homes still support home construction and price growth.

Total (new and existing) home inventory is an important measure for gauging and forecasting home prices and home construction impacts. The intuition is clear: more inventory yields weaker or declining home price growth and home building activity. Lean inventory levels lead to price growth and gains for home building.

The metric “months’ supply” is a common measure of current market inventory. For both new and existing home markets, months’ supply converts inventory from a count of homes into a measure of how many months it would take for that count of home inventory to be sold at the current monthly sales pace.

Housing economists typically advise that a balanced market is a five- to six-months’ supply. Larger inventory levels than this benchmark risk producing deteriorating conditions for price growth and building activity.

In the Census May 2024 newly-built home sales data, the current months’ supply of inventory is 9.3. Some analysts have noted that, given the five- to six-month benchmark, that this means the building market for single-family homes is possibly oversupplied, implying declines for construction and prices lie ahead.

However, this narrow reading of the industry misses the mark. First, it is worth noting that new home inventory consists of homes completed and ready to occupy, homes currently under construction and homes that have not begun construction. That is, new home inventory is a measure of homes available for sale, rather than homes ready to occupy. In fact, just 21% of new home inventory in May consisted of standing inventory or homes that have completed construction (99,000 homes).

More fundamentally, an otherwise elevated level of new home months’ supply is justified in current conditions because the inventory of resale homes continues to be low. Indeed, according to NAR data, the current months’ supply of single-family homes is just 3.6, well below the five- to six-month threshold. It is this lack of inventory that has produced ongoing price increases despite significantly higher interest rates over the last two years.

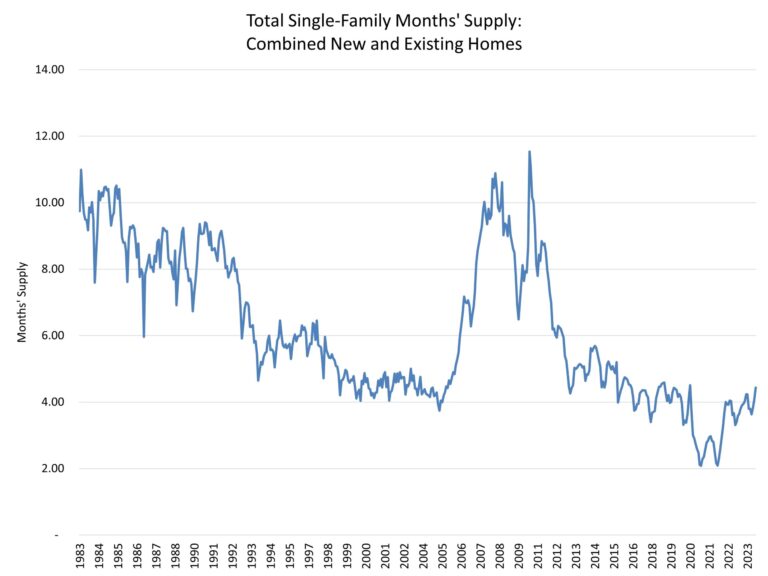
Taken together, new and existing single-family home inventory, the current months’ supply of both markets is just 4.4, as estimated for this analysis. This is admittedly higher than the 3.6 reading, using this approach, from a year ago, but it still qualifies as low. See the following graph for total months’ supply going back to the early 1980s using data from the NAR existing home sales series and the Census new home sales data, as calculated by NAHB.

Yes, inventory is rising and will continue to rise, particularly as the mortgage rate lock-in effect diminishes in the quarters ahead. But current inventory levels continue to support, on a national basis, new construction and some price growth, per this current reading of total months’ supply.

Further, the housing deficit (NAHB estimates about 1.5 million homes), which was produced by a decade of underbuilding due to a perfect storm of supply-side challenges, has generated a separation in the normally co-linear measures of new and existing home months’ supply. This separation became particularly pronounced during the COVID and post-COVID period of the housing market. June 2022 recorded the largest ever lead of new home months’ supply (9.9) over existing single-family home months’ supply (2.9). This separation makes it clear that an evaluation of current market inventory cannot simply examine either the existing or the new home inventory in isolation.

With the current total months’ supply at 4.4, what does this mean for the market, particularly with respect to pricing and construction trends? To examine this question, I calculated the total months’ supply reported on the first graph in this post. I then examined price movements and single-family construction starts data with respect to current total months’ supply. The results are broadly consistent with the existing rules of thumb regarding market conditions.

The horizontal axis plots total months’ supply for monthly data going back to the start of 1988 (the starting point of the price data used for this analysis). The vertical axis records the corresponding year-over-year home price growth for the same month as measured by the Case-Shiller Home Price Index. The trend line is estimated using a simple linear regression. The statistical correlation indicates that home price growth, on average, turns negative when inventory reaches an 8-months’ total supply (on the graph, the trend line intersects the horizontal axis, measuring zero percent price growth, at 8 months’ supply).

To be clear, this does not mean that prices will not fall until months’ supply exceeds eight. For example, 24% of the data registering 6.5 to 7.5 months’ supply recorded home price declines. For the data in the range of 7.5 months’ supply to less than 8 months’ supply, this share increased to 36%. Overall, for months with less than an eight months’ supply, it was less likely than not to see home price declines, but it did happen in certain market conditions.

And to be complete, home prices did not always fall when total inventory was greater than an eight months’ supply. For example, for months with a months’ supply measure of 8.5 to 9.5, homes prices increased 36% of the time.

Taken together, these general trends indicate that a months’ supply of less than eight has historically been positive for nominal home price growth. That’s where market conditions are today.

What about impacts for single-family home building? The data are little less clear (as seen by smaller R-squared measures on the trends), but this should not be a surprise. Home building is a function of both demand-side housing factors, like mortgage interest rates, as well as volatile supply-side variables like the cost and availability of labor, lots, lending, lumber/materials, and legal/regulatory policies and fees. Nonetheless, using Census housing starts data and the same total months’ supply metric, a trend is apparent, and it is one that matches up well with existing rules of thumb.

As the chart above indicates, a simple linear trend of monthly data going back to mid-1982 (the limit of the supply data) indicates that at roughly 6-months’ total home inventory, single-family home building reaches a zero percent year-over year growth rate. As before, and as seen in the graph above, the correlation is not absolute.

For example, for otherwise tight 4.5 months’ to 5.5 months’ new and existing home supply, single-family home building did contract 27% of the time. On the other hand, for markets with more inventory than the benchmark (6.5 to 7.5 months’ supply), home building expanded 30% of the measured months. As with home prices, the trend is not absolute, but the six-months’ supply benchmark is a useful rule of thumb for examining whether builders will reach a neutral stance for expanding home construction activity.

It is worth noting that home builder production can occur with a lag with respect to inventory conditions. For example, the time between permit approval and the start of construction was approximately 1.3 months in 2022 (2023 data will be available in the coming months). And single-family construction time averaged 8.3 months, per NAHB estimates using Census data. Mindful of these lags, I examined the impact of total months’ supply on single-family starts with both a three-month and six-month lag. In both analyses, the 6-months’ benchmark was again validated. For a relatively straightforward analytical approach, this represents a fairly robust result, albeit one with a notable amount of statistical noise due to supply-side factors associated with construction inputs and constraints.

The data thus show that current market conditions are unusual, with a large gap between new and existing single-family months’ supply. Analyses that rely on just one of these measures will be misleading. A total months’ supply measure that measures both new and existing inventory is required to gauge the status of inventory conditions and possible impacts on home prices and home building.

Furthermore, the historical correlations suggest that home builders will significantly slow home building activity at a 6-months’ supply of total housing inventory. And price declines become more likely than not at an 8-months’ supply.  

In the meantime, builders, housing stakeholders, and analysts should view the current nine months’ supply for new homes within its proper context. This will be particularly important as resale levels continue to rise, with additional gains expected to occur as the mortgage-rate lock-in effect diminishes in the quarters ahead. However, keep in mind, lower mortgage rates will also unambiguously improve housing affordability conditions and price prospective home buyers back in the market, thus putting downward pressure on the months’ supply metric by increasing sales rates.

With each Census new home sales report, NAHB will continue to estimate and watch the total months’ supply measure. But given this analysis, at 4.4 total months’ supply, inventory levels have increased but remain low and supportive of limited gains for home building and upward pressure on nominal home prices.

Discover more from Eye On Housing

Subscribe to get the latest posts sent to your email.


This article was originally published by a eyeonhousing.org . Read the Original article here. .


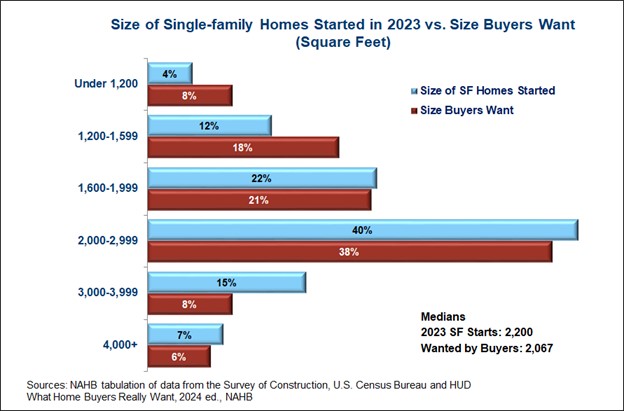
The share of new single-family homes built in the 1,600-3,000 square-foot range closely matches the share of buyers who want homes of that size, according to recent surveys from NAHB and the U.S. Census Bureau. The surveys show that 21% of buyers want homes with 1,600 to 1,999 square feet, and 22% of new single-family homes started in 2023 have that much floor space. In the next tier up, 38% of buyers want homes with 2,000 to 2,999 square feet, and 40% of new single-family homes fall within that size range.

Results on the square footage buyers want in their next home were published in the 2024 edition of What Home Buyers Really Want, based on a representative sample of 3,008 recent and prospective home buyers conducted in 2023. The size of homes started comes from NAHB tabulation of the recently released 2023 data file from the Census Bureau’s Survey of Construction.

Outside of the 1,600-3,000 square-foot range, the match between what buyers want and what builders provide is not as close. While 26% of buyers want homes under 1,600 square feet, only 16% of single-family homes started in 2023 were that small. And while 22% of new homes have at least 3,000 square feet, only 14% of buyers are looking for homes that large.

Part of the reason for the apparent mismatch, of course, is that builders are compensating for the existing stock of housing, much of which was built decades ago when homes tended to be smaller. According to the latest American Housing Survey (funded by HUD and conducted in odd-numbered years by the Census Bureau), a full one-third of existing homes in the U.S. have less than 1,500 square feet of floor space. Moreover, the median size of an existing single-family detached home is 1,800 square feet, compared to 2,200 square feet for single-family homes started in 2023 and the 2,067 square feet that home buyers say they want in the NAHB survey.

In other words, the median buyer wants a home that is 133 square feet smaller than the median new single-family home, but still 267 square feet larger than the median existing single-family detached home.

Discover more from Eye On Housing

Subscribe to get the latest posts sent to your email.


This article was originally published by a eyeonhousing.org . Read the Original article here. .

Pin It