Through April 2026, residential construction activity remained uneven across housing sectors. Single-family permitting continued to soften compared with a year ago, reflecting persistent affordability challenges and elevated borrowing costs, while multifamily permitting posted solid gains supported by stronger activity in several regions. Regional and state-level permit data reveal notable differences in housing market conditions across the country.
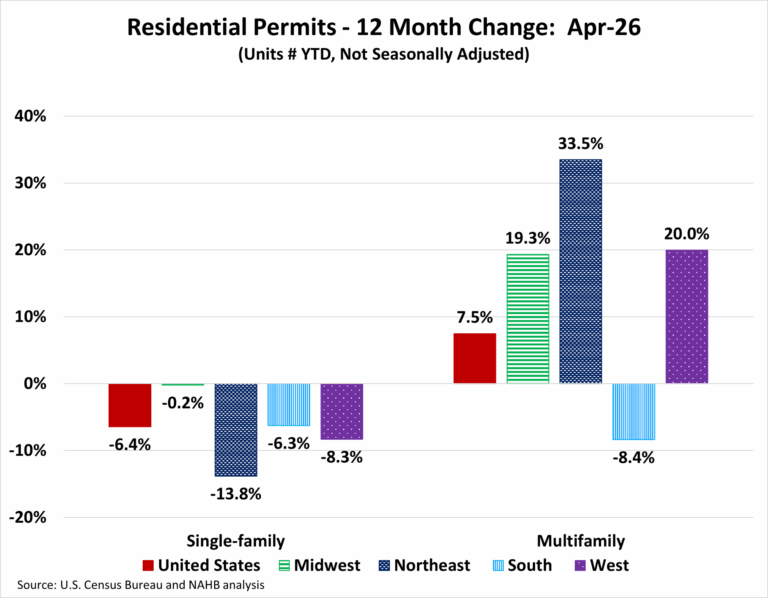
Over the first four months of the year, the number of single-family permits issued nationwide reached 299,642. On a year-over-year basis, this represents a 6.4 percent decline compared with the April 2025 total of 320,259. On the other hand, multifamily permitting activity was stronger, with 166,252 permits issued nationwide, marking a 7.5 percent increase from the same period last year.
Regionally, year-to-date single-family permitting declined in all four regions through April. The Midwest was essentially flat, the South declined by 6.3 percent, the West dropped 8.3 percent, and the Northeast fell 13.8 percent. Multifamily permits increased in three of the four regions, led by gains in the Northeast (up 33.5 percent), followed by the West (up 20.0 percent), and the Midwest (up 19.3 percent). The South saw an 8.4 percent decline, driven largely by reductions in large metro areas across Southern states.
At the state level, 13 states and the District of Columbia recorded year-over-year increases in single-family permits in April, with gains ranging from 28.0 percent in the District of Columbia to 0.6 percent in Nebraska and Minnesota. The remaining 37 states reported declines, led by Hawaii, which posted the steepest drop at 27.1 percent.
The ten states issuing the highest number of single-family permits accounted for 63.1 percent of all single-family permits issued nationwide. Texas led the country with 48,328 permits issued at the end of April 2026, although this represented an 8.2 percent decline compared with April 2025. Florida, the second-highest state, saw permits fall by 6.3 percent, while North Carolina, ranked third, experienced a decline of 12.6 percent.
Between April 2026 and April 2025, 34 states recorded increases in multifamily building permits, while 16 states and the District of Columbia experienced declines. Rhode Island posted the largest percentage increase, with multifamily permits surging 250.6 percent, rising from 170 to 596 units. In contrast, Nevada recorded the steepest decline, with permits falling 78.5 percent, from 3,426 to 738 units.
The ten states issuing the highest number of multifamily permits accounted for 61.3 percent of all multifamily permits issued nationwide. Over the first four months of 2026, California, which issued the most multifamily permits, recorded a substantial increase of 57.0 percent. Texas, the second-highest state, posted a decline of 20.6 percent, while Florida, ranking third, saw multifamily permits fall by 41.3 percent.
At the local level, the following are the ten metropolitan areas with the highest number of single-family permits issued.
Below are the ten metropolitan areas with the highest levels of multifamily permitting activity.
This article was originally published by a eyeonhousing.org . Read the Original article here. .