Tag

Steady

Browsing


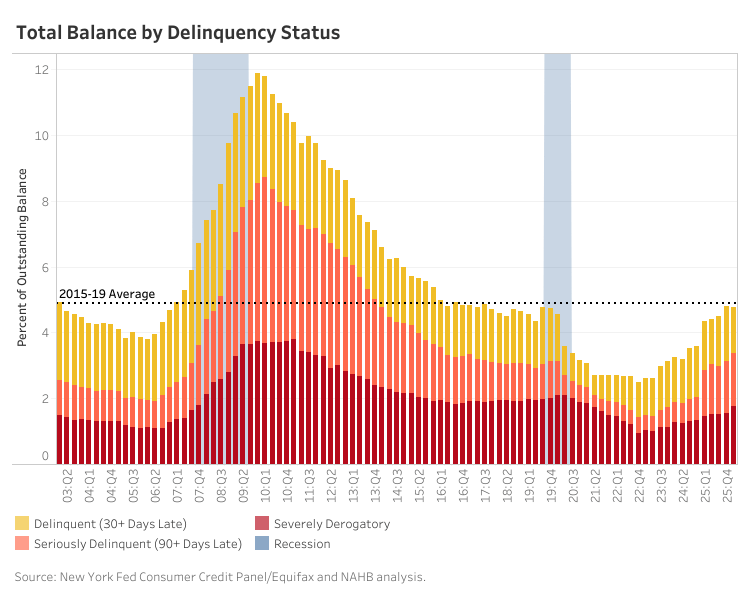
Consumer loan delinquency rates continued to normalize in the first quarter of 2026 as pandemic-related disruptions diminished and credit conditions moved closer to historical norms.  According to the latest Quarterly Report on Household Debt and Credit from the Federal Reserve Bank of New York, about 4.8% of outstanding household debt balances were in some stage of delinquency, unchanged from the previous quarter but above the unusually low levels observed during the pandemic period.

The composition of delinquent balances also points to increasing persistence of financial stress among borrowers. Loans categorized as severely derogatory—which are delinquent balances with reports of repossession, charge-off to bad debt, or foreclosure—increased of 0.3 percentage points in the first quarter of 2026 compared to the previous quarter to 1.8%. Likewise, balances that were 120 or more days delinquent have steadily trended upward since 2022 as more borrowers who fall behind are remaining delinquent for longer periods rather than catching up on missed payments.

Looking at seriously delinquent loans, defined as balances 90 or more days past due, conditions continue to diverge across loan types. Credit cards remain the top area of concern. Approximately 13.1% of credit card balances were seriously delinquent in the first quarter of 2026, increasing 0.4 percentage points from the previous quarter and quickly approaching levels last seen following the Great Recession. The sustained rise in seriously delinquent credit card balances since mid-2022 suggests many households increasingly relied on revolving debt to manage higher everyday living costs during the inflation surge and are now struggling to keep up with repayment.

Student loan balances that were seriously delinquent also continued rising following the resumption of collections and credit reporting after the payment pause. About 10.3% of student loan balances were 90+ days delinquent in the first quarter, up from 9.6% at the end of 2025. Furthermore, roughly 1 million federal student loan borrowers entered default in the last quarter of 2025, followed by another 2.6 million borrowers in the first quarter of 2026, as missed payments began progressing through the federal default timeline. The study also noted that the student loan borrowers entering default were likely to be delinquent on other forms of debt, and the financial strain could intensify as collection efforts resume.

Auto loan performance also continued deteriorating in the first quarter. The share of auto loan balances that were seriously delinquent rose to 5.6%, the highest level since 2003. Elevated vehicle prices and financing costs which rose during the pandemic and have remained sticky, continue to pressure many borrowers, particularly those with lower credit quality.

Mortgage debt, by contrast, remains comparatively healthy despite inching up in recent years. About 1.1% of mortgage balances were seriously delinquent, remaining low by historical standards. Strong homeowner equity positions and historically low fixed-rate mortgages continue supporting mortgage credit performance even as broader consumer credit conditions weaken.

Overall, household balance sheets show growing financial strain especially within non-housing consumer debt categories, with gradual and persistent deterioration in credit card, student loan, and auto loan performance.


This article was originally published by a eyeonhousing.org . Read the Original article here. .

Overall confidence in the market for new multifamily housing held steady year-over-year in the first quarter, according to the Multifamily Market Survey (MMS) by the National Association of Home Builders (NAHB). The MMS produces two separate indices. The Multifamily Production Index (MPI) had a reading of 44, unchanged year-over-year, while the Multifamily Occupancy Index (MOI) had a reading of 69, dropping 13 points year-over-year.

Multifamily developer sentiment is roughly where it was at this time last year, although the combination of regulatory hurdles, interest rates, insurance costs and volatility in material prices is threatening the viability of some projects. Also, in some markets, developers are reporting that it has become more difficult to obtain permits for unsubsidized projects.

The MPI and MOI continue to show that the market for garden and low-rise apartments typical of outlying areas is stronger than the market for mid- and high-rise apartments. The gap is narrowing year-over-year for new multifamily construction (i.e., blue line), while widening for the occupancy of existing apartments (i.e., orange line). NAHB is projecting that multifamily starts will increase slightly in 2026, but current production rates are unlikely to be sustained through 2027.

Multifamily Production Index (MPI)

The MMS asks multifamily developers to rate the current conditions as “good”, “fair”, or “poor” for multifamily starts in markets where they are active. The index and all its components are scaled so that a number above 50 indicates that more respondents report conditions as good rather than poor. The MPI is a weighted average of four key market segments: three in the built-for-rent market (garden/low-rise, mid/high-rise, and subsidized) and the built-for-sale (or condominium) market.

There were two components which experienced increases year-over-year, while the other two experienced decreases during the first quarter. The component measuring mid/high-rise rose seven points to 35, while the component measuring subsidized units increased six points to 56. On the other hand, the component measuring garden/low-rise fell six points to 48 while the component measuring built-for-sale units inched down one point to 37. Only the component measuring subsidized units was above the break-even point of 50.

Multifamily Occupancy Index (MOI)

The survey also asks multifamily property owners to rate the current conditions for occupancy of existing rental apartments in markets where they are active as “good”, “fair”, or “poor”.  Like the MPI, the MOI and all its components are scaled so that a number above 50 indicates more respondents report that occupancy is good than poor. The MOI is a weighted average of three built-for-rent market segments (garden/low-rise, mid/high-rise, and subsidized). 

All three MOI components experienced year-over-year decreases in the first quarter of 2026; the mid/high-rise component dropped 17 points to 59, the garden/low-rise component fell 11 points to 71, and the subsidized component decreased nine points to 80. Nevertheless, all three MOI components remain well above the break-even point of 50.

For more recent information about the market, the survey contains a separate question asking multifamily developers to compare current market conditions to conditions three months earlier. In the first quarter of 2026, 21% of respondents said the current market is better, and 19% said it is worse. However, the majority of developers—60%—said that the market is currently about the same as it was three months ago.

The MMS was re-designed in 2023 to produce results that are easier to interpret and consistent with the proven format of other NAHB industry sentiment surveys. Until there is enough data to seasonally adjust the series, changes in the MMS indices should only be evaluated on a year-over-year basis.

Please visit NAHB’s MMS web page for the full report.


This article was originally published by a eyeonhousing.org . Read the Original article here. .
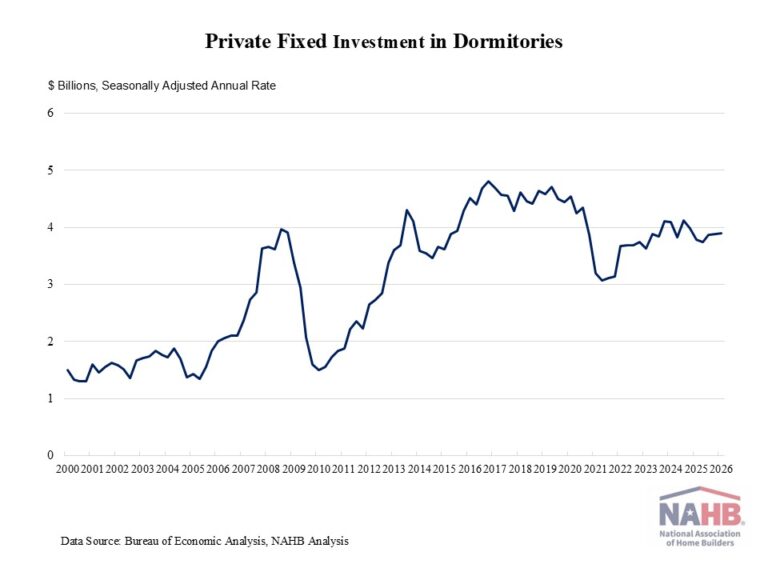

Private fixed investment in student dormitories edged up 0.1% in the first quarter of 2026, holding at a seasonally adjusted annual rate (SAAR) of $3.9 billion. This modest gain marked a third consecutive quarterly increase, despite continued pressures from elevated interest rates. However, on a year-over-year basis, investments in dorms remained almost unchanged.

Private fixed investment in student housing experienced a surge after the Great Recession, as college enrollment increased from 17.2 million in 2006 to 20.4 million in 2011. However, during the pandemic, private fixed investment in student housing declined drastically from $4.4 billion (SAAR) in the last quarter of 2019 to $3 billion in the second quarter of 2021. According to the National Student Clearinghouse Research Center, college enrollment fell by 3.6% in the fall of 2020 and by 3.1% in the fall of 2021.

Since then, private fixed investment in dorms has rebounded, as college enrollments show a gradual recovery from pandemic-driven declines. Effective in-person learning requires college students to return to campuses, boosting the student housing sector. Still, demographic trends are reshaping the outlook for student housing. The U.S. faces slower growth in the college-age population as birth rates declined following the Great Recession. As a result, total enrollment in postsecondary institutions is projected to only increase 8% from 2020 to 2030, according to the National Center for Education Statistics, well below the 37% increase between 2000 and 2010.

Despite recent fluctuations, student housing construction shows signs of recovery, and future growth is expected in response to increasing student enrollment projections.


This article was originally published by a eyeonhousing.org . Read the Original article here. .
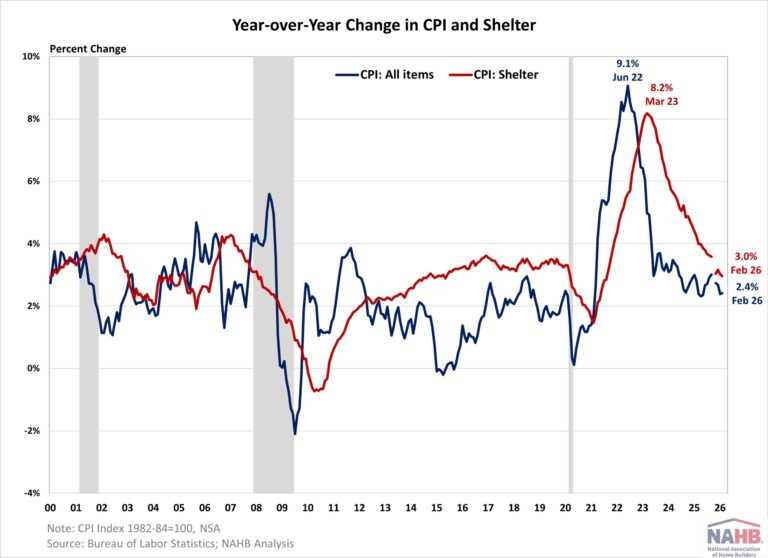

After months of downward trend, inflation held steady at an eight-month low in February. This report does not reflect the recent surge in oil prices due to Iran conflict beginning February 28. Higher oil prices will likely translate into higher gasoline costs and impact other sectors associated with transportation including airline tickets. This renewed inflation concern would complicate Fed policy especially given the recent weaker-than-expected job report. Additionally, lingering effects from government shutdown will continue to suppress the shelter index through April.

On a non-seasonally adjusted basis, the Consumer Price Index (CPI) rose by 2.4% in February from a year ago, unchanged from January and matching the lowest level since May 2025, according to the Bureau of Labor Statistics (BLS) latest report. The “core” CPI, excluding the volatile food and energy components, increased by 2.5% over the past twelve months, also unchanged from January. The housing shelter index, which makes up a large portion of “core” CPI, rose 3.0% over the year, holding steady from last month. Meanwhile, the component index of food rose by 3.1%, and the energy component index increased by 0.5%.

On a monthly basis, the CPI rose by 0.3% in February (seasonally adjusted), and the “core” CPI increased by 0.2%.

The price index for a broad set of energy sources rose by 0.6% in February, with the decline in electricity (-0.7%) offset by increases in gasoline (+0.8%), natural gas (+3.1%) and fuel oil (+11.1%). Meanwhile, the food at home index rose by 0.4%, while the food away from home index increased by 0.3% in February.

The index for shelter continued to be the largest contributor to the overall monthly increase in all items index. Other top contributors that rose in February included indexes for medical care (+0.5%), apparel (+1.3%), household furnishings and operations (+0.3%), airline fares (+1.4%), and education (+0.2%). Meanwhile, the index for communication (-0.5%), used cars and trucks (-0.4%), motor vehicle insurance (-0.3%) and personal care (-0.2%) were among the few major indexes that decreased over the month.

The index for shelter, which makes up more than 40% of the “core” CPI, rose by 0.2% in February. The index for owners’ equivalent rent (OER) rose by 0.2% while and the index for rent of primary residence (RPR) increased by 0.1% over the month. NAHB constructs a “real” rent index to indicate whether inflation in rents is faster or slower than core inflation. It provides insight into the supply and demand conditions for rental housing. When inflation in rents is rising faster than core inflation, the real rent index rises and vice versa. The real rent index is calculated by dividing the price index for rent by the core CPI (to exclude the volatile food and energy components). In February, the Real Rent Index fell by 0.1%, the first monthly decline after remaining virtually flat since August 2025, except for data quality issues in October and November.


This article was originally published by a eyeonhousing.org . Read the Original article here. .


Inflation held steady in December, matching November’s reading, according to the Bureau of Labor Statistics (BLS) latest report. This December report was the first report to include a month-to-month figure since the government shutdown. However, the report should be read with caution as data distortions from the shutdown continue to affect key inflation measures, particularly housing.

First looking at annual data, on a non-seasonally adjusted basis, the Consumer Price Index (CPI) rose by 2.7% in December compared to the year prior. Excluding the volatile food and energy components, the “core” CPI increased by 2.6% over the past twelve months. A large portion of the “core” CPI is the housing shelter index, which increased 3.2% over the year. Meanwhile, the component index of food rose by 3.1%, and the energy component index increased by 2.3%.

Before noting monthly changes in the CPI, it is important to mention that the November’s CPI report was artificially depressed due to incomplete data collection and the imputation method used for key components including housing prices. BLS used ‘carry-forward imputation’ to calculate some of November’s data after the shutdown disrupted data collection. This method uses data from a previous month to estimate the missing figure, which potentially underestimates housing inflation.

Housing was one of the most impacted categories. Shelter accounts for 36.7 percent of the CPI and contributed approximately 58 percent of total inflation in 2024, making it the largest single component. Rent changes were unusually low due to BLS carrying forward imputation. This distortion is likely to cause housing inflation to look lower than reality for the next few months, with a catch-up effect expected in April.

On a monthly basis, the CPI rose by 0.3% in December (seasonally adjusted), and the “core” CPI increased by 0.2%.

The price index for a broad set of energy sources rose by 0.3% in December, with declines in fuel oil (-1.5%), gasoline (-0.5%) and electricity (-0.1%) were offset by increases in natural gas (+4.4%). Meanwhile, the food at home index and the food away from home index both increased by 0.7% in December.

The index for shelter was the largest contributor to the overall monthly increase in all items index. Other top contributors that rose in December included indexes for recreation (+1.2%), airline fares (+5.2%), medical care (+0.4%), apparel (+0.6%), personal care (+0.4%) as well as education (+0.2%). Meanwhile, the index for communication (-1.9%), used cars and trucks (-1.1%) and household furnishings and operations (-0.5%) were among the few major indexes that decreased over the month.

The index for shelter, which makes up more than 40% of the “core” CPI, rising rose by 0.4% in December. The index for owners’ equivalent rent (OER) and the index for rent of primary residence (RPR) both increased by 0.3% over the month.

NAHB constructs a “real” rent index to indicate whether inflation in rents is faster or slower than core inflation. It provides insight into the supply and demand conditions for rental housing. When inflation in rents is rising faster than core inflation, the real rent index rises and vice versa. The real rent index is calculated by dividing the price index for rent by the core CPI (to exclude the volatile food and energy components).

In December, the Real Rent Index remained unchanged. Due to the missing October data, the average monthly growth rate for 2025 cannot be directly compared to prior years.


This article was originally published by a eyeonhousing.org . Read the Original article here. .


Challenging affordability conditions, elevated interest rates and economic uncertainty continue to act as headwinds on the housing sector as many potential buyers continue to stay on the sidelines.

Sales of newly built single-family homes edged 0.6% higher in June, rising to a seasonally adjusted annual rate of 627,000, according to newly released data from the U.S. Department of Housing and Urban Development and the U.S. Census Bureau. This marks a 0.6% increase from May’s unrevised figures. However, this is 6.6% below the June 2024 level. June new home sales are down 4.3% on a year-to-date basis. The past two months have been the slowest sales pace since October of last year, as mortgage rates averaged above 6.8% in June.

A new home sale occurs when a sales contract is signed, or a deposit is accepted. The home can be at any stage of construction: not yet started, under construction or completed. In addition to adjusting for seasonal effects, the June reading of 627,000 units is the number of homes that would sell if this pace continued for the next 12 months.

New single-family home inventory continued to rise with 511,000 residences marketed for sale as of June. This is 1.2% higher than the previous month, and 8.5% higher than a year ago. At the current sales pace, the months’ supply for new homes remained elevated at 9.8 compared to 8.4 a year ago. A measure near a six months’ supply is considered balanced.

As expected, the combined new and existing total months’ supply has risen over the last few months to a balanced 5.4 months due to continued buyer hesitation in both new and existing home sales markets. Elevated mortgage rates and sustained price levels continue to limit purchasing power, particularly among first-time and middle-income buyers.

A year ago, there were 94,000 completed, ready-to-occupy homes available for sale (not seasonally adjusted). By the end of June 2025, that number increased 21.3% to 114,000. However, completed, ready-to-occupy inventory remains just 22% of total inventory, while homes under construction account for 54%. The remaining 24% of new homes sold in June were homes that had not started construction when the sales contract was signed.

The median new home sale price edged down 4.9% in June to $401,800. This is down 2.9% compared to a year ago. In terms of affordability, the share of entry-level homes priced below $300,000 has been steadily falling in recent years. Only 14% of the homes were priced in this entry-level affordable range, while 28% of the homes were priced above $500,000. Most of the homes were priced between $300,000-$500,000.

Regionally, on a year-to-date basis, new home sales are down in all four regions, falling 1.6% in the South, 4.0% in the West, 8.5% in the Midwest, and 25.6% in the Northeast.

Discover more from Eye On Housing

Subscribe to get the latest posts sent to your email.


This article was originally published by a eyeonhousing.org . Read the Original article here. .
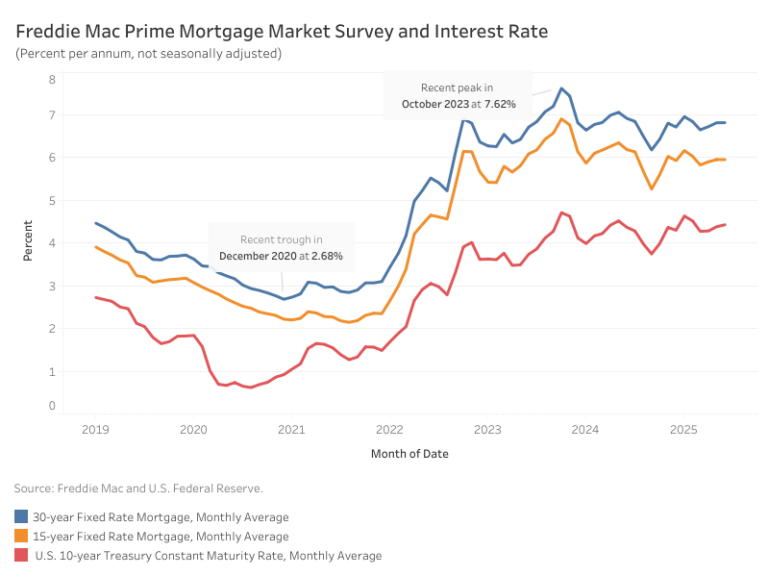

Average mortgage rates were flat in June, according to Freddie Mac. The average 30-year fixed-rate mortgage held at 6.82%, while the 15-year stayed at 5.95%. Compared to a year ago, the 30-year rate is down 10 basis points (bps), and the 15-year rate is 24 bps lower.

The 10-year Treasury yield, a benchmark for long-term borrowing, averaged 4.43% in June – a marginal increase of 5 bps from the previous month. However, the most recent weekly yield saw a small decrease following Federal Reserve Chair Jerome Powell’s congressional testimony, where he noted the possibility of a rate cut being “sooner rather than later” if inflation remains contained. Nonetheless, he reiterated the Fed’s “wait and see” stance, citing ongoing uncertainty around how changes in trade, immigration, fiscal, and regulatory policies will affect the economy.

Last week, the Federal Open Market Committee (FOMC) continued its pause on rate cuts, keeping the federal funds rate unchanged at 4.25% to 4.5%. The updated dot plot continues to signal a cumulative rate cut of 50 bps by the end of 2025. However, the latest Summary of Economic Projections revised the median 2025 GDP forecast down from 1.7% to 1.4%. Forecasts for unemployment (4.4% to 4.5%), PCE inflation (2.7% to 3.0%), and core PCE inflation (2.8% to 3.1%) were all revised upward.

Discover more from Eye On Housing

Subscribe to get the latest posts sent to your email.


This article was originally published by a eyeonhousing.org . Read the Original article here. .
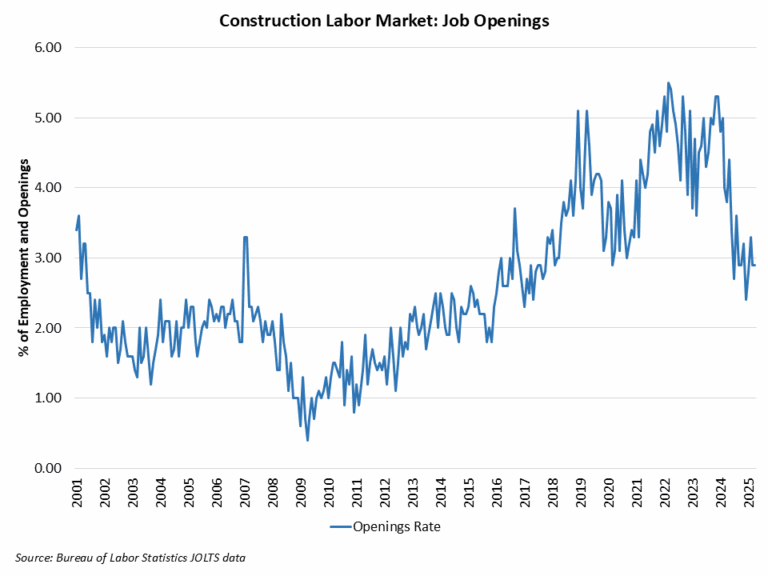

The count of open, unfilled positions in the construction industry held steady amid a slowdown for housing, per the April Bureau of Labor Statistics Job Openings and Labor Turnover Survey (JOLTS).

The number of open jobs for the overall economy increased slightly from 7.20 million in March to 7.39 million in April. This is notably smaller than the 7.62 million estimate reported a year ago and reflects a softened aggregate labor market. Previous NAHB analysis indicated that this number had to fall below 8 million on a sustained basis for the Federal Reserve to move forward on interest rate reductions. With estimates remaining below 8 million for national job openings, the Fed, in theory, should be able to cut further despite a recent pause. However, tariff proposals may keep the Fed on pause in the coming quarters.

The number of open construction sector jobs was effectively unchanged from a revised 251,000 in March to 248,000 in April. This nonetheless marks a significant reduction of open, unfilled construction jobs than that registered a year ago (326,000) due to a slowing of construction activity. The chart below notes the recent decline for the construction job openings rate, which is now back to the lows of 2019.

The construction job openings rate was unchanged at 2.9% in April, although significantly lower year-over-year from 3.8%.

The layoff rate in construction ticked higher to 1.9% in April. The quits rate dipped to 1.8% for the month.

Discover more from Eye On Housing

Subscribe to get the latest posts sent to your email.


This article was originally published by a eyeonhousing.org . Read the Original article here. .
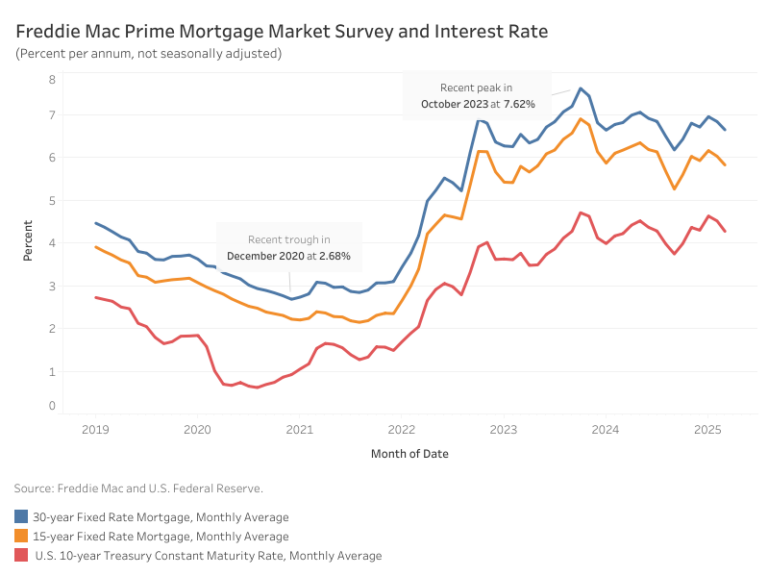

Mortgage rates dropped significantly at the start of March before stabilizing, with the average 30-year fixed-rate mortgage settling at 6.65%, according to Freddie Mac. This marks a 19-basis-point (bps) decline from February. Meanwhile, the 15-year fixed-rate mortgage fell by 20 bps to 5.83%.

The drop in long-term borrowing costs was driven by a 24-bps decline in the 10-year Treasury yield, which averaged 4.28% in March. This decline provided a boost to the housing market—new home sales increased 5.1% year-over-year in February, while the participation of first-time homebuyer of existing homes rose 26% over the same period. However, existing home sales saw a slight dip from last February.

The decrease in Treasury yields reflects growing concerns about an economic slowdown, particularly as shifts in tariff policy weaken consumer confidence. Despite this, the labor market remained resilient in February, posting steady job gains even as the unemployment rate ticked up slightly. The strength of upcoming jobs reports will be critical in assessing whether recession risks are intensifying.

At the latest FOMC meeting, the Federal Reserve held interest rates steady but revised its 2025 economic projections: expected GDP growth was lowered to 1.7% (down from 2.1% in December 2024) and the projected unemployment rate was raised to 4.4%, up 0.1 percentage point from previous estimates.

Discover more from Eye On Housing

Subscribe to get the latest posts sent to your email.


This article was originally published by a eyeonhousing.org . Read the Original article here. .
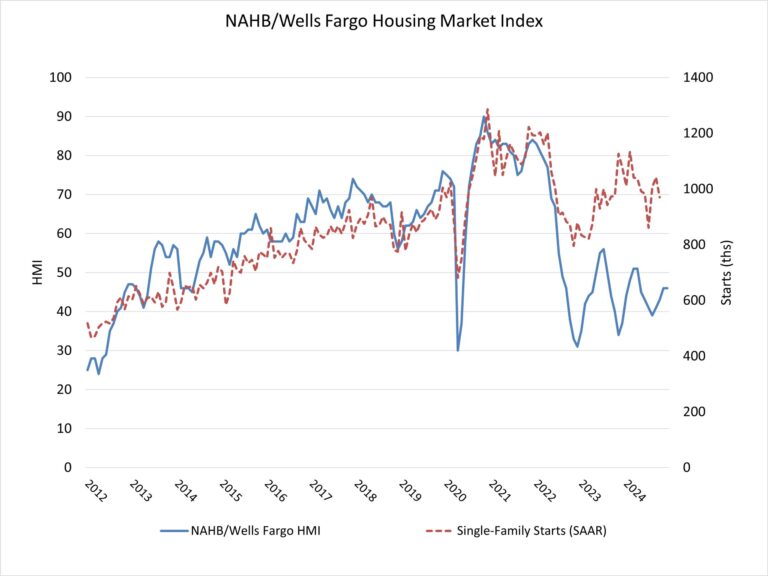

Builder sentiment held steady to end the year as high home prices and mortgage rates offset renewed hope about a better regulatory business climate in 2025. Along those lines, builders expressed increased optimism for higher sales expectations in the next months.

Builder confidence in the market for newly built single-family homes was 46 in December, the same reading as last month, according to the National Association of Home Builders (NAHB)/Wells Fargo Housing Market Index (HMI).

While builders are expressing concerns that high interest rates, elevated construction costs and a lack of buildable lots continue to act as headwinds, they are also anticipating future regulatory relief in the aftermath of the election. This is reflected in the fact that future sales expectations have increased to a nearly three-year high.

NAHB is forecasting additional interest rate cuts from the Federal Reserve in 2025, but with inflation pressures still present, we have reduced that forecast from 100 basis points to 75 basis points for the federal funds rate. Concerns over inflation risks in 2025 will keep long-term interest rates, like mortgage rates, near current levels with mortgage rates remaining above 6%.

The latest HMI survey also revealed that 31% of builders cut home prices in December, unchanged from November. Meanwhile, the average price reduction was 5% in December, the same rate as in November. The use of sales incentives was 60% in December, also unchanged from November.

Derived from a monthly survey that NAHB has been conducting for more than 35 years, the NAHB/Wells Fargo HMI gauges builder perceptions of current single-family home sales and sales expectations for the next six months as “good,” “fair” or “poor.” The survey also asks builders to rate traffic of prospective buyers as “high to very high,” “average” or “low to very low.” Scores for each component are then used to calculate a seasonally adjusted index where any number over 50 indicates that more builders view conditions as good than poor.

The HMI index gauging current sales conditions held steady at 48 while the gauge charting traffic of prospective buyers posted a one-point decline to 31. The component measuring sales expectations in the next six months rose three points to 66, the highest level since April 2022.

Looking at the three-month moving averages for regional HMI scores, the Northeast increased two points to 57, the Midwest moved two points higher to 46, the South posted a two-point gain to 44 and the West fell one point to 40. The HMI tables can be found at nahb.org/hmi.

Discover more from Eye On Housing

Subscribe to get the latest posts sent to your email.


This article was originally published by a eyeonhousing.org . Read the Original article here. .

Pin It