Tag

States

Browsing


The National Association of Home Builders (NAHB) has released its State Projections of Remodeling (SPR) for the first quarter of 2026. As a reminder, the SPR provides on a quarterly basis a state-level estimation of the market share and total dollar value of remodeling spending. The SPR is a statistical model designed to use national quarterly improvement spending data and estimate remodeling market share by state using multiple indicators and NAHB’s annual state remodeling forecast.

Q1 2026 Results

During the first quarter of 2026, remodeling spending at the national level came in at $274.7 billion on a seasonally adjusted annualized rate (SAAR). Even though spending fell for the third consecutive quarter, remodeling spending has been larger than single-family construction spending for seven straight quarters and accounts for 37.7% of total private residential fixed investment.

California had the largest market share of remodeling spending at 8.0%, or $22.2 billion, followed closely by Texas (7.3%, or $20.2 billion). Florida is third at 5.5%, or $15.4 billion, with New York (4.0%, or $11.2 billion) and North Carolina (3.0%, or $8.4 billion) rounding out the top five.

The top three states (California, Texas, and Florida) account for over 20% of total remodeling spending for the quarter, or $57.8 billion. It is not unsurprising to see higher remodeling spending among more populated states since it has a high correlation value (r=0.97) when compared to 2025 estimates from the U.S. Census Bureau. The top ten list by market share demonstrates a fairly even split across Census regions: three each from the Northeast and South and two each from the Midwest and West.

When looking at the top ten states by the change in remodeling spending in Q1 2026 (on a four-quarter moving average basis or 4QMA), Michigan saw its volume increase by $637.6 million, followed by Virginia (up $421.9 million), North Carolina (up $323.6 million), and Alabama (up $311.9 million). Except for the Northeast, all regions were represented within the top ten by change in spending. All ten states experienced a growth rate of at least 2.9% year-over-year with two states being double-digit (Michigan and Mississippi). Nevertheless, there were ten states which experienced negative growth rates in Q1 2026 compared to only five states in the previous quarter. This slowdown is reflected in NAHB’s forecast which showcases flat inflation-adjusted spending for 2026.

To learn more about this resource and its methodology, please visit NAHB’s SPR web page.


This article was originally published by a eyeonhousing.org . Read the Original article here. .
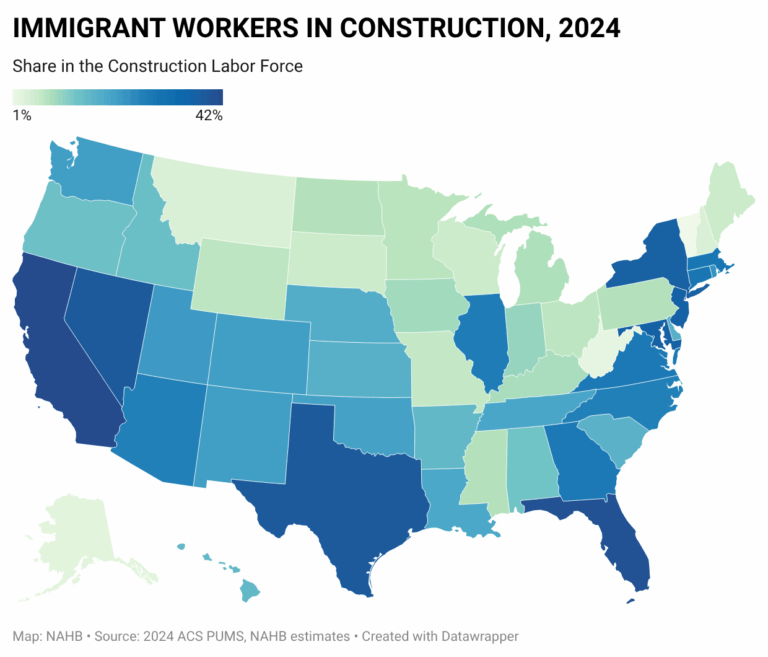

Immigrants’ share of the construction workforce reached a record high in 2024, with foreign-born workers accounting for more than a quarter of the industry’s labor force (26.3%). The share is even higher among construction trades, for which one in three craftsmen is foreign-born. In several states, reliance on foreign-born labor is especially pronounced: immigrants make up more than 40% of the construction workforce in California and Florida, 39% in Texas, and 38% in Nevada.

According to the government’s occupational classification system, the construction industry employs workers across roughly 390 occupations. Of these, only 28 are construction trades, yet these workers account for about 60% of the total construction labor force. The remaining workers are in finance, sales, administration, and other off-site roles.

The concentration of immigrants is particularly high in key construction trades essential to home building, including drywall and ceiling tile installers (57%), plasterers and stucco masons (56%), roofers (53%), painters (53%), and carpet, floor, and tile installers (51%).

The two most prevalent construction occupations, laborers and carpenters, account for more than a quarter of the industry’s labor force. Among them, 35% of carpenters and 43% of construction laborers are foreign-born. These trades typically require less formal education, yet such workers consistently rank among those with the most severe labor shortages, according to the NAHB/Wells Fargo Housing Market Index (HMI) and NAHB Remodeling Market Index (RMI) surveys.

In the April 2025 HMI survey, more than half of builders reported either some or a serious shortage of workers performing finished carpentry. Shortages are similarly widespread for other construction trades directly employed by builders, such as bricklayers and masons, despite the relatively high share of immigrant workers in these occupations.

Labor shortages are also common among more technical trades such as electricians, plumbers, and HVAC technicians. In contrast to labor-intensive trades, these occupations typically require longer formal training, often involve professional licensing, and tend to attract fewer immigrant workers. Over 40% of surveyed builders reported deficits in these skilled trades.

The reported craftsmen shortage is somewhat less acute for trades where the foreign-born presence is more pronounced, such as drywall, ceiling, flooring installers, painters, and roofers – the trades where immigrants make up more than half of the workforce.

More than half (52%) of the nation’s three million immigrant construction workers reside in the four most populous states – California, Texas, Florida, and New York. California and Texas each have over half a million foreign-born construction workers; together, these states account for roughly one-third of all immigrant workers in the industry. Florida and New York contribute an additional 19% combined.

These states are not only the largest by population but also longstanding immigrant gateways, making them particularly reliant on foreign-born construction labor. Immigrants comprise 42% of the construction workforce in California and 41% in Florida, followed by 39% in Texas and 37% in New York.

At the same time, reliance on foreign-born labor is expanding beyond these traditional hubs. Nevada, for example, recorded the fourth-highest share of immigrant construction workers in 2024 (38%), closely trailing Texas. Maryland and New Jersey also reflect this broader trend, with immigrants accounting for 37% of the construction labor force in each state.

In Connecticut, Massachusetts, Georgia, Virginia, Illinois, Arizona, and North Carolina, more than one-quarter of construction workers are foreign-born. At the other end of the spectrum, several states, including New Hampshire, Montana, Alaska, West Virginia, and Vermont, have immigrant shares below 5%.

Because immigrant workers are disproportionately concentrated in construction trades, their presence among craftsmen exceeds their overall share of the industry in every state. In California and Texas, immigrants account for more than half of all construction tradesmen. In Florida, Maryland, and Nevada, the shares are similarly elevated, approaching 50%, while in New Jersey and New York, more than 45% of craftsmen are foreign-born.

While most states draw most of their immigrant foreign-born workers from the Americas, Hawaii relies more heavily on Asian immigrants. European immigrants are a significant source of construction labor in New York, New Jersey, and Illinois.


This article was originally published by a eyeonhousing.org . Read the Original article here. .
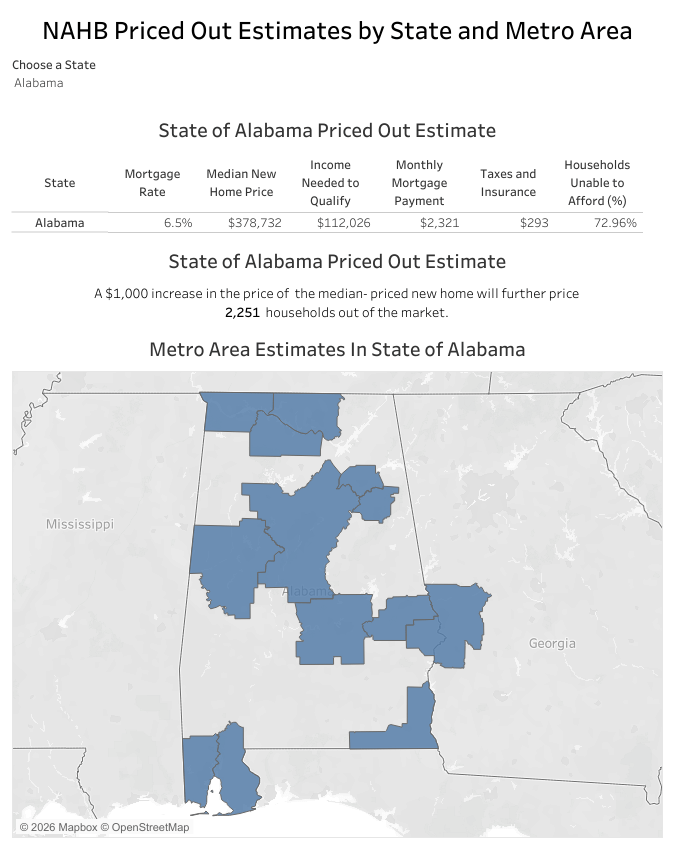

The NAHB 2026 priced-out estimates show that the housing affordability challenge is widespread across the country. In 39 states and the District of Columbia, over 65% of households are priced out of the median-priced new home market. This indicates a significant disconnect between higher new home prices, elevated mortgage rates, and household incomes.

New Hampshire stands out as the state with the highest share of households (83.4%) unable to afford the state’s median new home price of $677,982. High-cost states such as Hawaii and Maine follow closely, with 83% and 82.7% of households, respectively, struggling to afford new homes.

Even in states with relatively lower median new home prices, affordability remains a major concern. For example, in Mississippi, where the median home price is $266,837, 61.1% of households still find these new homes out of reach. Meanwhile, Delaware, the state with better affordability in the analysis, has a median new home price of $373,666, and even there, around 56% of households still struggle to afford a new home. Even modest price increases, such as an additional $1,000, could push thousands more households from affording these median priced new homes. For instance, in Texas, such an increase could price out over 14,365 households.

Affordability patterns also vary significantly across metropolitan areas. In high-cost areas like the San Jose-Sunnyvale-Santa Clara, CA metro area, where new homes largely target high-income Silicon Valley residents, only 14% of all households meet the minimum income threshold of $407,659 required to qualify for a loan on a median-priced new home. In contrast, in more affordable metro areas like Rome, GA, where the median new home price is $107,567, more than three-quarters of households can afford a median-priced new home. While higher home prices generally result in higher monthly mortgage payments and higher income thresholds, the relationship between home prices and affordability is not always linear. Factors like property taxes and insurance payments can also significantly impact monthly housing costs, adding complexity to affordability calculations.

The affordability of new homes, together with the population size of a metro area, significantly influences the priced-out impact of a $1,000 increase in new home prices. In metro areas where new homes are already unaffordable to most households, the effect of such an increase tends to be small. For instance, in the San Jose-Sunnyvale-Santa Clara, CA metro area, an additional $1,000 increase to the home price affects only 273 households, as only 14% of all households could afford such expensive new homes in the first place. Here, the additional price increase only affects a narrow share of high-income households at the upper end of the income distribution, where affordability is already stretched.

In contrast, metro areas, where new homes are more broadly affordable, experience a larger priced-out effect. A $1,000 increase in the median new home price affects a larger share of households in the “thicker part” of the income distribution. For example, in the New York-Newark-Jersey City, NY-NJ Metro Area metro area, a $1,000 increase in new home price would disqualify 4,028 households from affording a median-priced new home. This is the largest priced-out effect among all metro areas, driven by a substantial population base.

Detailed priced-out estimates for every state and more than 300 metro areas are available in the interactive dashboard below.


This article was originally published by a eyeonhousing.org . Read the Original article here. .
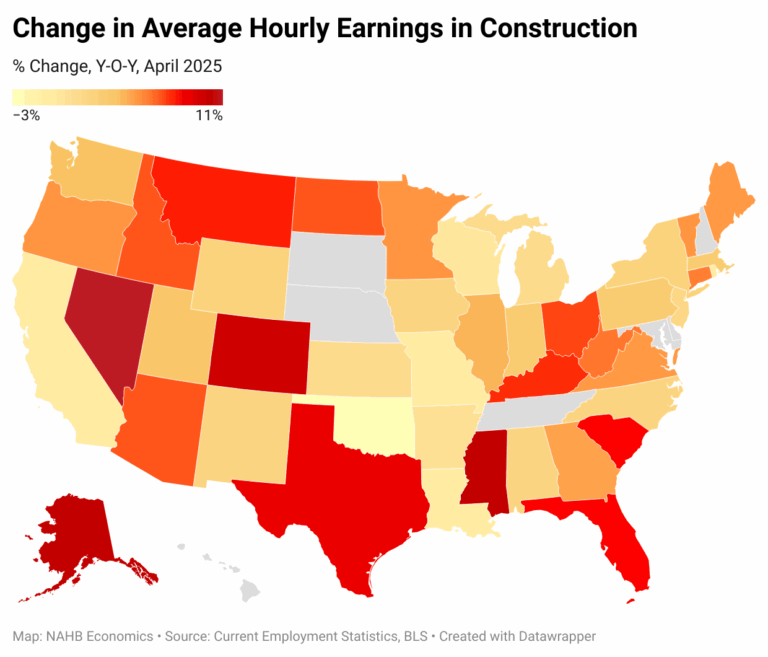

Wage growth in construction continued to decelerate in April on a national basis, but the differences across regional markets remain stark. Nationally, average hourly earnings (AHE) in construction increased 3.6% year-over-year and crossed the $39.3 mark when averaged across all payroll employees (non-seasonally adjusted, NSA). Meanwhile, average earnings in construction in Alaska and Massachusetts exceeded $50 per hour (NSA). Across states, the annual growth rate in AHE ranged from 10.6% in Nevada to a decline of 3% in Oklahoma. This is according to the latest Current Employment Statistics (CES) report from the Bureau of Labor Statistics (BLS).   

Average hourly earnings (AHE) in construction vary greatly across 43 states that report these data. Alaska, states along the Pacific coast, Illinois, Minnesota, and the majority of states in Northeast record the highest AHE. As of April 2025, fourteen states report average earnings (NSA) exceeding $40 per hour.

At the other end of the spectrum, nine states report NSA average hourly earnings in construction under $34. The states with the lowest AHE are mostly in the South, with Arkansas reporting the lowest rate of $29.3 per hour.

While differences in regional hourly rates reflect variation in the cost of living across states among other things, the faster growing wages are more likely to indicate specific labor markets that are particularly tight. Year-over-year, Nevada, Mississippi, Alaska, Colorado, Texas, Florida, South Carolina, and Montana reported fastest growing hourly wages in construction, more than doubling the national average growth of 3.6%. Nevada reported the largest annual increase of 10.6%, while the growth rate in Mississippi and Alaska was just under 10%.

In sharp contrast, Oklahoma registered a decline in hourly wages of 3%. Five other states reported modestly declining hourly rates in construction, compared to a year ago – Louisiana, Missouri, Rhode Island, California, and Wisconsin.


This article was originally published by a eyeonhousing.org . Read the Original article here. .
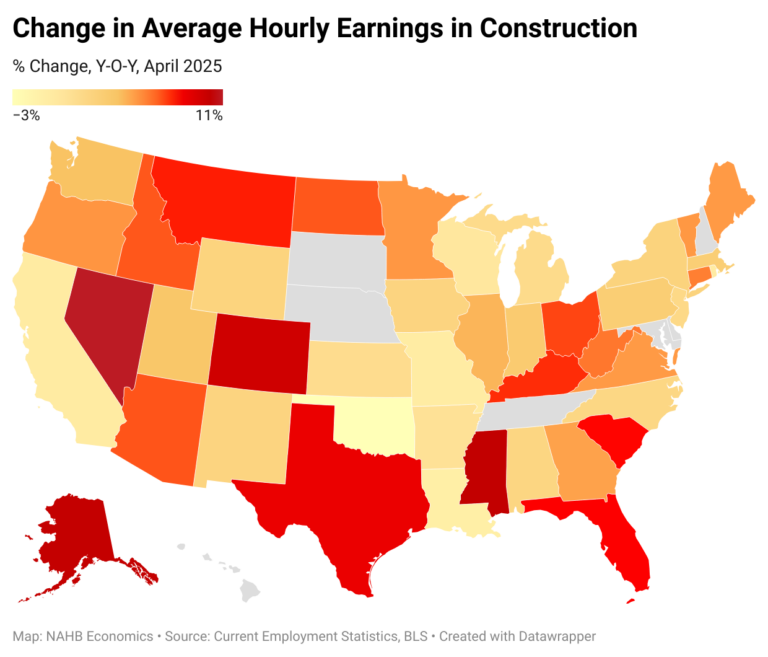

Wage growth in construction continued to decelerate in April on a national basis, but the differences across regional markets remain stark. Nationally, average hourly earnings (AHE) in construction increased 3.6% year-over-year and crossed the $39.3 mark when averaged across all payroll employees (non-seasonally adjusted, NSA). Meanwhile, average earnings in construction in Alaska and Massachusetts exceeded $50 per hour (NSA). Across states, the annual growth rate in AHE ranged from 10.6% in Nevada to a decline of 3% in Oklahoma. This is according to the latest Current Employment Statistics (CES) report from the Bureau of Labor Statistics (BLS).   

Average hourly earnings (AHE) in construction vary greatly across 43 states that report these data. Alaska, states along the Pacific coast, Illinois, Minnesota, and the majority of states in Northeast record the highest AHE. As of April 2025, fourteen states report average earnings (NSA) exceeding $40 per hour.

At the other end of the spectrum, nine states report NSA average hourly earnings in construction under $34. The states with the lowest AHE are mostly in the South, with Arkansas reporting the lowest rate of $29.3 per hour.

While differences in regional hourly rates reflect variation in the cost of living across states among other things, the faster growing wages are more likely to indicate specific labor markets that are particularly tight. Year-over-year, Nevada, Mississippi, Alaska, Colorado, Texas, Florida, South Carolina, and Montana reported fastest growing hourly wages in construction, more than doubling the national average growth of 3.6%. Nevada reported the largest annual increase of 10.6%, while the growth rate in Mississippi and Alaska was just under 10%.

In sharp contrast, Oklahoma registered a decline in hourly wages of 3%. Five other states reported modestly declining hourly rates in construction, compared to a year ago – Louisiana, Missouri, Rhode Island, California, and Wisconsin.

Discover more from Eye On Housing

Subscribe to get the latest posts sent to your email.


This article was originally published by a eyeonhousing.org . Read the Original article here. .
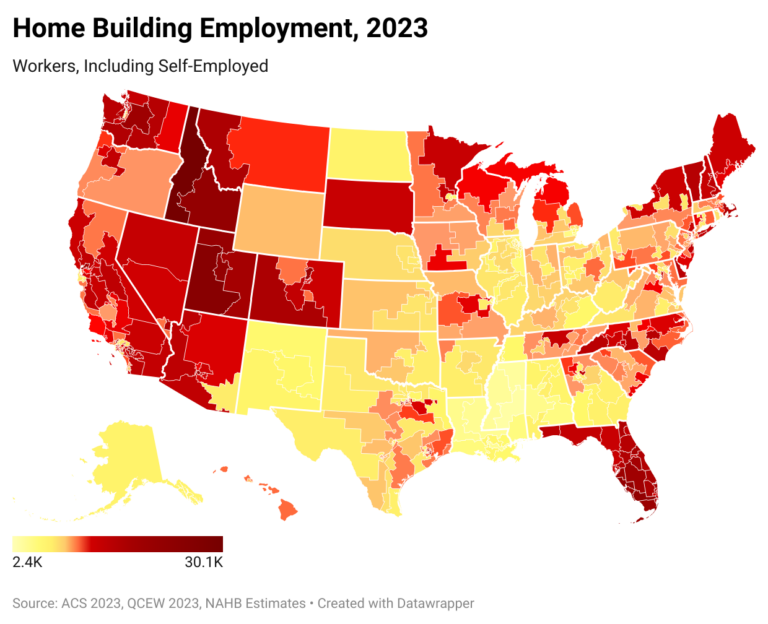

As the number of housing units under construction peaked in 2023, the industry set another record employing close to 11.4 million people, including self-employed workers. NAHB estimates that out of this total, 4.7 million people worked in residential construction, accounting for 2.9% of the U.S. employed civilian labor force. Home building in the Mountain Division, as well as in Vermont and Florida, stand out as generating a significantly higher share of local jobs, with residential construction generating more than 5% of all jobs in Idaho and Montana. NAHB’s analysis also identifies congressional districts where home building accounts for particularly high employment levels and share of local jobs.

Not surprisingly, the most populous state—California—also has the most residential construction workers. Over 640,000 California residents worked in home building in 2023, accounting for 3.4% of the state employed labor force.

Fast-growing Florida comes in second with 468,000 residential construction workers. The state stands out for registering one of the fastest growing populations since the start of the pandemic, which undoubtedly boosted housing and construction workforce demand. Florida’s large stock of vacation and seasonal housing further boosts demand for residential construction workers. As a result, in Florida, residential construction workers account for a relatively high 4.4% of the employed labor. Even though this share is well above the national average (2.9%), it is significantly lower than in 2006, when Florida registered the highest share among all 50 states and the District of Columbia, at 6.5%.

Similar to Florida, fast-growing states with a high prevalence of seasonal, vacation homes top the list of states with the highest share of residential construction workers in 2023. Three states in the Mountain Division – Idaho, Montana, and Utah – take the top spots on the list with 5.5%, 5.1% and 4.9% of the employed labor force working in home building. Vermont is next on the list with a share of 4.6%.  

As of 2023, the average congressional district has about 10,800 residents working in residential construction, but that number is often significantly higher. In Idaho’s 1st Congressional District, over 30,000 residents are in home building and Utah’s 2nd Congressional District has over 25,000 residents working in home building. 

Eight other congressional districts have over 20,000 residents working in residential construction – Florida’s 26th, Utah’s 4th, Idaho’s 2nd, Florida’s 17th, Arizona’s 3rd, Utah’s 1st, Florida’s 28th, and California’s 29th. 

By design, Congressional districts are drawn to represent roughly the same number of people. So generally, large numbers of residential construction (RC) workers translate into high shares of RC workers in their district employed labor forces.  Idaho’s 1st tops this list as well, registering the highest share of residential construction workers in the employed labor force, 6.4%. Florida’s 17th is a close second with 6.3% of the district labor force employed in home building. Next on the list are two Mountain division districts – Montana’s 1st and Utah’s 2nd – with shares of 5.8%, followed by two Florida’s districts – 19th (5.7%) and 26th (5.6%). California’s 29th (5.4%) and 39th (5.3%) also register shares far exceeding the national average of 2.9%.   

At the other end of the spectrum there are several districts that contain parts of large urban areas: the District of Columbia, the 12th of New York, located in New York City, Pennsylvania’s 3rd that includes areas of the city of Philadelphia, Georgia’s 5th that includes most of Atlanta, and among others, Illinois’s 7th and 9th, covering parts of Chicago. Most residents in these urban districts tend to work in professional, scientific, and technical services. The District of Columbia stands out for having the lowest number of RC workers, with just 1,400 residing in the district. At the same time, it has a disproportionally large share of public administration workers. The 12th District of New York and the 7th District of Illinois are home to a very large group of finance and insurance workers. Meanwhile, in Pennsylvania’s 2nd, more than a third of residents work in health care and educational services. 

The NAHB residential construction employment estimates include self-employed workers. Counting self-employed is particularly important in the home building industry since they traditionally make up a larger share of the labor force than in the U.S. total workforce.  

The new NAHB home building employment estimates only include workers directly employed by the industry and do not count jobs created in related industries– such as design and architecture, furniture making, building materials, landscaping, etc.  As a result, the estimates underestimate the overall impact of home building on local employment. 

Discover more from Eye On Housing

Subscribe to get the latest posts sent to your email.


This article was originally published by a eyeonhousing.org . Read the Original article here. .
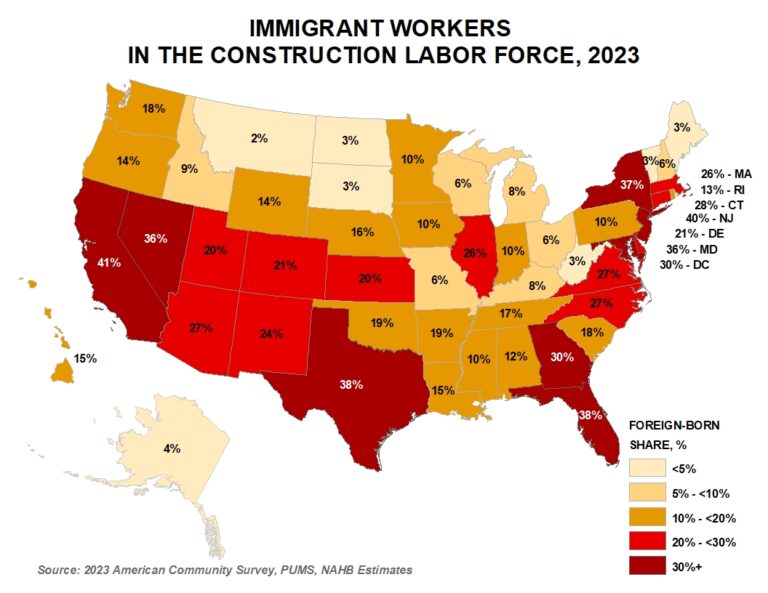

As reported in a previous post, immigrants make up one in four workers in the construction industry. The share of immigrants is significantly higher (32.5%) among construction tradesmen. In some states, reliance on foreign-born labor is particularly evident, with immigrants comprising over 40% of the construction workforce in California and New Jersey, and 38% – in Texas and Florida.

According to the government’s system for classifying occupations, the construction industry employs workers in about 390 occupations. Out of these, only 28 are construction trades, yet they account for almost two thirds of the construction labor force. The other one-third of workers are in finance, sales, administration and other off-site activities.

The concentration of immigrants is particularly high in construction trades essential for home building, such as plasterers and stucco masons, drywall/ceiling tile installers (61%), roofers (52%), painters (51%), carpet/floor/tile installers (45%).

The two most prevalent construction occupations, laborers and carpenters, account for over a quarter of the construction labor force. A third of all carpenters and 42% of construction laborers are of foreign-born origin. These trades require less formal education but consistently register some of the highest labor shortages in the NAHB/Wells Fargo Housing Market Index (HMI) and NAHB Remodeling Market Index (RMI) surveys.

In the latest February 2024 HMI Survey, 65% of builders reported some or serious shortage of workers performing finished carpentry. Looking at other tradesmen directly employed by builders, the shortages of bricklayers and masons are similarly acute, despite a high presence of immigrant workers in these trades.

Labor shortages are also high among electricians, plumbers and HVAC technicians, with over half of surveyed builders reporting shortages of these craftsmen. In contrast, these trades demand longer formal training, often require professional licenses and attract fewer immigrants.

More than half (53%) of the three million immigrant construction workers reside in the four most populous states in the U.S. – California, Texas, Florida, and New York.  California and Texas have over half a million foreign-born construction workers each. Combined, these two states account for over a third (35%) of all immigrant construction workers. Florida and New York combined account for an additional 18%.

These are not only the most populous states in the U.S., but as traditional gateway states, they are also particularly reliant on foreign-born construction labor. Immigrants comprise 41% of the construction workforce in California. In Florida and Texas, 38% of the construction labor force is foreign-born. In New York, 37% of construction industry workers come from abroad. 

The reliance on foreign-born labor continues to spread outside of these traditional immigrant magnets. This is evident in states like New Jersey, that registered the second highest share of immigrant workers, 40%, in 2023, closely following California. Nevada and Maryland, where immigrants (as of 2023) account for over a third of the construction labor force (36%) also illustrate spreading reliance on immigrant labor.

In Georgia, Connecticut, North Carolina, Virginia, Arizona, Massachusetts, and Illinois, more than a quarter of construction workers are foreign-born. At the other end of the spectrum, seven states – Montana, North and South Dakota, Vermont, Maine, West Virginia, and Alaska – have share of immigrant workers of less than 5%.

Because immigrant workers are disproportionately concentrated within the construction trades, immigrant presence among craftsmen is higher than their overall representation in the industry across all states. In California and DC, immigrant workers account for more than half of all tradesmen in construction. In New Jersey and Texas, these shares are similarly high at 49%. In Maryland, Nevada, Florida, New York and Georgia, between 40% and 47% of craftsmen are foreign-born. 

While most states draw the majority of immigrant foreign-born workers from the Americas, Hawaii relies more heavily on Asian immigrants. European immigrants are a significant source of construction labor in New York, New Jersey and Illinois.

Discover more from Eye On Housing

Subscribe to get the latest posts sent to your email.


This article was originally published by a eyeonhousing.org . Read the Original article here. .

Pin It