Tag

Starts

Browsing


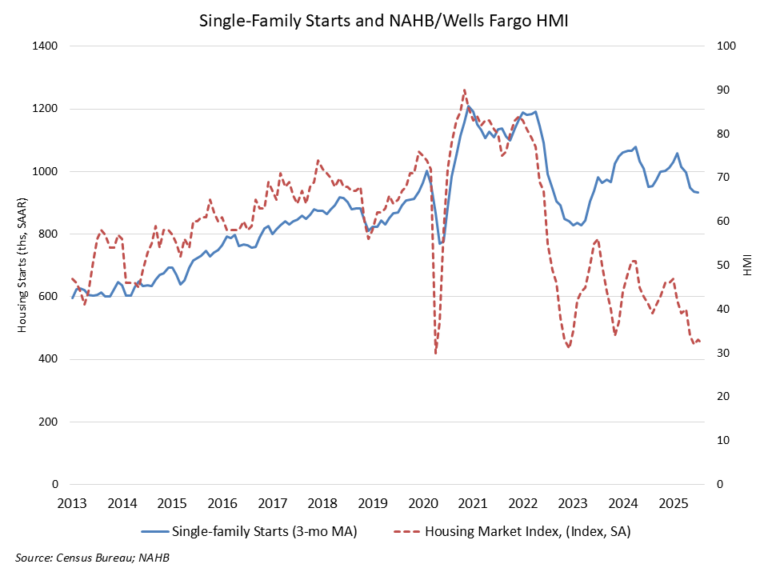
Single-family housing starts declined in June to the lowest rate since July 2024 as elevated interest rates, rising inventories and ongoing supply-side issues continue to act as headwinds for the housing sector.

Due to a solid increase in multifamily production, overall housing starts increased 4.6% in June to a seasonally adjusted annual rate of 1.32 million units, according to a report from the U.S. Department of Housing and Urban Development and the U.S. Census Bureau.

The June reading of 1.32 million starts is the number of housing units builders would begin if development kept this pace for the next 12 months. Within this overall number, single-family starts decreased 4.6% to an 883,000 seasonally adjusted annual rate and are down 10% compared to June 2024. The multifamily sector, which includes apartment buildings and condos, increased 30% to an annualized 438,000 pace.

Single-family building conditions continued to weaken in June as housing affordability challenges caused builder traffic to move lower as buyers moved to the sidelines. Rising levels of resale inventory are also a headwind for the industry.

Single-family home building in the South is down 12.4% on a year-to-date basis, far outpacing declines in the Northeast and the West. However, single-family home building is up 10% on a year-to-date basis in the Midwest, where housing affordability conditions are generally better than much of the nation.

On a regional and year-to-date basis, combined single-family and multifamily starts were 28.8% higher in the Northeast, 13.1% higher in the Midwest, 8.1% lower in the South and 0.6% lower in the West.

Overall permits increased 0.2% to a 1.40-million-unit annualized rate in June. Single-family permits decreased 3.7% to an 866,000-unit rate and are down 8.4% compared to June 2024. Multifamily permits increased 7.3% to a 531,000 pace.

Looking at regional permit data on a year-to-date basis, permits were 16.9% lower in the Northeast, 8.2% higher in the Midwest, 3.3% lower in the South and 3.7% lower in the West.

The declines for single-family home building have caused the number of single-family homes under construction to level off. There are currently 622,000 single-family homes under construction, which is 6% lower than a year ago. The number of apartments under construction in June, 739,000, is 18.8% lower than a year ago.

Discover more from Eye On Housing

Subscribe to get the latest posts sent to your email.


This article was originally published by a eyeonhousing.org . Read the Original article here. .

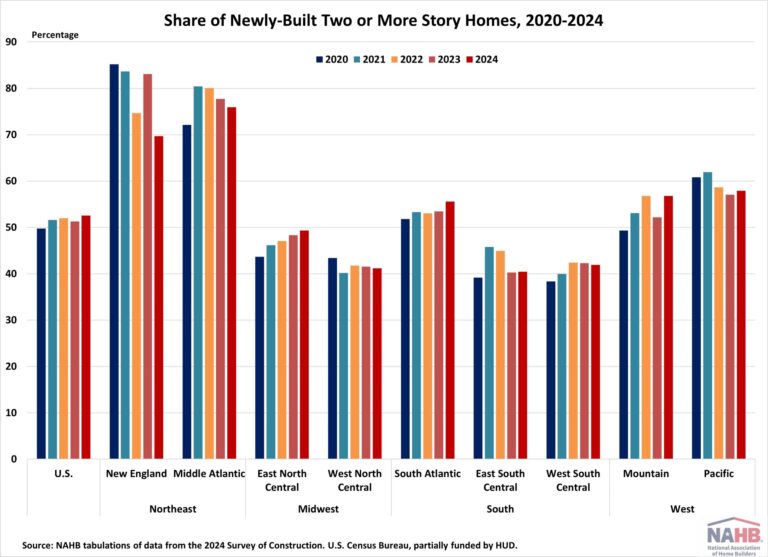
Over half of new single-family homes built in 2024 were two or more stories, according the recent release of the Census Bureau’s Survey of Construction (SOC). After declining in 2023, the share of homes started with two or more stories increased again in 2024, continuing the upward trend in place since 2020.

Nationwide, the share of new homes with two or more stories rose from 51.3% in 2023 to 52.5% in 2024, while the share of new homes with one story fell from 48.7% to 47.5%. Nationally, there were more multi-story homes built in 2024, however, this share varied significantly across the nation.

New homes started in the Midwest and South generally showed a stronger preference for single-story homes. In the Midwest (West North Central and East North Central), 58.8% and 50.7% of new homes started were one story, while in the South (East South Central and West South Central), the shares were 59.5% and 58.1%. However, the South Atlantic division was an exception, with one story homes falling to 44.4%, the lowest since 2019.

Although single story homes are more common in the Midwest and South, their shares declined in 2024 across the East North Central (Midwest), South Atlantic (South) and East South Central (South). This suggests a slow upward trend in two or more story homes across the South after COVID.

Following the national trend, five of the nine divisions saw a greater share of newly-built two or more story homes. The highest two or more story shares of new homes were concentrated in the Northeast and West, with Middle Atlantic and New England at 75.9% and 69.7%, while the Pacific and Mountain reached 57.9% and 56.8%, respectively. However, both Northeast divisions declined from 2023 levels, with New England dropping to its lowest two or more story share since NAHB started tracking in 2017. Meanwhile, new homes started with two or more stories in the Mountain and Pacific divisions both experienced increases in their two or more stories shares.

Discover more from Eye On Housing

Subscribe to get the latest posts sent to your email.


This article was originally published by a eyeonhousing.org . Read the Original article here. .


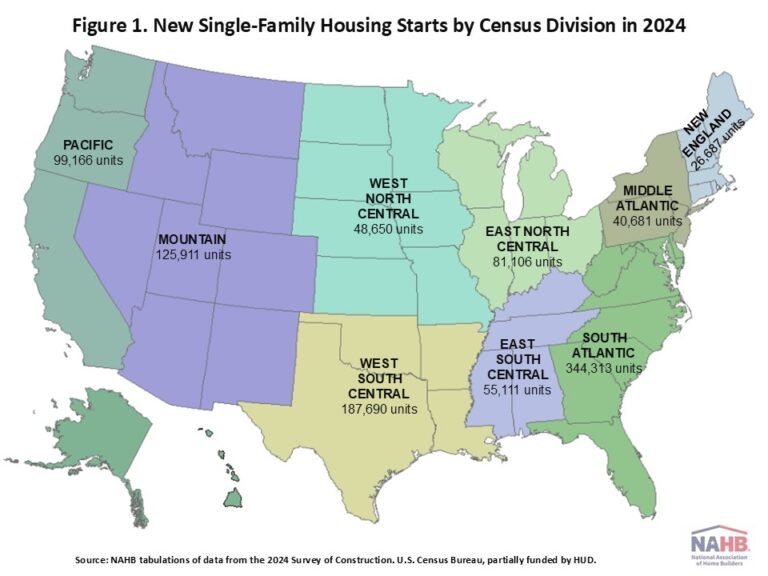
Despite persistently high mortgage rates, elevated financing costs for builders, and a shortage of buildable lots, single-family starts rebounded in 2024, following two straight years of declines. According to the National Association of Home Builders’ analysis of the 2024 Survey of Construction (SOC), a total of 1,009,315 new single-family units started construction nationwide. This is a 7% increase compared to 2023.

Among the nine Census divisions, the South Atlantic division led the nation with 344,313 starts in 2024, representing a 34% share. The second highest was the West South Central division at 187,690 starts, followed by the Mountain division with 125,911 starts. Collectively, these three divisions, covering 20 states and Washington, D.C., and representing approximately 41% of the United States, accounted for nearly two-thirds of the total new single-family housing starts in 2024.

Meanwhile, there were 99,166 new single-family units started in the Pacific division (10% of total starts) and 81,106 in the East North Central division (8%) in 2024. The other four divisions, including East South Central, West North Central, Middle Atlantic, and New England, accounted for the remaining 17% of the total new single-family housing starts.

In 2024, seven out of nine divisions experienced year-over-year growth in single-family starts. The Middle Atlantic division had the strongest performance among all regions, posting a 22% annual increase. In addition, five out of nine divisions surpassed the U.S. growth rate of 7%. Conversely, both the East South Central and West South Central divisions recorded declines in single-family housing starts.

Compared to the previous year, the New England and West South Central divisions experienced a deceleration in growth, while the East South Central division marked its second consecutive year of decreases. In contrast, the remaining six divisions reported an acceleration in growth. Despite regional disparities, the overall national trend in 2024 reflected a resilient housing market, even in the face of ongoing economic and supply-side challenges.

Discover more from Eye On Housing

Subscribe to get the latest posts sent to your email.


This article was originally published by a eyeonhousing.org . Read the Original article here. .

A sharp decline in multifamily production pushed overall housing starts down in May, while single-family output was essentially flat due to economic and tariff uncertainty along with elevated interest rates.

Overall housing starts decreased 9.8% in May to a seasonally adjusted annual rate of 1.26 million units, according to a report from the U.S. Department of Housing and Urban Development and the U.S. Census Bureau.

The May reading of 1.26 million starts is the number of housing units builders would begin if development kept this pace for the next 12 months. Within this overall number, single-family starts increased 0.4% to a 924,000 seasonally adjusted annual rate and are down 7.3% compared to May 2024. The volatile multifamily sector, which includes apartment buildings and condos, decreased 29.7% in May to an annualized 332,000 pace.

On a year-to-date basis, single-family starts are down 7.1%. In contrast, multifamily 5-plus unit starts are up 14.5% as more prospective home buyers remain on the sidelines helping rental demand.

Single-family permits and construction starts are down on a year-to-date basis for 2025 for what has been a disappointing spring housing market, given ongoing elevated mortgage interest rates, challenging housing affordability conditions led by higher construction costs, and macroeconomic uncertainty. NAHB is forecasting that 2025 will end with a decline for single-family housing starts.

The number of single-family homes currently under construction totaled 623,000 homes as of May. This is 1.3% lower than April, 7.6% lower than a year ago and 25% lower than the post-Great Recession peak level in June 2022. There were 752,000 apartments under construction in June, 4.6% lower than May and 18.2% lower than a year ago.

On a regional and year-to-date basis, combined single-family and multifamily starts were 21.1% higher in the Northeast, 10.8% higher in the Midwest, 6.8% lower in the South and 1.6% lower in the West.

Overall permits decreased 2% to a 1.39-million-unit annualized rate in May. Single-family permits decreased 2.7% to an 898,000-unit rate and are down 6.4% compared to May 2024. Multifamily permits decreased 0.8% to a 495,000 pace.

Looking at regional permit data on a year-to-date basis, permits were 17.2% lower in the Northeast, 6% higher in the Midwest, 5.4% lower in the South and 3.7% lower in the West.

Discover more from Eye On Housing

Subscribe to get the latest posts sent to your email.


This article was originally published by a eyeonhousing.org . Read the Original article here. .

Economic uncertainty stemming from tariff issues, elevated mortgage rates and rising building material costs pushed single-family housing starts lower in April.

Overall housing starts increased 1.6% in April to a seasonally adjusted annual rate of 1.36 million units, according to a report from the U.S. Department of Housing and Urban Development and the U.S. Census Bureau.

The April reading of 1.36 million starts is the number of housing units builders would begin if development kept this pace for the next 12 months. Within this overall number, single-family starts decreased 2.1% to a 927,000 seasonally adjusted annual rate and are down 12.0% compared to April 2024. On a year-to-date basis, single-family starts are down 7.1%. The three-month moving average (a useful gauge given recent volatility) is down to 991,000 units, as charted below.

The multifamily sector, which includes apartment buildings and condos, increased 10.7% to an annualized 434,000 pace. The three-month moving average for multifamily construction has trended upward to a 406,000-unit annual rate. On a year-over-year basis, multifamily construction is up 30.7%.

On a regional and year-to-date basis, combined single-family and multifamily starts were 19.8% higher in the Northeast, 4.4% higher in the Midwest, 3.4% higher in the West , and 7.4% lower in the South.

The total number of single-family homes and apartments under construction was 1.4 million units in April. This is the lowest total since June 2021. Total housing units now under construction are 14.3% lower than a year ago. Single-family units under construction fell to a count of 630,000—down 7.1% compared to a year ago. The number of multifamily units under construction has fallen to 788,000 units. This is down 15.6% compared to a year ago.

On a 3-month moving average basis, there are currently 1.3 apartments completing construction for every one that is beginning construction. While apartment construction starts are down, the number of completed units entering the market is rising due to prior elevated construction levels. Year-to-date, the pace of completions for apartments in buildings with five or more units is down 3.4% in 2025 compared to 2024. An elevated pace of completions in 2025 for multifamily construction will place some downward pressure on rent growth.

Overall permits decreased 4.7% to a 1.41-million-unit annualized rate in April. Single-family permits decreased 5.1% to a 922,000-unit rate and are down 6.2% compared to April 2024. Multifamily permits decreased 3.7% to a 490,000 pace but are up 2.9% compared to April 2024.

Looking at regional permit data on a year-to-date basis, permits were 5.1% higher in the Midwest, 3.5% lower in the West, 3.8% lower in the South, and 20.3% lower in the Northeast.

Discover more from Eye On Housing

Subscribe to get the latest posts sent to your email.


This article was originally published by a eyeonhousing.org . Read the Original article here. .

Constrained housing affordability conditions due to elevated interest rates, rising construction costs and labor shortages led to a reduction in housing production in March.

Overall housing starts decreased 11.4% in March to a seasonally adjusted annual rate of 1.32 million units, according to a report from the U.S. Department of Housing and Urban Development and the U.S. Census Bureau.

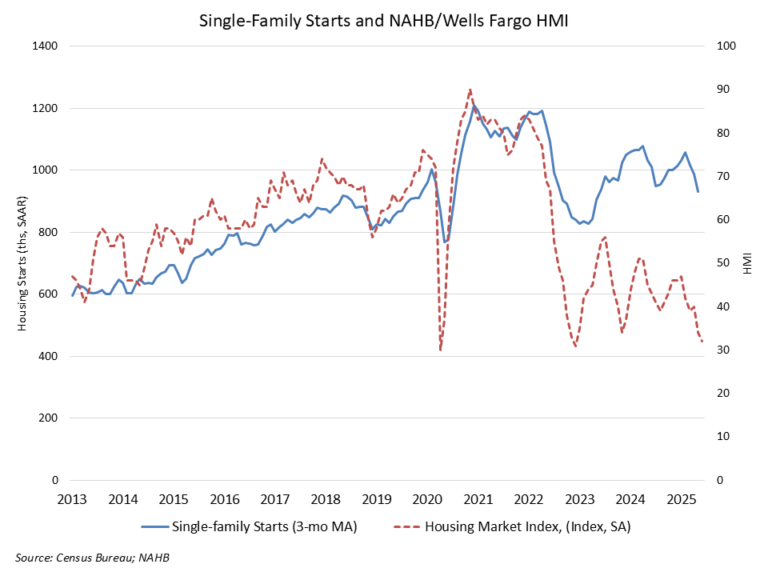
The March reading of 1.32 million starts is the number of housing units builders would begin if development kept this pace for the next 12 months. Within this overall number, single-family starts decreased 14.2% to a 940,000 seasonally adjusted annual rate over the month and are down 9.7% compared to March 2024. On a year-to-date basis, single-family starts are down 5.6%. The three-month moving average (a useful gauge given recent volatility) is down to 1.01 million units, as charted below.

The multifamily sector, which includes apartment buildings and condos, decreased 3.5% to an annualized 384,000 pace. The three-month moving average for multifamily construction has trended upward to a 381,000-unit annual rate. On a year-over-year basis, multifamily construction is up 48.8%.

On a regional and year-to-date basis, combined single-family and multifamily starts were 10.6% higher in the West, 8.6% higher in the Northeast, 3.3% higher in the Midwest, and 8.5% lower in the South.

The total number of single-family homes and apartments under construction was 1.4 million in March. This is the lowest total since July 2021. Total housing units now under construction are 15.2% lower than a year ago. Single-family units under construction fell to a count of 632,000—down 8.7% compared to a year ago. The number of multifamily units under construction has fallen to 759,000 units. This is down 20.0% compared to a year ago.

On a 3-month moving average basis, there are currently 1.5 apartments completing construction for every one that is beginning construction. While apartment construction starts are down, the number of completed units entering the market is rising due to prior elevated construction levels. Year-to-date, the pace of completions for apartments in buildings with five or more units is down 3.5% in 2025 compared to 2024. An elevated pace of completions in 2025 for multifamily construction will place some downward pressure on rent growth.

Overall permits increased 1.6% to a 1.48-million-unit annualized rate in March. Single-family permits decreased 2.0% to a 978,000-unit rate. Multifamily permits increased 9.3% to a 504,000 pace.

Looking at regional permit data on a year-to-date basis, permits were 4.7% higher in the Midwest, 0.4% higher in the South, 8.8% lower in the West and 24.7% lower in the Northeast.

Discover more from Eye On Housing

Subscribe to get the latest posts sent to your email.


This article was originally published by a eyeonhousing.org . Read the Original article here. .


Limited existing inventory helped single-family starts to post a solid gain in February, but builders are still grappling with elevated construction costs stemming from tariff issues and persistent shortages related to buildable lots and labor.

Overall housing starts increased 11.2% in February to a seasonally adjusted annual rate of 1.50 million units, according to a report from the U.S. Department of Housing and Urban Development and the U.S. Census Bureau. The February reading of 1.50 million starts is the number of housing units builders would begin if development kept this pace for the next 12 months.

Within this overall number, single-family starts increased 11.4% to a 1.11 million seasonally adjusted annual rate, the highest pace since February 2024. The multifamily sector, which includes apartment buildings and condos, increased 10.7% to an annualized 393,000 pace.

While solid demand and a lack of existing inventory provided a boost to single-family production in February, our latest builder survey shows that builders remain concerned about challenging housing affordability conditions, most notably elevated financing and construction costs as well as tariffs on key building materials.

On a regional and year-to-date basis, combined single-family and multifamily starts were 4.7% lower in the Northeast, 21.5% lower in the Midwest, 8.3% lower in the South and 20.2% higher in the West.

Overall permits decreased 1.2% to a 1.46-million-unit annualized rate in February and were down 6.8% compared to February 2024. Single-family permits decreased 0.2% to a 992,000-unit rate and were down 3.4% compared to the previous year. Multifamily permits decreased 3.1% to a 464,000 pace.

Looking at regional permit data on a year-to-date basis, permits were 30.1% lower in the Northeast, 2.3% higher in the Midwest, 2.1% lower in the South and 12.5% lower in the West.

The number of single-family homes under construction in February was down 6.7% from a year ago, at 640,000 homes. In February, the count of apartments under construction increased 0.3% to an annualized 772,000 pace. It marks the first gain after 18 months of consecutive declines but was still down 20% from a year ago.

There were 526,000 multifamily completions in February, down 15% from the previous year. For each apartment starting construction, there are 1.5 apartments completing the construction process.

Discover more from Eye On Housing

Subscribe to get the latest posts sent to your email.


This article was originally published by a eyeonhousing.org . Read the Original article here. .
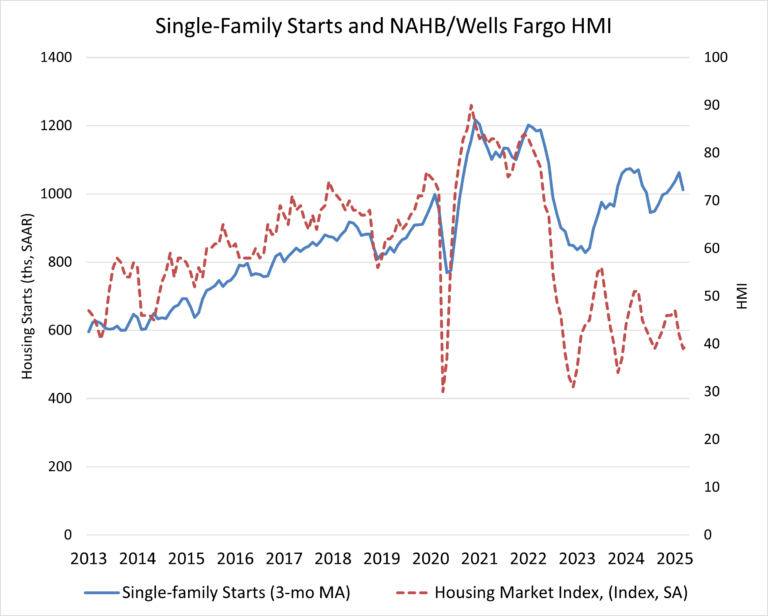

Constrained housing affordability conditions due to ongoing, elevated interest rates led to a reduction in single-family production to start the new year.

Overall housing starts decreased 9.8% in January to a seasonally adjusted annual rate of 1.37 million units, according to a report from the U.S. Department of Housing and Urban Development and the U.S. Census Bureau. The January reading of 1.37 million starts is the number of housing units builders would begin if development kept this pace for the next 12 months.

Within this overall number, single-family starts decreased 8.4% to a 993,000 seasonally adjusted annual rate; the January pace was 1.8% lower than a year ago. The multifamily sector, which includes apartment buildings and condos, decreased 13.5% to an annualized 373,000 pace.

As mirrored in the NAHB/Wells Fargo HMI, high construction costs, elevated mortgage rates and challenging housing affordability conditions are causing builders to approach the market with caution. There are competing upside and downside risks, including discussed tariffs and regulatory reform. Given persistent affordability concerns, reducing inefficient regulatory costs would offer the best policy path to improve attainable housing supply and bring down shelter inflation.

On a regional basis compared to the previous month, combined single-family and multifamily starts are 27.6% lower in the Northeast, 10.4% lower in the Midwest, 23.3% lower in the South and 42.3% higher in the West.

Overall permits increased 0.1% to a 1.48 million unit annualized rate in January. Single-family permits were at a 996,000 annual unit rate, remaining unchanged compared to the previous month. Multifamily permits increased 0.2% to an annualized 487,000 pace.

Looking at regional permit data compared to the previous month, permits are 6.1% lower in the Northeast, 1.8% higher in the Midwest, 0.1% lower in the South and 2.3% higher in the West.

The number of single-family homes under construction in January is down 6.3% from a year ago, to 641,000 units. The number of multifamily units under construction is down 22.1% from a year ago, to 768,000 units.

There were 669,000 multifamily completions in January, up 11% from January 2024. For each apartment starting construction, there are 1.8 apartments completing the construction process.

Discover more from Eye On Housing

Subscribe to get the latest posts sent to your email.


This article was originally published by a eyeonhousing.org . Read the Original article here. .
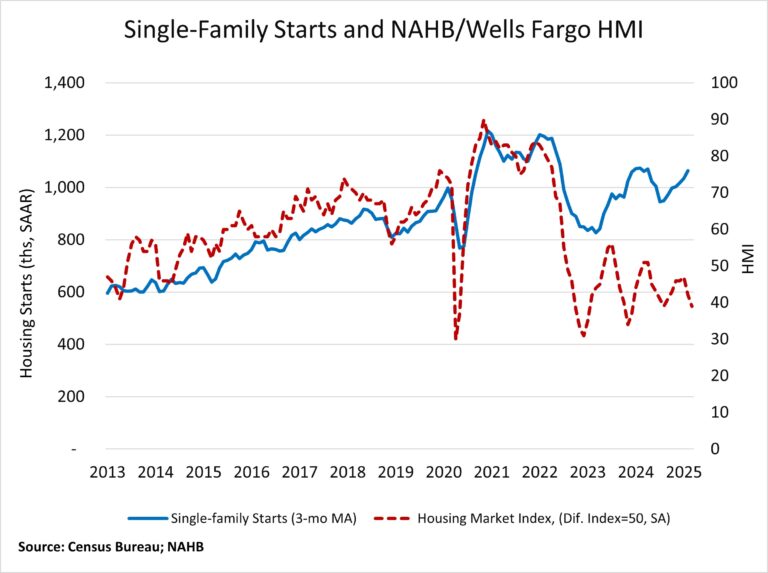

Fueled by solid demand, single-family construction moved higher in December despite several headwinds facing the industry, including high mortgage rates, elevated financing costs for builders and a lack of buildable lots.

Overall housing starts increased 15.8% in December to a seasonally adjusted annual rate of 1.50 million units, according to a report from the U.S. Department of Housing and Urban Development and the U.S. Census Bureau. This is the highest rate since February 2024.

The December reading of 1.50 million starts is the number of housing units builders would begin if development kept this pace for the next 12 months. Within this overall number, single-family starts increased 3.3% to a 1.05 million seasonally adjusted annual rate. The multifamily sector, which includes apartment buildings and condos, increased 61.5%for December to a 449,000 pace.

Total housing starts for 2024 were 1.36 million, a 3.9% decline from the 1.42 million total from 2023. Single-family starts in 2024 totaled 1.01 million, up 6.5% from the previous year. NAHB is forecasting a slight gain for single-family home building in 2025 because of a persistent housing shortage and ongoing solid economic conditions.

Multifamily starts ended the year down 25% from 2023. In December, and on a three-month moving average basis, there were 1.7 apartments completing construction for every one apartment starting construction. Multifamily construction will stabilize later in 2025 as more deals pencil out, with the industry supported by a low national unemployment rate.

Single-family completions ended 2024 up 2.2%.  Multifamily completions ended 2024 up 35%.  Within multifamily, the missing middle (two- to four-unit completions) were up 42.5%, for a total of 16,600 duplexes through quadplexes. Like ongoing strength for townhouse construction, this market data indicates that with zoning reform more medium density housing can be built in markets where such demand exists.

On a regional and for 2024 year, combined single-family and multifamily starts were 9.1% higher in the Northeast, 0.1% lower in the Midwest, 5.2% lower in the South and 7.7% lower in the West.

Overall permits decreased 0.7% a 1.48 million unit annualized rate in December and were down 3.1% compared to December 2023. Single-family permits increased 1.6% to a 992,000 unit rate but were down 2.5% in December compared to the previous year. Multifamily permits decreased 5.0% to a 491,000 pace.

Looking at regional permit data for 2024 permits were 1.5% higher in the Northeast, 3.5% higher in the Midwest, 3.1% lower in the South and 6.6% lower in the West.

Total permits for 2024 were 1.47 million, a 2.6% decline from the 1.51 million total from 2023. Single-family permits in 2024 totaled 981,000 up 6.6% from the previous year, a positive sign for 2025.

The number of single-family homes under construction was down 5.3% from a year ago, at 641,000 homes. The number of apartments under construction was down 21% from a year ago, at 790,000. The count of apartments under construction peaked in July 2023 at 1.02 million and has been trending lower since that time.

Discover more from Eye On Housing

Subscribe to get the latest posts sent to your email.


This article was originally published by a eyeonhousing.org . Read the Original article here. .
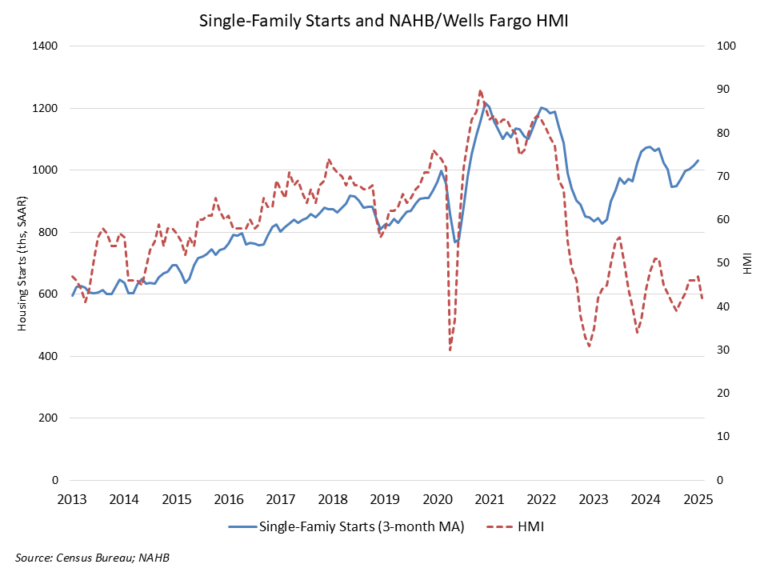

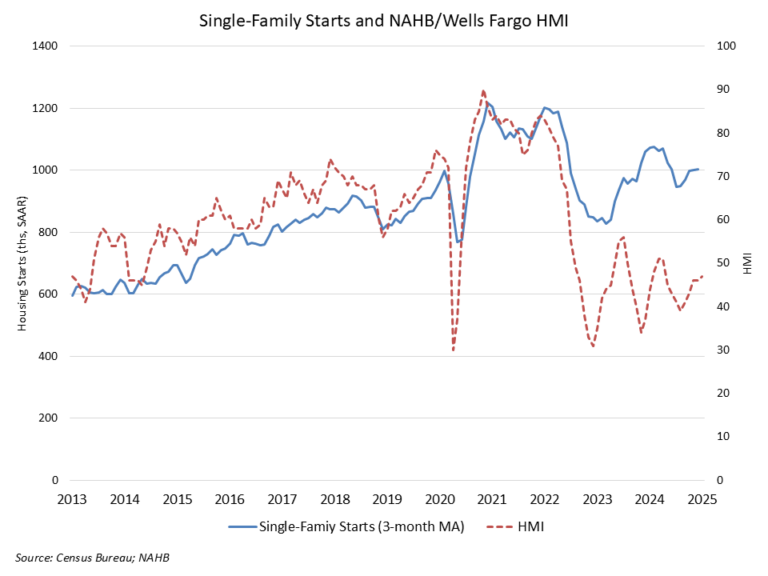
Ongoing lean levels of single-family existing home inventory helped to boost single-family production in November, while overall housing production fell because of a double-digit percentage drop in multifamily construction.

Overall housing starts decreased 1.8% in November to a seasonally adjusted annual rate of 1.29 million units, according to a report from the U.S. Department of Housing and Urban Development and the U.S. Census Bureau.

The November reading of 1.29 million starts is the number of housing units builders would begin if development kept this pace for the next 12 months. Within this overall number, single-family starts increased 6.4% to a 1.01 million seasonally adjusted annual rate. On a year-to-date basis, single-family construction is up 7.2%. The multifamily sector, which includes apartment buildings and condos, decreased 23.2% to an annualized 278,000 pace.

While the pace of single-family starts increased in November, single-family permitting was flat as builders face mixed market conditions that include an election result that promises a focus on regulatory relief, but ongoing elevated mortgage rates.

NAHB is forecasting single-family starts to post a slight increase in 2025 as the financing conditions for builders improve modestly. The significant decline for apartment construction is forecasted to end next year, with that market stabilizing during the second half of 2025.

On a regional and year-to-date basis, combined single-family and multifamily starts are 7.3% higher in the Northeast, 2.4% lower in the Midwest, 5.8% lower in the South and 5.9% lower in the West.

Overall permits increased 6.1% to a 1.51 million unit annualized rate in November. Single-family permits increased 0.1% to a 972,000 unit rate and are up 8.0% on a year-to-date basis. Multifamily permits increased 19.0% to an annualized 533,000 pace.

Looking at regional data on a year-to-date basis, permits are 3.2% higher in the Northeast, 4.8% higher in the Midwest, 2.5% lower in the South and 7.0% lower in the West.

The number of single-family units under construction is down 6.3% from a year ago, declining to 637,000 homes. The number of multifamily units under construction is down 20.5% from a year ago, to 797,000 units.

In November, there were two multifamily units completed for every one unit starting construction. Two years ago, there were just 0.7 multifamily units being completed for every 1 unit starting construction.

The count of multifamily units in 5-plus unit properties units completing construction of is up 36.1% on a year-to-date basis for 2024. In contrast, single-family completions are up 3.6% on a year-to-date basis.

Discover more from Eye On Housing

Subscribe to get the latest posts sent to your email.


This article was originally published by a eyeonhousing.org . Read the Original article here. .
Pin It