Tag

Spending

Browsing


The housing market has changed greatly since the COVID-19 pandemic, along with consumer spending behaviors. During this period, housing demand surged, home prices appreciated rapidly, inflation increased, supply-chain disruptions happened, and mortgage rates moved from historic lows to elevated levels. These changes raise important questions about whether home buyer spending patterns have changed and how long the spending boosts associated with a home purchase last.

Using pooled Consumer Expenditure Survey (CES) microdata from 2020 to 2023, we find buyers of newly built and existing single-family detached homes generate almost the same increase in spending during the first year after purchase, about $8,750 and $8,674, respectively. The key difference is not the amount of additional spending, but its composition. Buyers of newly built homes spend more on furnishings, while buyers of existing homes spend more on property alterations and repairs. For both groups, most appliance purchases occur during the first year after buying a home.

Spending Attributable to Home Buying

Because these socio-economic characteristics also influence spending, comparing group averages alone overstates the effect of the home purchase itself. Therefore, it is worthwhile to estimate how much additional spending is associated with purchasing a home after taking these differences into account[1].  We then use the results to compare predicted spending for similar households under different homeownership situations.

Table 1 shows how purchasing a newly built home affects household spending after accounting for differences in household characteristics. The estimates compare the same household under two scenarios: if it purchases a newly built home and if it does not move. The Year 1, Year 2, and Year 3 columns show the predicted annual spending of a typical newly built home buyer in the first three years after purchasing a home, while the “If Not Moving” column shows the predicted spending for the same household had it remained in its current home in one year. The differences shown in parentheses represent the additional spending associated with buying a newly built home compared to a nonmoving counterpart.

If the typical new home buyer does not move, it is predicted to spend about $2,722 per year on appliances, $2,354 on furnishings, and $9,660 on property alterations and repairs. During the first year after purchasing a newly built home, spending increases in all three categories. The largest increase is in furnishings, where predicted spending rises to $7,236, about $4,882 more than for an otherwise identical non-moving homeowner. Appliance spending also increases substantially to $4,475 (+$1,752). Property alterations and repair spending rises to $11,776 (+$2,116), although this increase is not statistically significant.

The spending boost changes over time. Appliance spending is concentrated in the first year after purchase and returns close to the non-moving level thereafter. Furnishing spending also peaks in the first year but remains moderately higher in the second and third years, suggesting that households continue furnishing their homes over time. In contrast, property alterations and repair spending shows little evidence of a lasting increase. This pattern is consistent with newly built homes requiring fewer repairs and replacements, so post-purchase property alterations projects are generally more discretionary.

Table 2 presents a similar comparison for households with characteristics typical of an existing home buyer. During the first year after purchase, a typical buyer of existing homes spends significantly more than otherwise identical homeowners who does not move on appliances, furnishings, and property alterations and repair projects. The largest increase occurs in property alterations and repairs, with predicted annual spending of $13,882, approximately $5,498 more. A typical buyer of existing homes also spends more on furnishings (+$1,973) and appliances (+$1,202).

Typical existing home buyers spend more on appliances primarily during the first year after purchase. Furnishing expenditures decline after the first year but remain modestly elevated through the third year. Property alterations and repair spending exhibits the greatest persistence. Even in the second and third years after purchase, buyers of existing homes continue to spend substantially more on property alterations and repairs. This sustained spending reflects that existing homes often required renovations, repairs, and deferred maintenance that are completed over time after purchase.

[1] Tobit regression is used in this statistical analysis, because many households reports no spending in a given category.


This article was originally published by a eyeonhousing.org . Read the Original article here. .


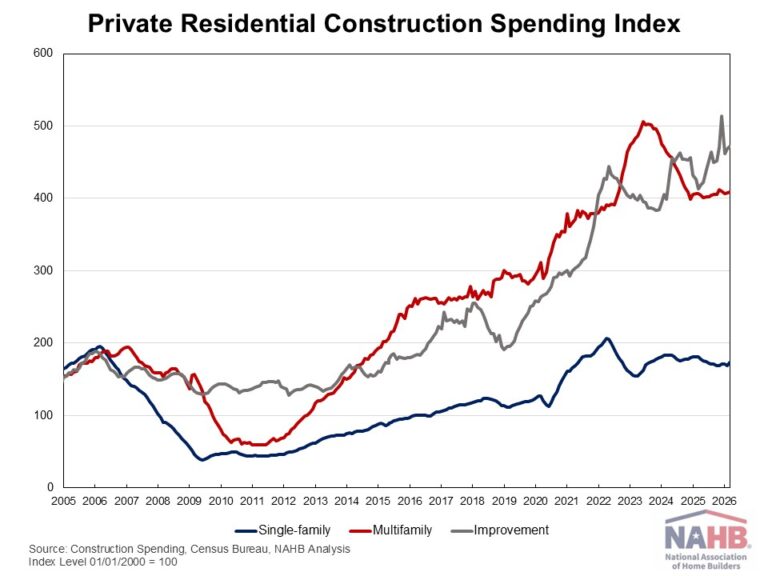
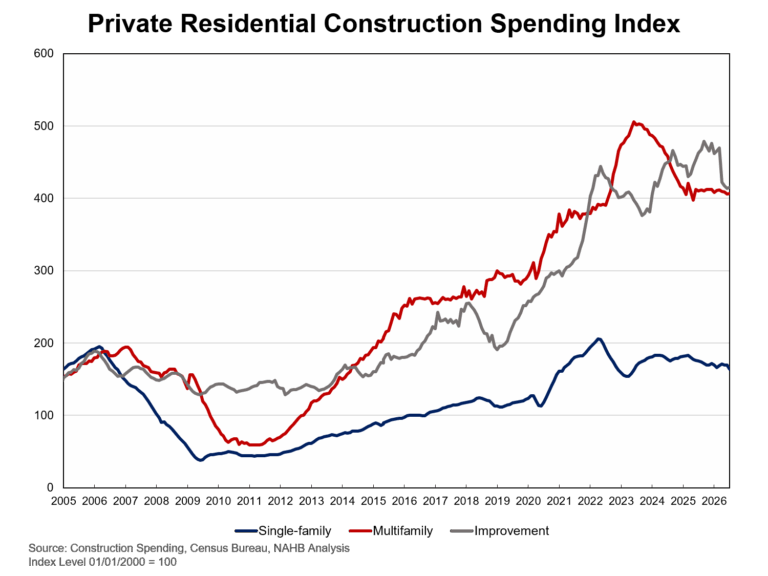
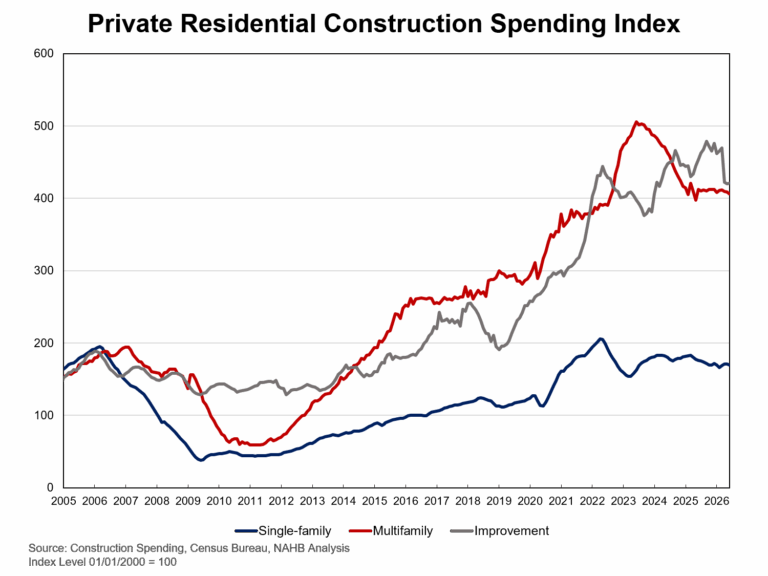
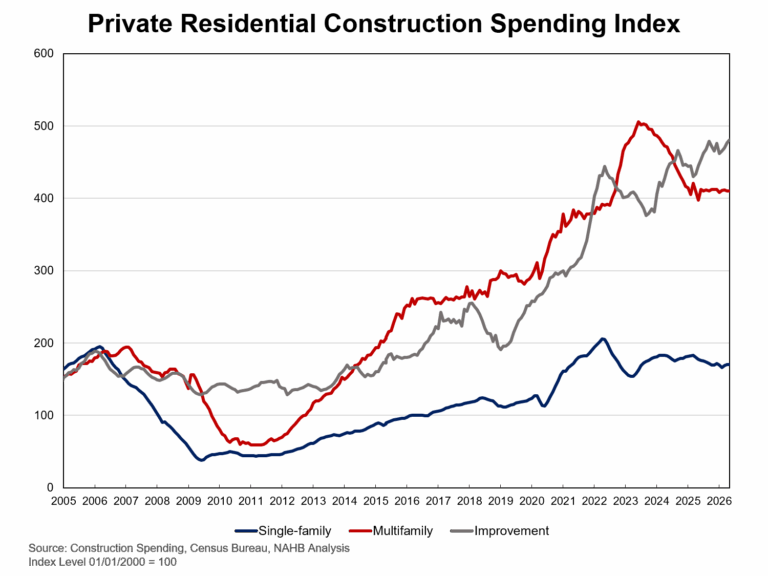
Private residential construction spending rose modestly in May 2026, marking the third consecutive month of gains, albeit at a slower pace. According to the latest construction spending data from the U.S. Census Bureau, private residential construction spending came in at a seasonally adjusted annual rate (SAAR) of $930.2 billion in May, up 0.3% from April and up 1.8% from a year ago.

The increased spending was driven by improvement (remodeling) spending, which was the only residential sector that posted a monthly increase. Remodeling spending rose 0.9% over the month and 8.1% over the year. Single-family construction spending decreased 0.1% in May, consistent with the weak builder sentiment reflected in the NAHB/Wells Fargo Housing Market Index (HMI); on a yearly basis, single-family spending is down 4.0%. Multifamily construction spending also edged down 0.1% from April, though it is up 3.3% from a year ago.

The NAHB construction spending index is shown in the graph below. The index illustrates how spending on single-family construction has slowed since early 2024, reflecting the impacts of elevated interest rates and ongoing uncertainty over building material tariffs. Multifamily construction spending growth has also slowed down after the peak in June 2023, with the index largely plateauing since late 2024. In contrast, improvement spending has been on an upward trend since the beginning of 2025, supported in part by the aging housing stock and sustained demand for renovation. 

Spending on private nonresidential construction was down 0.3% in May and down 6.6% from a year ago. Meanwhile, spending on data centers is still increasing, albeit at a slower pace, up 0.6% month-over-month and 23% year-over-year.


This article was originally published by a eyeonhousing.org . Read the Original article here. .


Residential remodeling is an important and growing sector of the housing market, particularly as elevated mortgage rates and limited housing inventory encourage many homeowners to improve their existing homes rather than move. Moreover, the aging housing stock and persistent housing inadequacy issue continue to drive growing demands for home improvements.

In 2024, homeowners spent around $670 billion on home remodeling projects. Roughly 20 million households, representing 23% of all owner-occupied households, reported remodeling expenditures during the year. Using data from the Consumer Expenditure Survey (CES), this analysis examines how remodeling expenditures vary across household characteristics, including household type, householder age, generational cohort, and household income. Remodeling expenditures in this analysis include three major categories of home improvement projects: additions, alterations, and replacements.

Household Types

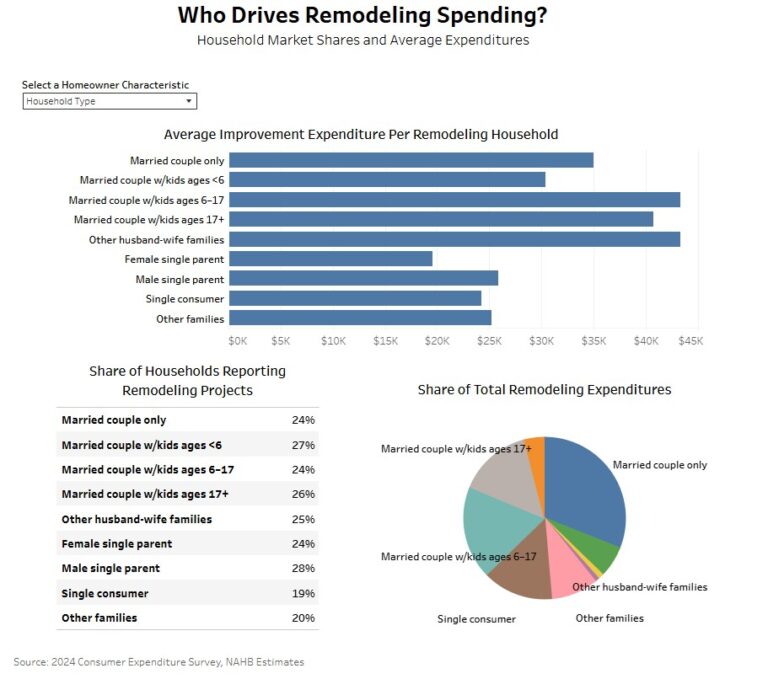
Married-couple households accounted for the majority of remodeling activity in 2024, both in the number of households reporting projects and the highest amount of spending. Around 60% of all households that reported a remodeling project were married couple households, equating to 12 million households spending a combined $458 billion.

More specifically, married couple households with children make up over a third (37.3%) of the total share of remodeling expenditures. Married couples with children ages 6-17 spend the most per remodeling household annually compared to other married couples, averaging $43,330. These households are often in their prime earning years and might improve their homes to meet the needs of their growing families through projects like kitchen and bathroom upgrades, additional bathrooms, or finished basements. This is evident as this group spends more on addition projects than any other household type, with an average expenditure of $159,187.

Married couples without children also make up a significant share of the total remodeling expenditure, representing 36.6%. Nearly 5.9 million married couple households undertook remodeling projects and spent around $208 billion on improvements in 2024.

In contrast, single-parent households made up less than 2% of total remodeling spending and spent less per remodeling household. Male single-parents spent slightly more than female single parents, averaging $25,904 compared to $19,542.  Single-consumer households represented a much larger share of total remodeling expenditures at 14%, averaging $24,286 per remodeling household annually. However, only 19% reported remodeling expenditures in 2024, the lowest remodeling participation rate among all household groups.

Other husband-wife households, which likely include multigenerational and more complex household arrangements, made up just 6% of total expenditures. However, among households reporting remodeling projects, they spent an average of $43,347 annually, the highest across all household types. The larger household size and more complex living arrangements in these households may increase the demand for expanded living space to accommodate extended family members. As a result, these households spent an average of $131,173 on addition projects in 2024.

Age Group

Remodeling expenditures change substantially across age groups and generally follow a life-cycle pattern with two notable peaks: Homeowners aged 35-44 and 55-64. These two groups reported the highest remodeling expenditure. Households aged 35-44 spent an average of $42,400 among those who remodeled in 2024, while households aged 55-64 averaged roughly $40,300. The first peak is consistent with family formation, as the median age of first-time home buyers is 38 years old.  The second peak among homeowners aged 55-64 may reflect pre-retirement remodeling, including long-term home modernization, or aging-in-place preparations.

Participation rates were also relatively high among homeowners aged 45-54 and 55-64 groups, at around 24%. In contrast, homeowners aged 85 and older reported both the lowest participation rate, at 18%, and the lowest remodeling expenditures overall.

Generational Group

It is also worthwhile to look at how remodeling activities vary across generational cohorts. Among generational groups, Baby Boomers took up the largest share of total remodeling expenditures, spending around $254 billion in 2024, around 38% of all remodeling expenditures. This reflects not only the larger size of the Baby Boomer homeowner household number and their relatively higher remodeling participation rate (24%), but also the greater home equity accumulated by this generation over time, which may increase the financial capacity to do home improvement projects. Gen X households followed Baby Boomer group closely, with more than $207 billion spent on remodeling projects in 2024. Many Gen X homeowners at their peak earning years and have higher homeownership rates, supporting continued investment in long-term home upgrades and improvements.

Among all homeowners who remodel their homes in 2024, Millennials reported the highest average spending at around $36,300, followed by Gen X ($33,700). It was likely supported by rising homeownership and first-time home buying. Millennials also spent relatively more on additions, with average expenditure on additions exceeding $160,000. These patterns largely reflect the needs of growing families, and/or remote work.

By comparison, Gen Z and Silent Generation households reported low remodeling participation rates and smaller expenditures overall, reflecting the earlier and later stages of the homeownership life cycle. Only 21% of Gen Z homeowners and 18% of Silent Generation undertook remodeling projects in 2024.  As a result, their shares of total remodeling expenditure remained relatively small, accounting for around 1.8% and 5.1% of the remodeling market, respectively.

Household Income

Remodeling expenditures rise substantially with household income. Around 40% of total remodeling spending came from homeowners earning $200,000 or more. Higher-income households were more likely to remodel and spent substantially more when they did. Nearly 29% of households with $200,000 or more income had home improvement projects in 2024, compared to only 18% among households earning less than $50,000. Among households who reported remodeling projects, households earning $200,000 or more spent nearly $61,000 on average in 2024, which was more than three times the average spending of households with less than $50,000 income.

These findings highlight how remodeling activity varies across household composition, age, generation, and income. Married-couple households, middle-aged homeowners, and higher-income households remain the primary contributors to remodeling demand as homeowners improve and upgrade their existing homes to meet their changing family and lifestyle needs.

Average Remodeling Spending Across All Homeowner Households

It is also important to examine average remodeling expenditures across all homeowner households, not just among those reporting remodeling projects. Measuring expenditures among all homeowner households captures both the prevalence and intensity of remodeling activity, providing a broader view of the market’s overall economic impact. By including households with no remodeling spending, the dashboard below shows how average spending varies across different household characteristics, like household type, age, generation, and income.

This article was originally published by a eyeonhousing.org . Read the Original article here. .


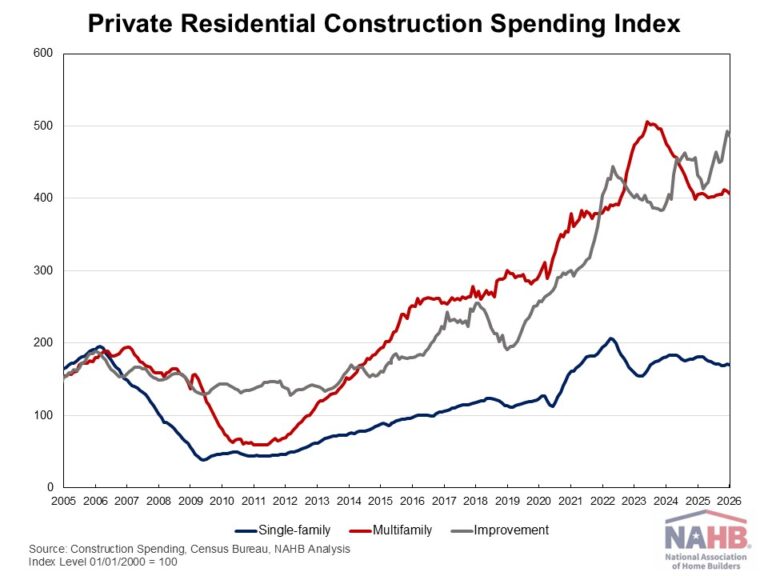
Private residential construction spending was up 1.7% in March 2026, following two straight months of declines. The increase was broad-based, with gains in single-family, multifamily construction, and home improvement spending. Moreover, total private residential construction spending was 3.6% higher than a year ago.

According to the latest construction spending data from the U.S. Census, single-family construction spending increased 2.7% in March, consistent with the steady builder confidence reflected in the NAHB/Wells Fargo Housing Market Index (HMI). Despite the monthly gain, single-family construction spending was down 4.2% over a year ago. Meanwhile, multifamily construction spending edged up 0.3% in March. This marks the second monthly increase after two consecutive months of modest declines. Compared to a year earlier, multifamily spending was 0.5% higher. Improvement spending (remodeling) also increased in March, rising 0.9% for the month. Remodeling remained a bright spot on a year-over-year basis, with spending up 14.3% from March 2025.

The NAHB construction spending index is shown in the graph below. The index illustrates how spending on single-family construction has slowed since early 2024, reflecting the impacts of elevated interest rates and ongoing uncertainty over building material tariffs. Multifamily construction spending growth has also slowed down after the peak in July 2023, with the index largely plateauing since late 2024. In contrast, improvement spending has been on an upward trend since the beginning of 2025, supported in part by the aging housing stock and sustained demand for renovation.

Spending on private nonresidential construction was down 2.1% over a year ago. The annual private nonresidential spending decrease was driven by a $39 billion drop in manufacturing construction spending.


This article was originally published by a eyeonhousing.org . Read the Original article here. .


Remodeling has become increasingly important in the housing sector due to the aging housing stock, the trend of aging-in-place improvements, and more home owners choosing to stay put because of the lock-in effect from elevated mortgage rates. As a result, there has been a rising demand in remodeling activity which is why the National Association of Home Builders (NAHB) is forecasting continued growth for this sector both in the short-term and the long-run.

While national estimates are key to measuring remodeling activity, there is a research gap in localized remodeling data. To address this, NAHB is debuting a new economic resource: the State Projections of Remodeling (SPR). Based on a proprietary model developed by the NAHB Economics team, SPR will provide a quarterly, state-level estimation of the market share and total dollar value of remodeling spending one month after the release of the NAHB Remodeling Market Index (RMI).

Q4 2025 Results

During the fourth quarter of 2025, remodeling spending at the national level came in at $280.1 billion on a seasonally adjusted annualized rate (SAAR), accounting for 37.7% of total private residential fixed investment. Even though spending fell for the second consecutive quarter from $282.6 in Q3 2025, remodeling spending has been larger than single-family construction spending for five straight quarters.

California had the largest market share of remodeling spending at 7.9%, or $22.1 billion. This is followed by Texas (7.0%, or $19.7 billion), Florida (5.5%, or $15.3 billion), New York (3.9%, or $11.0 billion), and North Carolina (3.0%, or $8.4 billion).

The top 10 states account for over 40% of total remodeling spending for the quarter, or $114.5 billion. The top 10 list by market share includes states from all Census regions: four in the South, three in the Northeast, two in the West, and one in the Midwest. Remodeling spending will typically follow population levels, with the top four states (California, Texas, Florida, New York) also the most populous according to the 2025 estimates from the U.S. Census Bureau.

When looking at the top 10 states by the change in remodeling spending from Q4 2024 (on a four-quarter moving average basis or 4QMA), Michigan took the lead with almost a billion dollar increase in spending. The next four states (Virginia, North Carolina, Ohio, Alabama) increased around $600 million. All ten states experienced a growth rate of at least 5.0% year-over-year. Except for the Northeast, all regions were represented within the top 10 by change in spending.

To learn more about this new resource and its methodology, please visit NAHB’s SPR web page.


This article was originally published by a eyeonhousing.org . Read the Original article here. .


Private residential construction spending declined 0.8% in January 2026, following two months of gains. This decline was driven by lower spending across single-family, multifamily construction, and home improvement.  Despite the monthly decline, total residential construction spending remained 2.3% higher than a year ago.

According to the latest construction spending data from the U.S. Census, single-family construction spending edged down by 0.2% in January, consistent with the softer builder confidence reflected in the NAHB/Wells Fargo Housing Market Index (HMI). Compared to a year ago, single-family construction spending was down 5.8%. Meanwhile, multifamily construction spending also decreased mildly, falling 0.7% in January. This marks the second monthly decrease following six consecutive months of modest gains. Compared to a year earlier, multifamily spending was 0.4% higher. Improvement spending (remodeling) declined 1.4% for the month but remained a bright spot on a year-over-year basis, rising 12.5%.

The NAHB construction spending index is shown in the graph below. The index illustrates how   spending on single-family construction has slowed since early 2024, reflecting the impacts of elevated interest rates and ongoing uncertainty over building material tariffs. Multifamily construction spending growth has also slowed down after the peak in July 2023, with the index largely plateauing since late 2024. In contrast, improvement spending has been on an upward trend since the beginning of 2025, supported in part by the aging housing stock and sustained demand for renovation.

Spending on private nonresidential construction was down 3% over a year ago. The annual private nonresidential spending decrease was primarily driven by a $35 billion drop in manufacturing construction spending, followed by a $0.8 billion decrease in commercial construction spending.


This article was originally published by a eyeonhousing.org . Read the Original article here. .


Private residential construction spending was up 1.5% for the last month of 2025. This modest gain was driven primarily by increased spending on home improvements and single-family construction. Despite this increase, total spending remained 1.3% lower than a year ago, reflecting the continued impact of housing affordability challenges facing the sector.

According to the latest construction spending data from the U.S. Census, single-family construction spending was up by 1.6% in December, consistent with the soft builder confidence reflected in the NAHB/Wells Fargo Housing Market Index (HMI). Compared to a year ago, single-family construction spending decreased 3.6%. Meanwhile, multifamily construction spending edged up 0.1% in December, marking a seventh consecutive month of modest gains. Compared to a year earlier, multifamily spending was 2.9% higher. Improvement spending (remodeling) rose 1.8% for the month but stayed flat relative to a year ago.

The NAHB construction spending index is shown in the graph below. The index illustrates how   spending on single-family construction has slowed since early 2024 under the pressure of elevated interest rates and concerns over building material tariffs. Multifamily construction spending growth has also slowed down after the peak in July 2023, with the index largely plateauing since late 2024. In contrast, improvement spending has been on an upward trend since the beginning of 2025.

Spending on private nonresidential construction was down 1.8% over a year ago. The annual private nonresidential spending decrease was primarily driven by a $26 billion drop in manufacturing construction spending, followed by a $2 billion decrease in healthcare construction spending.


This article was originally published by a eyeonhousing.org . Read the Original article here. .


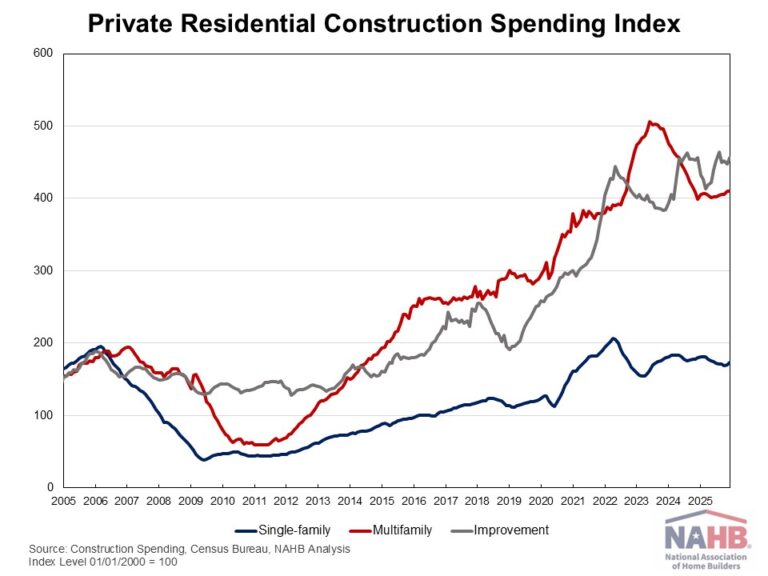
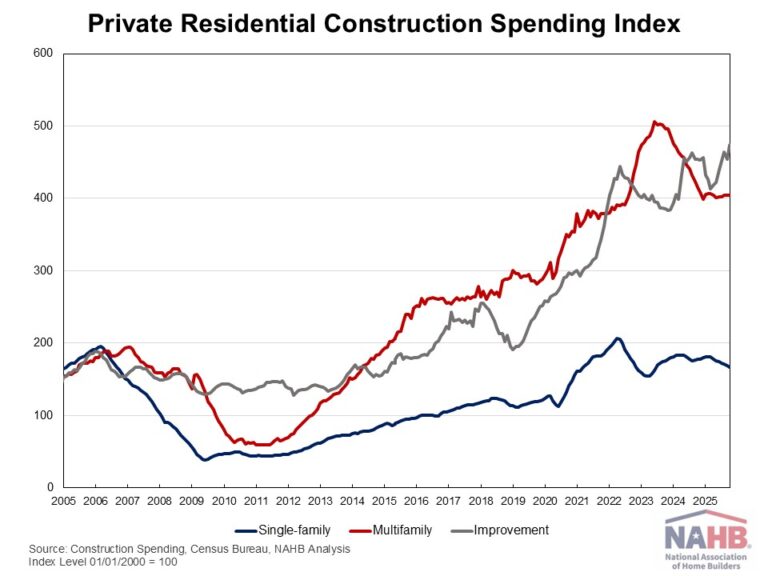
Private residential construction spending was up 1.3% in October, rebounding from a 1.4% decline in September 2025. This modest gain was primarily driven by increased spending on home improvements. Despite this increase, total spending remained 1.3% lower than a year ago, as the housing sector continues to navigate the economic uncertainty stemming from ongoing tariff concerns and elevated mortgage rates.

According to the latest U.S. Census construction spending data, single-family construction spending declined 1.3% in October, consistent with the soft builder confidence reflected in the NAHB/Wells Fargo Housing Market Index (HMI). Compared to a year ago, single-family construction spending decreased by 6.1%. Meanwhile, multifamily construction spending edged down 0.2% in October after four consecutive months of modest gains. Compared to a year earlier, multifamily spending was still down 2.8%. Improvement spending (remodeling) rose 4.5% for the month and was up 4.4% compared to a year ago.

The NAHB construction spending index is shown in the graph below. The index illustrates how   spending on single-family construction has slowed since early 2024 under the pressure of elevated interest rates and concerns over building material tariffs. Multifamily construction spending growth has also slowed down after the peak in July 2023, with the index largely plateauing since late 2024. In contrast, improvement spending has been on an upward trend since the beginning of 2025.

Spending on private nonresidential construction was down 2.6% over a year ago. The annual private nonresidential spending decrease was primarily driven by a $23 billion drop in manufacturing construction spending, followed by a $3.8 billion decrease in commercial construction spending.


This article was originally published by a eyeonhousing.org . Read the Original article here. .


Private residential construction spending fell by 0.7% in June, marking the sixth straight month of decreases. This decline was primarily driven by reduced spending on single-family construction. Compared to a year ago, total spending was down 6.2%, as the housing sector continues to navigate the economic uncertainty stemming from ongoing tariff concerns and elevated mortgage rates. 

According to the latest U.S. Census Construction Spending data, single-family construction spending declined by 1.8% in June. This decrease aligns with the weak single-family starts in June and the third lowest reading of NAHB/Wells Fargo Housing Market Index (HMI) since 2012. Compared to a year ago, single-family construction spending decreased by 5.3%. Meanwhile, multifamily construction spending stayed flat for the month but continued to follow the downward trend that began in mid-2023. Compared to June 2024, multifamily spending was down 9.5%. Improvement spending (remodeling) was up 0.5% in June but was 6.1% lower on a year-over-year basis.  

The NAHB construction spending index is shown in the graph below. The index illustrates how   spending on single-family construction has slowed since early 2024 under the pressure of elevated interest rates and concerns over building material tariffs. Multifamily construction spending growth has also slowed down after the peak in July 2023. Additionally, improvement spending has been weakening since the beginning of 2025.


Meanwhile, spending on private nonresidential construction was down 4% over a year ago. The annual private nonresidential spending decrease was primarily driven by a $14.7 billion drop in the manufacturing category, followed by a $13.7 billion decrease in commercial construction spending.

Discover more from Eye On Housing

Subscribe to get the latest posts sent to your email.


This article was originally published by a eyeonhousing.org . Read the Original article here. .


Private residential construction spending fell by 0.5% in May, marking the fifth straight month of decreases. This drop was primarily driven by reduced spending on single-family construction. Compared to a year ago, total spending was down 6.7%, as the housing sector continues to navigate the economic uncertainty stemming from ongoing tariff concerns and elevated mortgage rates.

According to the latest U.S. Census Construction Spending data, single-family construction spending declined by 1.8% in May. This decrease aligns with the third lowest reading of NAHB/Wells Fargo Housing Market Index (HMI) since 2012. Compared to a year ago, single-family construction spending decreased by 4.5%. Meanwhile, multifamily construction spending stayed flat for the month but continued to follow the downward trend that began in mid-2023. Compared to May 2024, multifamily spending was down 10.9%. Improvement spending (remodeling) was up 0.9% in May but was 7.8% lower on a year-over-year basis.

The NAHB construction spending index is shown in the graph below. The index illustrates how   spending on single-family construction has slowed since early 2024 under the pressure of elevated interest rates and concerns over building material tariffs. Multifamily construction spending growth has also slowed down after the peak in July 2023. Improvement spending has also been weakening since the beginning of 2025.

Spending on private nonresidential construction was down 3.9% over a year ago. The annual private nonresidential spending decrease was primarily driven by a $15 billion drop in commercial construction spending, followed by a $9.0 billion decrease in the manufacturing category.

Discover more from Eye On Housing

Subscribe to get the latest posts sent to your email.


This article was originally published by a eyeonhousing.org . Read the Original article here. .

Pin It