Tag

Smaller

Browsing


Material costs increased by 6.7% over the previous year, according to results from the survey for the July 2026 NAHB/Wells Fargo Housing Market Index (HMI).

A large majority (72.9%) of the builders responding to the survey reported that their cost of materials for the same house increased by up to 15% over the past year (at the time of the survey in early July). The most common response (28.4% of builders) was that material prices increased by 5% to 9.99%, followed by 22.4% who indicated a less than 5% change, and 22.1% who indicated 10% to 14.99%.

The median was an annual increase of 6.7% in material costs for the same house. This matches  the 6.7% annual increase in in the price of goods (including energy) used in new residential construction reported by NAHB in its recent post on the July Producer Price Index. If energy is excluded, the PPI for goods used in new residential construction increased by 5.0% over that period.

Not all builders experienced the same increase, however. According to the HMI survey, the median annual increase in material prices declines regularly with the size of the builder: from a high of 9.1% for builders who started 5 or fewer homes in 2025, down to only 1.8% for builders with 100 or more starts.

Several reasonable explanations for this tendency exist. For example, larger builders may have greater ability to stockpile materials when they anticipate price increases. Larger builders may also have longer-term contracts with suppliers, locking in current prices for an extended period. Finally, larger builders may be more likely to have special relationships with certain suppliers, allowing them to negotiate deferred price increases.

The price of materials is important, but it is only one of several factors creating housing affordability challenges in the U.S. Others include relatively high mortgage rates, shortages of skilled construction labor, and several different types of regulatory costs.


This article was originally published by a eyeonhousing.org . Read the Original article here. .


The long-term shift toward building single-family detached homes on smaller lots appears to have stabilized. According to the latest Survey of Construction (SOC), the share of new homes built on smaller lots remained near record highs in 2025, following more than a decade of steadily shrinking lot sizes. While the median lot size edged up slightly in 2025, the increase was modest and did not alter the broader trend toward more compact development.

The share of smaller lots remained high in 2025, with close to two-thirds of new single-family detached homes sold occupying lots under 9,000 square feet (1/5 of an acre or less). Moreover, 38% of lots were under 7,000 square feet (or less than 1/6 of an acre). These shares are just slightly below the record highs established over the last two years.

In contrast, when the Census Bureau started tracking these series in 1999, less than half (46%) of new for-sale single-family detached homes occupied lots under 9,000 square feet. Our earlier analysis traced how new single-family detached homes have steadily shifted toward smaller lots. That analysis revealed that the trend accelerated over the last 15 years, reflecting persistent lot shortages and builders’ efforts to improve affordability.

The newly released data show that the median lot size of a new single-family detached home sold in 2025 increased slightly to 8,543 square feet, up from 8,506 square feet in 2024. Although this represents a small year-over-year increase, the typical lot remains under 1/5 of an acre and well below historical levels. It is only modestly above the record-low median of 8,177 square feet recorded in 2019. The data suggest that, after years of steady declines, lot sizes have largely leveled off while remaining historically small, under one-fifth of an acre.

While the nation’s production of spec homes shifts towards smaller lots, regional differences in lot sizes persist. Looking at single-family detached spec homes started in 2025, the median lot size in New England is double the national median.  

New England is known for strict local zoning regulations that often require very low density. Therefore, it is not surprising that single-family detached spec homes started in New England are built on some of the largest lots in the nation, with half of the lots exceeding 0.4 acres. The East South Central division is second on the list, with the median lot occupying 0.3 acres.  

At the other end of the spectrum, the Pacific division, where densities are high and developed land is scarce, has the smallest lots, with half of the lots being under 0.13 acres. The bordering Mountain division also reports typical lots smaller (0.15 acres) than the national median.  

In the South, the West South Central division stands out for starting half of single-family detached spec homes on lots under 0.15 acres. This is half the size of typical lots in the neighboring East South Central division.  

The analysis above is limited to single-family detached speculatively built homes. Custom homes built on an owner’s land with either the owner or a builder acting as the general contractor do not involve the work of a professional land developer subdividing a property. Therefore, in the case of custom homes, lots refer to an owner’s land area rather than lots in a conventional sense. Nevertheless, the SOC reports lot sizes for custom homes and shows that they tend to have larger lots. The median lot size for custom single-family detached homes started in 2025 is one acre.  

For regional analysis, the median lot size is chosen over the average because extreme outliers heavily influence averages. In addition, the Census Bureau often masks extreme lot sizes and values on the public use SOC dataset, making it difficult to calculate averages precisely, but medians (as the midpoint of a frequency distribution) remain unaffected by these procedures.


This article was originally published by a eyeonhousing.org . Read the Original article here. .
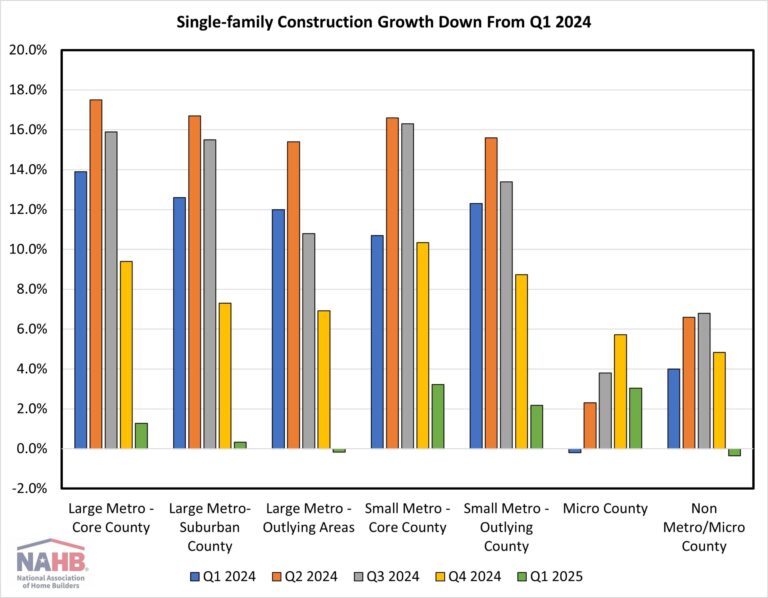

Single-family construction growth slowed substantially across all markets in the first quarter of 2025, according to the Home Building Geography Index (HBGI).  Multifamily construction growth remained negative in the largest markets but reported significant expansion in lower population density areas. The HBGI tracks single-family and multifamily permits across seven population density delineated geographies in the United States.  

Single-Family

Among the HBGI geographies, the highest growth in the first quarter of 2025 was registered in small metro core counties, which increased 3.2% year-over-year on a four-quarter moving average basis (4QMA). The market with the largest decline in growth between the fourth quarter and first quarter was large metro core counties, which saw its four-quarter moving average growth rate fall from 9.4% to 1.3% (-8.1 pp). Two geographies, large metro outlying areas and non metro/micro counties, reported declines in the first quarter, down 0.2% and 0.4% respectively.

In terms of market share, single-family construction took place primarily in small metro core county areas, representing 29.2% of single-family construction. The smallest single-family construction market remained non metro/micro county areas, with a 4.2% market share. Single-family construction market share have been stable since the first quarter of 2024, with the largest gain being 0.4 percentage points in small metro core counties over the year.  

Multifamily

Multifamily construction expanded 33.2% in large metro outlying areas in the first quarter, the highest growth (4QMA) since the second quarter of 2022 when this geography grew 71.8%. Growth was present in three other geographies, with micro counties up 29.3%, small metro outlying counties up 18.5%, and non metro/micro counties up 3.7%.

Because of the notable increase in multifamily construction occurring in smaller markets, market shares have shifted over the past two years. Large metro core counties, where a plurality of construction takes place, saw a 4.8 percentage point drop in market share between Q1 of 2024 and 2025. The largest construction gains have been in low population density areas, with the combined market share for small metro outlying counites, micro counties and non metro/micro counties growing 2.2 percentage points from 7.8% to 10.0% between Q1 2024 and 2025.

The first quarter of 2025 HBGI data along with an interactive HBGI map can be found at http://nahb.org/hbgi.

Discover more from Eye On Housing

Subscribe to get the latest posts sent to your email.


This article was originally published by a eyeonhousing.org . Read the Original article here. .

Pin It