Tag

Slows

Browsing


Housing starts fell sharply in May, driven by a steep drop in multifamily construction. Meanwhile, single-family buildings also slipped amid high interest rates, rising construction costs and ongoing labor shortages.

Overall housing starts decreased 15.4% in May to a seasonally adjusted annual rate of 1.18 million units, according to a report from the U.S. Department of Housing and Urban Development (HUD) and the U.S. Census Bureau. This pace reflects the number of housing units builders would begin over the next 12 months if May’s activity was sustained.

Within the total, single-family starts decreased 1.9% to an 882,000 seasonally adjusted annual rate and were down 6.7% compared to May 2025. On a year-to-date basis, single-family starts are down 6.3%. The three-month moving average fell to 933,000 units. Multifamily starts, which include apartment buildings and condominiums, dropped 40.2% from April to May to a 295,000-unit annualized pace and were down 14.2% compared to May 2025.

Regionally, on a year-to-date basis, combined single-family and multifamily starts were 17.5% higher in the Northeast, 4.1% lower in the Midwest, 1.6% lower in the South, and 4.9% lower in the West. For single-family starts, the Midwest has shown resilience, with starts holding steady on a year-to-date basis, while the Northeast, South, and West continue to post declines.

Overall permits decreased 0.7% to a 1.41-million-unit annualized rate in May. Single-family permits increased 0.6% to an 886,000-unit rate but remained 1.8% below their May 2025 level. Multifamily permits decreased 2.8% to a 527,000-unit annualized pace but were up 2.5% compared to May 2025.

Looking at regional permit data on a year-to-date basis, permits were 10% higher in the Northeast, 2.4% higher in the Midwest, 6.7% lower in the South, and 0.1% higher in the West.

The total number of housing units under construction stood at 1.27 million in May, down 7.1% from a year earlier. Single-family homes under construction totaled 587,000, a 5.9% year-over-year decline. Multifamily units under construction fell to 679,000, down 8.1% from a year ago and well below the peak of more than 1 million units reached in December 2023.

Housing completions also continued to soften. Single-family completions fell to an annual rate of 872,000 units, down 16.8% from a year earlier. Multifamily completions for buildings with five or more units declined 8.4% year over year to a 426,000-unit pace.


This article was originally published by a eyeonhousing.org . Read the Original article here. .


Residential demolition activity in 2025 declined 0.1% year-over-year but remained above pre-pandemic levels. According to NAHB analysis of data from Construction Monitor, permits pulled for residential demolition have been increasing since 2018, with the exception of 2020, when building-related activities broadly stalled. Demolition activity rebounded sharply in 2021 and 2022 but has since plateaued. Even with the recent stall, demolition permits in 2025 were still 34.2% higher than in 2018, underscoring the extent to which activity remains elevated relative to pre-pandemic norms.

While the data do not differentiate between partial or full demolitions, teardowns are often an indicator of redevelopment and neighborhood reinvestment, and thus, signals future construction. Previous NAHB survey analysis indicated that teardown-related construction projects made up approximately 7% of single-family starts in 2024.

At the state level, demolition activity is highly concentrated, with California, Texas, and Florida—the three most populous states—usually leading the nation in demolition permits. However, from 2023 through 2025, New Jersey ranked third in total demolition permits, surpassing Texas. New Jersey’s elevated demolition activity reflects the age of its housing stock. Approximately 73% of homes in the state were built before 1980, out of which 18% were built before 1939, leaving many properties functionally obsolete or in need of replacement. In response, several municipalities have pursued targeted redevelopment and blight reduction initiatives. For example, Trenton, the capital city, launched one of its largest blight reduction projects in 2023, aimed at revitalizing distressed neighborhoods and expanding the supply of quality housing.

In 2025, New Jersey accounted for approximately 10.4% of all residential demolition permits nationwide. Florida recorded the largest share at 14.6%, followed by California at 13.3%. Texas remained a significant contributor at 7.2%, while New York ranked fifth with about 4.1% of total activity. Collectively, the top five states accounted for nearly half of all residential demolition permits issued in 2025, highlighting the high degree of geographic concentration at the state level.

At a smaller geographic scale, the year-to-year variability is substantially higher. To account for this volatility, examining cumulative demolition permitting since 2018 provides insight into where demolition activity has been persistently concentrated over the current cycle. On this basis, Los Angeles County, CA accounted for the largest share of cumulative demolition permits (4.8%), followed by Harris County, TX (3.1%), Cuyahoga County, OH (2.6%), King County, WA (2.0%), and Miami-Dade County, FL (1.8%). Together, these five counties accounted for nearly 15% of all demolition activity nationwide over the period.


This article was originally published by a eyeonhousing.org . Read the Original article here. .


Mortgage application activity increased month-over-month as the 30-year fixed mortgage rates reached a three-year low. The Mortgage Bankers Association’s (MBA) Market Composite Index, a measure of total mortgage application volume, increased 1.5% from January on a seasonally adjusted basis and was 56.3% higher than a year earlier.  The data also indicated a rising adjustable-rate mortgage (ARM) share, increasing from 5.7% of mortgages to 8.3% over the past year.

The average contract interest rate for 30-year fixed mortgage rates declined a further seven basis points (bps) to 6.14%, tracking the decline in the 10-year treasury yield. Compared with February 2025, the 30-year fixed mortgage rate was 73 bps lower. The decline in mortgage rates supported the continued strength in refinancing activity, which increased 11.3%. On the other hand, purchase applications decreased 12.3% as tight existing-home inventory and winter storms dampened home-buying activity. Relative to February 2025, refinance and purchase activities are up 121.1% and 9.0%, respectively.

By loan type, applications for adjustable-rate mortgages (ARMs) increased 18.0% month-over-month while fixed-rate mortgages (FRMs) held steady. On a year-over-year basis, FRM applications were up 51.8%, while ARM applications more than doubled, rising 129.9%. As of February 2026, ARMs accounted for an average of 8.3% of total applications on a non-seasonally adjusted basis, up 1.2 percentage points from January and 2.6 percentage points higher than a year earlier.

Loan sizes across all loan types increased in February with the total market increasing by 3.2% to $414,800. Average purchase loan sizes increased 2.5% to $446,300, while the refinance loan size increased by 3.7% to $391,800. The average ARM loan size climbed 4.6% to $968,300.


This article was originally published by a eyeonhousing.org . Read the Original article here. .


Residential building material prices rose at a slower rate in January, according to the latest Producer Price Index release from the Bureau of Labor Statistics. This was the first decline in the rate of price growth since April of last year. Metal products continue to experience price increases, while specific wood products are showing declines in prices.

The Producer Price Index for final demand increased 0.5% in January, after rising 0.4% in December. The January increase in final demand is linked directly to final demand services, which saw prices rise 0.8% in January. The index for final demand goods decreased 0.3% in January.

The price index for inputs to new residential construction rose 0.7% in January and was up 3.3% from last year. The price of goods used in new residential construction was up 0.9% over the month and 2.4% from last year. Meanwhile, the price for services was up 0.3% over the month and up 4.7% from last year.

Input Goods

The goods component has a larger importance to the inputs to residential construction price index, representing around 60%. On a monthly basis, the price of input goods to new residential construction was up 0.9% in January.

The input goods to residential construction index can be further broken down into two separate components, one measuring energy inputs with the other measuring remaining goods. The latter of these two components simply represents building materials used in residential construction, which makes up around 93% of the goods index.

Energy input prices fell 0.9% in January and were 10.3% lower than one year ago. Building material prices were up 1.0% in January and up 3.3% compared to one year ago, marking the lowest year-over-year price change since July of last year.

The largest year-over-year price increases continue to show in metal products. Topping the list in January was metal molding and trim, with prices up 48.3% from last year. One product that has seen rapid price growth acceleration over the past few months has been nonferrous metal and cable with prices up 19.7%. Price declines for materials over the year are concentrated among wood products with prices for particleboard and fiberboard down 24.4%, treated wood products down 5.0%, and softwood lumber down 3.3%.

Input Services

Prices for service inputs to residential construction reported an increase of 0.3% in January. On a year-over-year basis, service input prices were up 4.7%. The price index for service inputs to residential construction can be broken out into three separate components: a trade services component, a transportation and warehousing services component, and a services excluding trade, transportation, and warehousing component (other services).

The most significant component is trade services (around 60%), followed by other services (around 29%), and finally transportation and warehousing services (around 11%). The largest component, trade services, was up 7.1% from a year ago. The transportation and warehousing services rose 2.0%, while prices for other services were up 1.1% over the year.

Expanded Inputs to New Construction

Within the PPI that BLS publishes, new experimental data was recently published regarding inputs to new construction. The data expands existing inputs to industry indexes by incorporating import prices with prices for domestically produced goods and services. With this additional data, users can track how industry input costs are changing among domestically produced products and imported products. This data focuses on new construction, but the complete dataset includes indices across numerous industries that can be found here on BLS website. 

New construction input prices are primarily influenced by domestically produced goods and services, with domestic products accounting for 90% of the weight of the industry index for new construction. Imported goods make up the remaining 10% of the index.  

The latest available data, for November 2025, showed that domestically produced goods continue to have faster price growth compared to imported goods used in new construction. On a year-over-year basis, the index for domestic goods increased 3.0%, while prices for imported goods have fallen 3.0%.


This article was originally published by a eyeonhousing.org . Read the Original article here. .


According to the U.S. Census Bureau’s latest estimates, the U.S. resident population grew by 1,781,060 to a total population of 341,784,857. The population grew at a rate of 0.5%, a sharp decline from the near 1.0% growth in 2024. The growth rate was the lowest since 2021 when it grew at 0.2%. The vintage population estimates are released annually and represent the change in the U.S. population between July 1st of 2024 and 2025.

The primary source of population growth continued to be net international migration. For 2025, the level of net international migration was less than half of its level in 2024, falling from 2.7 million to 1.3 million. Natural change, represented as births minus deaths, was up marginally from 514,277 to 518,858 in 2025. The decline in net international migration and stable natural change led to lower population growth nationally between 2024 and 2025.

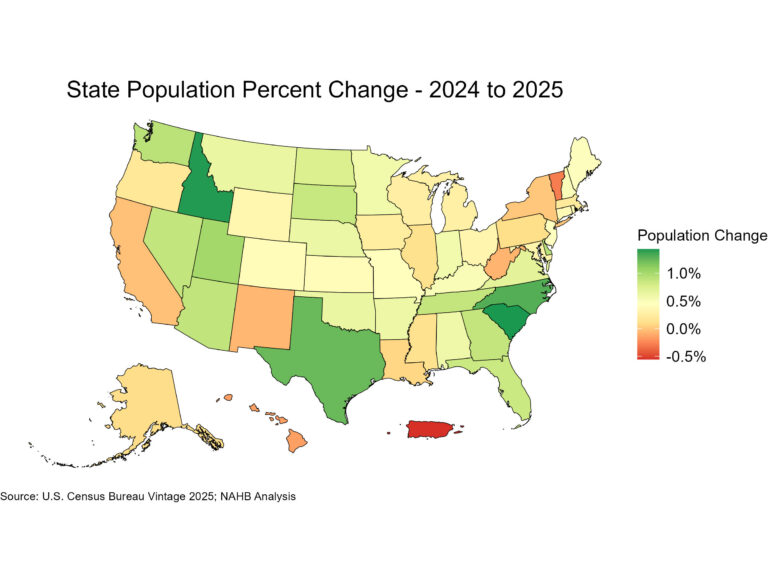
Each region in the U.S. experienced population growth over the period. The South led in population growth at 0.9%, followed by the Midwest at 0.4%. Meanwhile, the West grew 0.3%, while the Northeast grew the least at 0.2%.

At the state level, 45 States and the District of Columbia saw a population increase over the year. South Carolina had the highest population percentage growth, at 1.5%. This was followed by Idaho (1.4%) and North Carolina (1.3%). Numerically, Texas experienced the largest population increase, gaining 391,243. This was followed by Florida at 196,980 and North Carolina at 145,907.

Five states and Puerto Rico experienced population declines. The population of Puerto Rico fell by 0.6%, followed by Vermont at 0.3% and Hawaii at 0.1%. The other states that experienced population declines were West Virgina, New Mexico and California

California remained the most populous state with a population of 39,355,309. The next most populous state was Texas at 31,709,821. To round out the top five states by total population, the proceeding highest were Florida (23,462,518), New York (20,002,427), and Pennsylvania (13,059,432).


This article was originally published by a eyeonhousing.org . Read the Original article here. .


Inflation unexpectedly eased in November, according to the Bureau of Labor Statistics (BLS) latest report. This data release was originally scheduled for December 10 but was delayed due to the recent government shutdown. While most indexes showed deceleration, this report does not necessarily prove a downward trend in inflation due to missing October data and incomplete November collection. December’s report may be more pivotal for markets and the Fed.

The recent record-long government shutdown disrupted data collection for many macroeconomic indicators including the CPI. About two-thirds of price data is collected through personal visits to brick-and-mortar stores, with the remaining third collected online or via telephone. Since the government remained shut down throughout October, BLS cannot retroactively collect survey data for the month. While data collection resumed on November 14 following the November 13 reopening, this month’s report potentially has downward bias due to lower collection rates and holiday sales promotions. This also suggests higher likelihood for monthly volatility in the near term.

Though inflation is expected to peak in the first quarter of 2026, the Fed is likely to continue easing given signs of labor market weakening. The housing market’s sensitivity to interest rates suggests rate cuts could help ease the affordability crisis and support housing supply even as builders continue to face supply-side challenges.

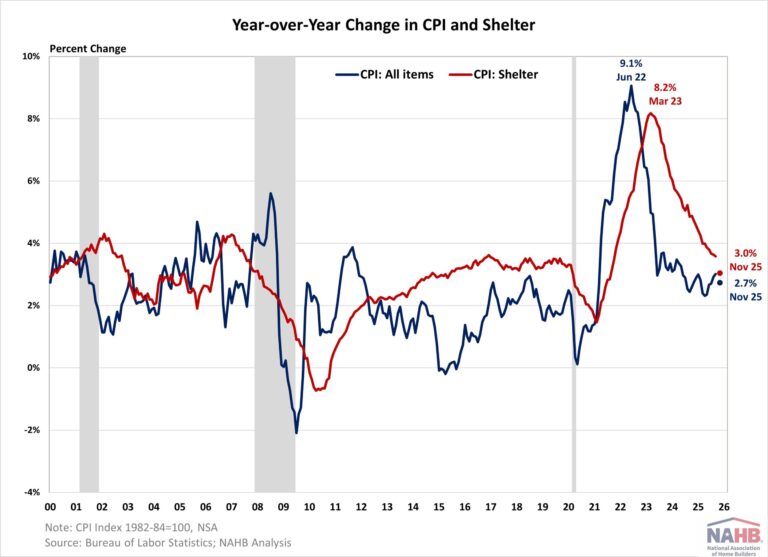
During the past twelve months, on a non-seasonally adjusted basis, the Consumer Price Index (CPI) rose by 2.7% in November. Excluding the volatile food and energy components, the “core” CPI increased by 2.6% over the past twelve months, the lowest reading since April 2021. A large portion of the “core” CPI is the housing shelter index, which increased 3.0% over the year, the lowest reading since August 2021. Meanwhile, the component index of food rose by 2.6%, and the energy component index increased by 4.2%.

Given the notable shift in the November data, especially for the shelter inflation component, the November data are shown with data dot points (red for shelter, blue for overall CPI respectively) in the chart below. The December report will identify whether these data points are confirmed positive trends.

Due to the gap in data collection during the government shutdown, this report covers a two-month period instead of the standard one month. From September to November, the CPI rose by 0.2% (seasonally adjusted), down from a 0.7% increase over the two-month period ending in September. The “core” CPI increased by 0.2% over the two months ending in November, compared to 0.6% in the prior two-month period.

From September to November, the price index for a broad set of energy sources rose by 1.1% and the food index rose by 0.1%. The index for shelter, which makes up more than 40% of the “core” CPI, rose by 0.2% over the two-month period, down from 0.6% in the previous period. Other contributors that increased included indexes for household furnishings and operations, communication, as well as personal care.

NAHB constructs a “real” rent index to indicate whether inflation in rents is faster or slower than core inflation. It provides insight into the supply and demand conditions for rental housing. When inflation in rents is rising faster than core inflation, the real rent index rises and vice versa. The real rent index is calculated by dividing the price index for rent by the core CPI (to exclude the volatile food and energy components).

From September to November, the Real Rent Index remained unchanged over the two-month period. Due to the missing October data, the average monthly growth rate for 2025 cannot be directly compared to prior years.


This article was originally published by a eyeonhousing.org . Read the Original article here. .


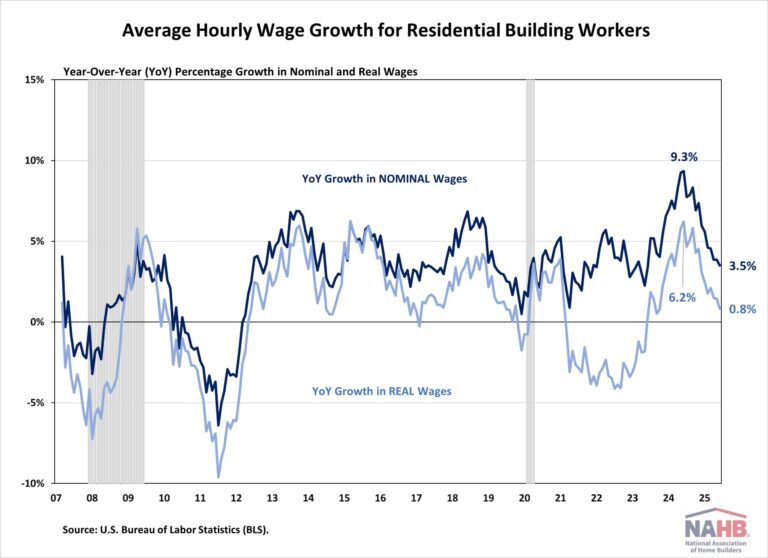
Both real and nominal wage growth for residential building workers slowed during the second quarter of 2025, reflecting a broader cooling in the construction labor market, according to the latest report from the U.S. Bureau of Labor Statistics (BLS).

In nominal terms, average hourly earnings (AHE) for residential building workers rose to $39.35 in June 2025, a 3.5% increase from $38.02 a year ago. This marks a continued deceleration in the year-over-year wage growth, which peaked at 9.3% in June 2024. The recent slowdown reflects a slowdown in residential construction activity and a decline in labor demand across the sector. Meanwhile, the number of open, and unfilled construction sector jobs has continued to trend downward, in line with the overall slowdown in housing activity.

Despite the slowdown in wage growth, residential building workers’ wages remain competitive:

11.4% higher than the manufacturing sector ($35.32/hour)

25.3% higher than the transportation and warehousing sector ($31.4/hour)

2.3% lower than the mining and logging sector ($40.29/hour)

Note:

Data used in this post relate to all employees in the residential building industry. This group includes both new single-family housing construction (excluding for-sale builders) and residential remodelers but does not include specialty trade contractors.

Discover more from Eye On Housing

Subscribe to get the latest posts sent to your email.


This article was originally published by a eyeonhousing.org . Read the Original article here. .


Business sentiment across the home construction and design industry has declined, marking the second consecutive quarter of reduced optimism as business activity wanes, according to the Q3 2025 U.S. Houzz Renovation Barometer. The outlook among firms is significantly lower than it was at the start of the year, although many professionals still expect an improved third-quarter performance.

The recently released Barometer report provides timely insights into the residential renovation industry, including expectations, project backlogs and recent activity among businesses in the construction sector and the architectural and design services sector.

“Expectations have become increasingly cautious among construction and design professionals as they navigate ongoing economic challenges and reduced business activity,” Houzz staff economist Marine Sargsyan says. “That said, stable backlogs and gradual adjustments in response to market conditions indicate some resilience. Most are hopeful for improved momentum through the second half of the year.”


This article was originally published by a www.houzz.com . Read the Original article here. .


Consumer credit continued to rise in early 2025, but the pace of growth has slowed. Student loan balances rose year-over-year as borrowers resumed payments following the end of pandemic-era relief. However, growth remains modest. Credit card and auto loan debt also increased, though both experienced their slowest annual growth rates in years. Despite historically high interest rates, credit card and auto loan rates have begun to ease slightly, providing some relief for consumers facing elevated borrowing costs.

Total outstanding U.S. consumer credit reached $5.01 trillion for the first quarter of 2025, according to the Federal Reserve’s G.19 Consumer Credit Report. This is an increase of 1.53% at a seasonally adjusted annual rate (SAAR) compared to the previous quarter, and a 1.93% increase compared to last year. Both rates have slowed from the previous quarter.

Nonrevolving Credit

Nonrevolving credit, largely driven by student and auto loans (the G.19 report excludes mortgage loans), reached $3.68 trillion (SA) in the first quarter of 2025. This marks a 1.23% increase (SAAR) from the previous quarter, and a 1.56% increase from last year.

Student loan debt balances stood at $1.80 trillion (NSA) for the first quarter of 2025, marking a 2.48% increase from a year ago. The end of the COVID-19 Emergency Relief—which allowed 0% interest and halted payments until September 1, 2023—led year-over-year growth to decline for four consecutive quarters, from Q3 2023 through Q2 2024, as borrowers resumed payments and took on less new debt. While the past three quarters have shown a return to growth, the current pace of growth remains below pre-pandemic levels.

Auto loans reached a level of $1.56 trillion (NSA), showing a year-over-year increase of only 0.26%, marking the slowest growth rate since 2010. The deceleration in growth can be attributed to several factors, including stricter lending standards, elevated interest rates, and overall inflation. Auto loan rates for a 60-month new car stood at 8.04% (NSA) for the first quarter of 2025, a historically elevated level. However, auto rates have slowed modestly, decreasing by 0.18 percentage points compared to a year ago.

Revolving Credit

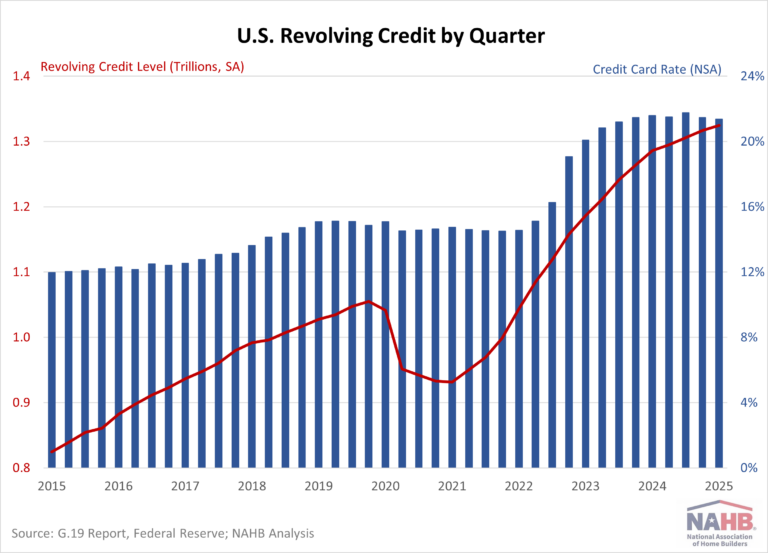
Revolving credit, primarily made up of credit card debt, rose to $1.32 trillion (SA) in the first quarter of 2025. This represents a 2.36% increase (SAAR) from the previous quarter and a 2.98% increase year-over-year. Both measures reflect a notable slowdown, marking the weakest growth in revolving credit in several years. This deceleration comes as credit card interest rates remain elevated, with the average rate held by commercial banks (NSA) at 21.37%. Although rates have hovered near historic highs since Q4 2022, the past two quarters have shown modest year-over-year declines, reflecting the impact of rate cuts that began in 2024.

Discover more from Eye On Housing

Subscribe to get the latest posts sent to your email.


This article was originally published by a eyeonhousing.org . Read the Original article here. .

Wage growth for residential building workers continued to slow in March 2025, reflecting softening in the construction labor market, according to the latest report from the U.S. Bureau of Labor Statistics (BLS).

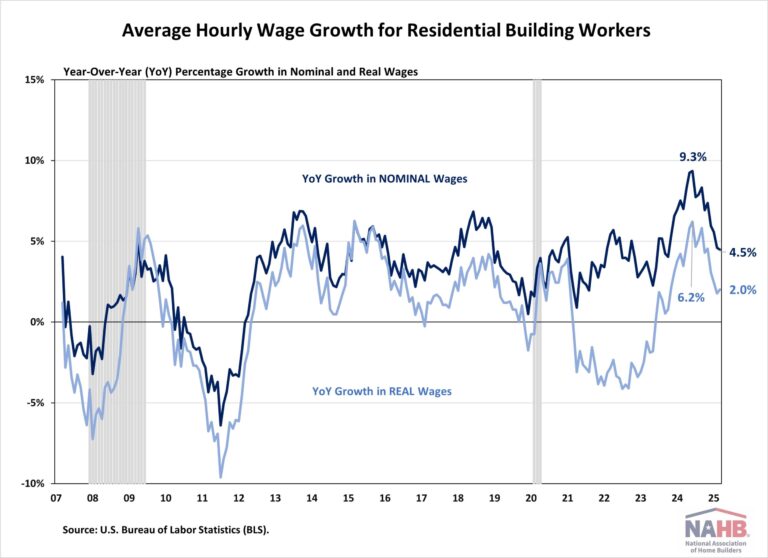
On a nominal basis, average hourly earnings (AHE) for residential building workers reached $38.76 in March 2025, up 4.5% from $37.10 a year ago. This marks a continued deceleration in the year-over-year wage growth, which peaked at 9.3% in June 2024. The recent slowdown reflects an easing of pandemic-related labor shortages and a softening labor demand in the construction sector. In March, the construction labor market saw a decline in job openings as employers slowed hiring plans amid ongoing economic uncertainty.

Despite the slowdown in wage growth, residential building workers’ wages remain competitive:

10.2% higher than the manufacturing sector ($35.17/hour)

24.0% higher than the transportation and warehousing sector ($31.25/hour)

3.7% lower than the mining and logging sector ($40.23/hour)

Note:

Data used in this post relate to all employees in the residential building industry. This group includes both new single-family housing construction (excluding for-sale builders) and residential remodelers but does not include specialty trade contractors.

Discover more from Eye On Housing

Subscribe to get the latest posts sent to your email.


This article was originally published by a eyeonhousing.org . Read the Original article here. .
Pin It