Tag

Slightly

Browsing


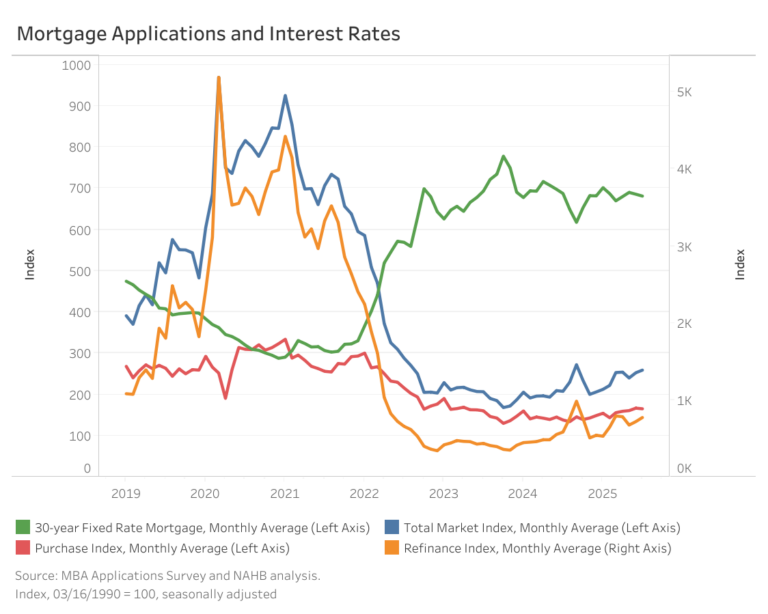
Mortgage application activity picked up in July as interest rates eased modestly. The Mortgage Bankers Association’s (MBA) Market Composite Index, which tracks mortgage application volume, rose 2.4% from June on a seasonally adjusted basis. Compared to July 2024, total applications were up 24.5%.

The average contract rate for 30-year fixed mortgages edged down by 4 basis points to 6.8%. While refinancing increased by 7.4%, purchase applications slipped 1.2% as high home prices and mortgage rates continued to keep homebuyers on the sideline. Year-over-year, the 30-year rate was 6 basis points lower, with purchase and refinance applications up 19.6% and 32.2%, respectively.

Loan sizes continued to trend downward for the third consecutive month. The average loan amount across all loan types declined 1.7% to $376,500. Purchase loan sizes fell 2.5% to $428,800, while refinance loans increased 3.0% to $299,300. Adjustable-rate mortgage (ARM) loan sizes saw the largest decline among all loan types, falling 6.6% to $957,500 from $1.03 million.   

Discover more from Eye On Housing

Subscribe to get the latest posts sent to your email.


This article was originally published by a eyeonhousing.org . Read the Original article here. .


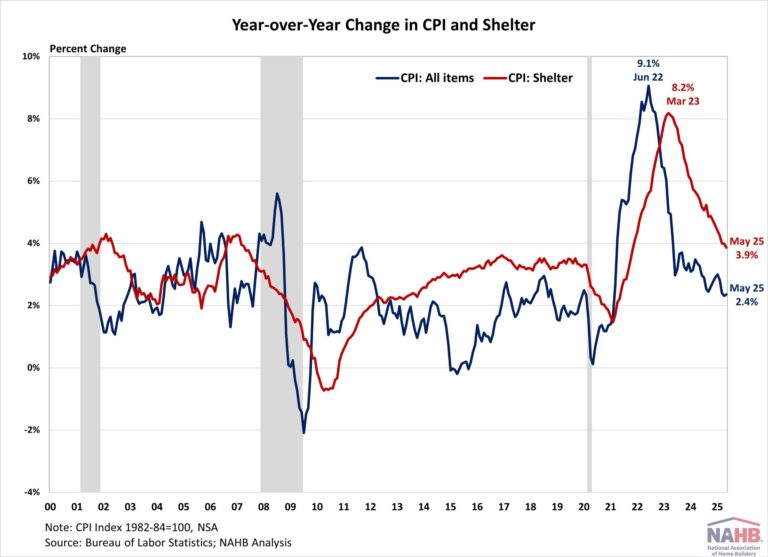
Despite inflationary pressure from tariffs, inflation in May rose slightly but came in softer than expected. The Consumer Price Index increased from 2.3% in April to 2.4% in May year-over-year, according to the Bureau of Labor Statistics’ report. While this report reflected consumer prices after Liberation Day, it showed little sign of tariff impact as most reciprocal tariffs were paused for 90 days and many businesses had frontloaded imports ahead of tariffs. This preemptive action contributed a drag on the first quarter GDP growth.

Additionally, the Bureau of Labor Statistics reduced its CPI collection sample starting in April due to staffing shortages, raising potential data quality concerns. Given these factors, it may be too early to gauge the impact of tariffs, as tariff-driven price increases have not yet materialized. Meanwhile, housing inflation remains elevated, though it continues to ease gradually.

During the past twelve months, on a non-seasonally adjusted basis, the Consumer Price Index rose by 2.4% in May. Excluding the volatile food and energy components, the “core” CPI increased by 2.8% over the past twelve months. A large portion of the “core” CPI is the housing shelter index, which increased 3.9% over the year, the lowest reading since November 2021.  Meanwhile, the component index of food rose by 2.9%, and the energy component index fell by 3.5%.

On a monthly basis, the CPI rose by 0.1% in May (seasonally adjusted), after a 0.2% increase in April. The “core” CPI increased by 0.1% in May.

The price index for a broad set of energy sources fell by 1.0% in May, with increases in electricity (0.9%) and fuel oil (0.9%) offset by declines in gasoline (-2.6%) and natural gas (-1.0%). Meanwhile, the food index rose by 0.3%, after a 0.1% decrease in April. Both food away from home and food at home increased by 0.3%.

The index for shelter (+0.3%) was the largest contributor to the monthly increase in all items index. Other top contributors that rose in May include indexes for medical care (+0.3%), motor vehicle insurance (+0.7%), household furnishings and operations (+0.3%), personal care (+0.5%), as well as education (+0.3%). Meanwhile, the index for airline fares (-2.7%) and used cars and trucks (-0.5%) were among the few major indexes that decreased over the month.

The index for shelter makes up more than 40% of the “core” CPI, rising by 0.3% in May, following an increase of 0.3% in April. The index for owners’ equivalent rent (OER) rose by 0.3% and index for rent of primary residence (RPR) increased by 0.2% over the month. Despite the moderation, shelter costs remained the largest contributors to headline inflation. 

While the Fed rate cuts could ease some housing market pressure, its ability to address rising housing costs is limited, as these increases are driven by a lack of affordable supply and increasing development costs. Tight monetary policy actually hurts housing supply by increasing AD&C financing cost. This can be seen on the graph below, as shelter costs continued rising despite Fed policy tightening in 2022. Additional housing supply is the primary solution to tame housing inflation and overall inflation. This emphasizes why the cost of construction, including the cost of building materials, matters not just for housing but also the inflation outlook and the path of future monetary policy.

NAHB constructs a “real” rent index to indicate whether inflation in rents is faster or slower than core inflation. It provides insight into the supply and demand conditions for rental housing. When inflation in rents is rising faster than core inflation, the real rent index rises and vice versa. The real rent index is calculated by dividing the price index for rent by the core CPI (to exclude the volatile food and energy components).

In May, the Real Rent Index rose by 0.1%. Over the first five months of 2025, the average monthly growth rate held steady at 0.1%, unchanged from the same period in 2024.

Discover more from Eye On Housing

Subscribe to get the latest posts sent to your email.


This article was originally published by a eyeonhousing.org . Read the Original article here. .


The U.S. job market slowed slightly in April, with notable downward revisions to February and March figures. The unemployment rate held steady at 4.2%. The labor market remains resilient despite growing economic uncertainty, though early signs of softening are beginning to emerge.

In April, wage growth remained unchanged. Year-over-year, wages grew at a 3.8% rate. Wage growth has been outpacing inflation for nearly two years, which typically occurs as productivity increases.

National Employment

According to the Employment Situation Summary reported by the Bureau of Labor Statistics (BLS), total nonfarm payroll employment rose by 177,000 in April, following a downwardly revised increase of 185,000 jobs in March. Since January 2021, the U.S. job market has added jobs for 52 consecutive months, making it the third-longest period of employment expansion on record. Monthly employment growth has averaged 144,000 per month in 2025, compared with the 168,000 monthly average gain for 2024.

The estimates for the previous two months were revised down. The monthly change in total nonfarm payroll employment for February was revised down by 15,000 from +117,000 to +102,000, while the change for March was revised down by 43,000 from +228,000 to +185,000. Combined, the revisions were 58,000 lower than previously reported.

The unemployment rate remained unchanged at 4.2% in April. While the number of employed persons increased by 436,000, the number of unemployed persons increased by 82,000.

Meanwhile, the labor force participation rate—the proportion of the population either looking for a job or already holding a job—rose one percentage point to 62.6%. Among individuals aged 25 to 54, the participation rate rose three percentage points to 83.6%, marking the highest rate since September 2024. Despite these gains, the overall labor force participation rate remains below its pre-pandemic levels of 63.3% at the beginning of 2020. Additionally, the rate for the prime working-age group (25 to 54) has been trending downward since peaking at 83.9% last summer.

In April, industries like health care (+51,000), transportation and warehousing (+29,000), and financial activities (+14,000) continued to see gains. Meanwhile, federal government employment lost 9,000 jobs in April and has shed 26,000 since January 2025, reflecting the effects of government cutbacks. The BLS notes that “employees on paid leave or receiving ongoing severance pay are counted as employed in the establishment survey.”

Construction Employment

Employment in the overall construction sector increased by 11,000 in April, following a downwardly revised gain of 7,000 in March. While residential construction gained 3,400 jobs, non-residential construction employment added 8,000 jobs for the month.

Residential construction employment now stands at 3.3 million in April, broken down as 956,000 builders and 2.4 million residential specialty trade contractors. The six-month moving average of job gains for residential construction was -1,583 a month, mainly reflecting the three months’ job loss over the past six months (October 2024, January 2025, and March 2025). Over the last 12 months, home builders and remodelers added 5,000 jobs on a net basis. Since the low point following the Great Recession, residential construction has gained 1,367,000 positions.

In April, the unemployment rate for construction workers rose to 5.2% on a seasonally adjusted basis. The unemployment rate for construction workers has remained at a relatively lower level, after reaching 15.3% in April 2020 due to the housing demand impact of the COVID-19 pandemic.

Discover more from Eye On Housing

Subscribe to get the latest posts sent to your email.


This article was originally published by a eyeonhousing.org . Read the Original article here. .


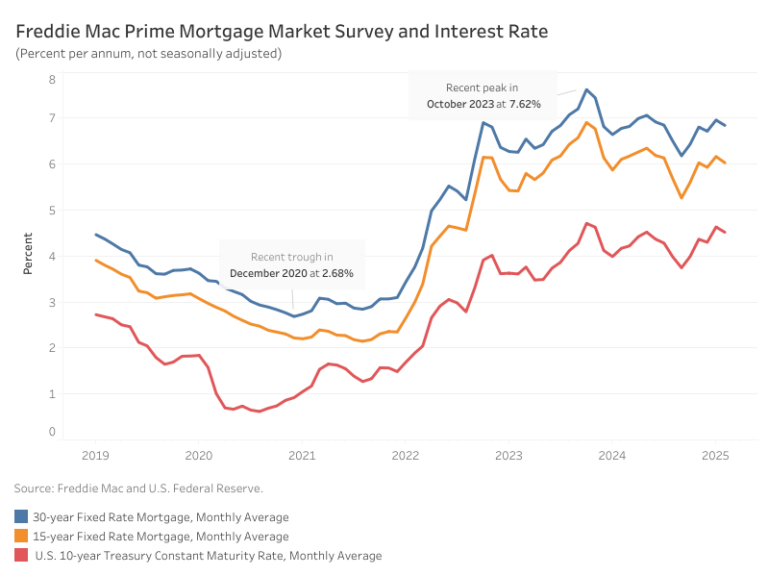
Mortgage rates declined marginally in February, with the average 30-year fixed-rate mortgage falling to 6.84%. After climbing steadily since December and peaking at 7.04% in mid-January, rates have been trending downward.

According to Freddie Mac, the average rate for a 30-year fixed-rate mortgage decreased 12 basis points (bps) from January, while the 15-year fixed-rate mortgage fell 13 bps to 6.03%. Although the recent decline in mortgage rates and an increase in the total single-family homes supply are positive signs for buyers, homebuying activity may remain sluggish due to persistent high prices and mortgage rates still exceeding 6%.

The 10-year Treasury yield declined 11 bps to an average of 4.52% in February, reversing its recent upward trend. This shift reflects concerns over a weakening U.S. economy due to inflationary pressures and increasing geopolitical risks. In response, the markets anticipate that the Federal Reserve will resume rate cuts later in the year.

Discover more from Eye On Housing

Subscribe to get the latest posts sent to your email.


This article was originally published by a eyeonhousing.org . Read the Original article here. .

Pin It