Tag

Slight

Browsing


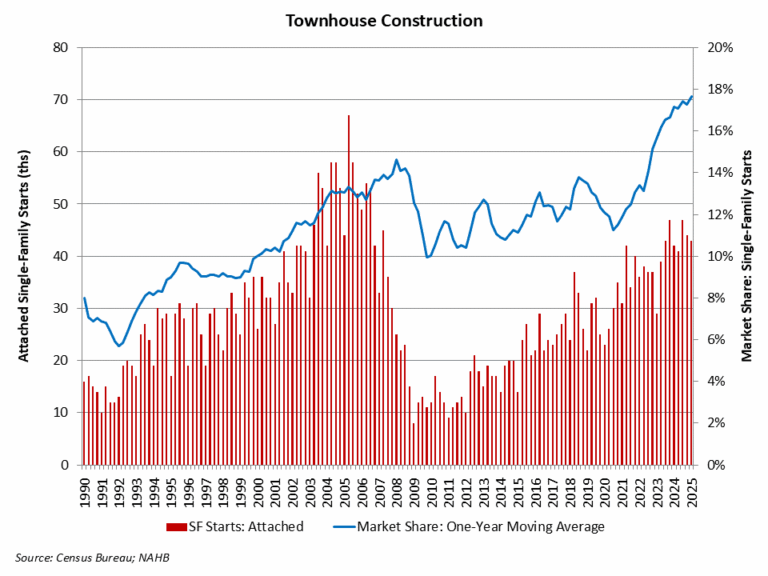
Townhouse construction expanded more than 2 percent on a year-over-year basis per data from the first quarter of 2025.

According to NAHB analysis of the most recent Census data of Starts and Completions by Purpose and Design, during the first quarter of 2025, single-family attached starts totaled 43,000. Over the last four quarters, townhouse construction starts totaled a strong 175,000 homes, which is 2% higher than the prior four-quarter period (171,000). Townhouses made up 19% of single-family housing starts for the first quarter of the year, near a data series high.

Using a one-year moving average, the market share of newly-built townhouses stood at 17.6% of all single-family starts for the first quarter. With recent gains, the four-quarter moving average market share is the highest on record, for data going back to 1985.

Prior to the current cycle, the peak market share of the last two decades for townhouse construction was set during the first quarter of 2008, when the percentage reached 14.6% on a one-year moving average basis. This high point was set after a fairly consistent increase in the share beginning in the early 1990s.

The long-run prospects for townhouse construction are positive given growing numbers of homebuyers looking for medium-density residential neighborhoods, such as urban villages that offer walkable environments and other amenities. Where it can be zoned, it can be built.

Discover more from Eye On Housing

Subscribe to get the latest posts sent to your email.


This article was originally published by a eyeonhousing.org . Read the Original article here. .

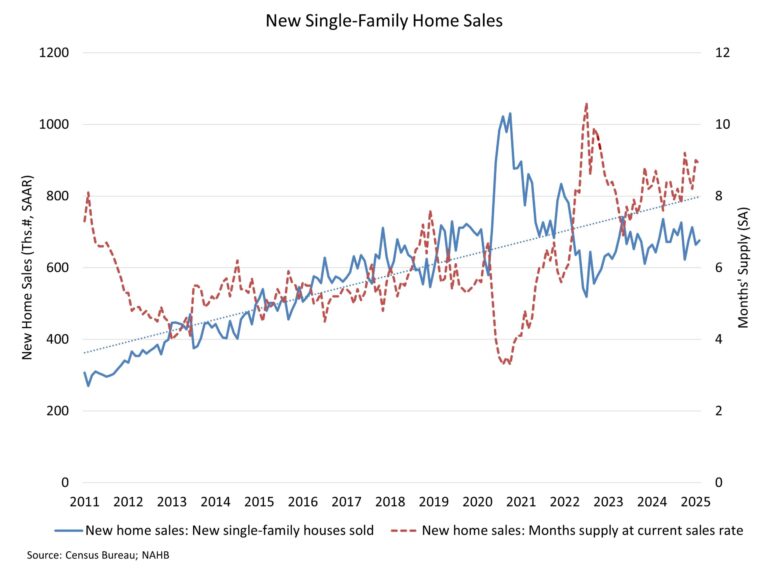
A slight decline in mortgage rates and limited existing inventory helped new home sales to edge higher in February even as housing affordability challenges continue to act as a strong headwind on the market.

Sales of newly built, single-family homes in February increased 1.8% to a 676,000 seasonally adjusted annual rate from a revised January number, according to newly released data from the U.S. Department of Housing and Urban Development and the U.S. Census Bureau. The pace of new home sales in February was up 5.1% compared to a year earlier.

New home sales have been roughly flat thus far in 2025, as ongoing limited inventory of existing homes in many markets continues to support the need for new homes. Lower mortgage rates helped to lift demand in February, despite other near-term risks such as tariff issues and affordability concerns.

A new home sale occurs when a sales contract is signed, or a deposit is accepted. The home can be in any stage of construction: not yet started, under construction or completed. In addition to adjusting for seasonal effects, the February reading of 676,000 units is the number of homes that would sell if this pace continued for the next 12 months.

New single-family home inventory in February continued to rise to a level of 500,000, up 7.5% compared to a year earlier. This represents an 8.9 months’ supply at the current building pace. The count of completed, ready-to-occupy homes available for sale increased again, rising to 119,000, up 35% from a year ago and marking the highest count since mid-2009. 

However, after accounting for a low 3.4 months’ supply for the existing single-family market, total market inventory (new and existing homes) stands at a lean 4.2 months’ supply per NAHB estimates. A balanced market is typically defined as a 6 month’s supply.

The median new home sale price in February was $414,500, down 1.5% from a year ago. The count of sales was supported by a gain of transactions priced between $300,000 and $400,000 in February.

Regionally, on a year-to-date basis, new home sales are up 12.4% in the South but down 6.7% in the West, 13.5% in the Midwest and 50.8% in the Northeast.

Discover more from Eye On Housing

Subscribe to get the latest posts sent to your email.


This article was originally published by a eyeonhousing.org . Read the Original article here. .
Pin It