Tag

SingleFamily

Browsing


Vinyl siding was the most used principle exterior wall material for homes started construction in 2025. This material held just over a quarter share of homes, surpassing stucco for the second time since 2018. The declining share for stucco reflected the slowdown for home building in parts of the Sun Belt.

For homes started in 2025, 27.7% had vinyl siding as the principal exterior wall material. Vinyl siding was followed closely by stucco at 24.1%, and by fiber cement siding (such as Hardiplank or Hardiboard) at 22.6%. Each of these materials held about a quarter share of the market, with another sliver held by brick or brick veneer at 16.8%. Far smaller shares of single-family homes started last year had wood or wood products (5.9%) as the principal exterior wall material, while all other materials had a less than 2% share.

As shown in the graph above, while vinyl has historically held a much larger share, at a high of almost 40% in 2001, the share fell rapidly between 2010 to 2015 by over 10 percentage points. However, this share has remained fairly steady since, at around 25%. Meanwhile, stucco rose rapidly from 17% in 2010 until recently peaking at 28% in 2021.  

However, the strongest trend has been the growing popularity in fiber cement siding, growing in share by almost 20 percentage points in the past 25 years. Also notable is the decline of brick siding, from almost a quarter of homes in 2012, to just under 17% in 2025.

As shown in the dashboard above, exterior material preferences varied by both home size and price. Vinyl siding had the largest market share among smaller homes (under 2,000 square feet), while fiber cement was most common in larger homes (3,000 square feet or more). Stucco was widely used across all home sizes but was most prevalent in midsized homes (2,000–2,999 square feet).

A majority of homes started in 2025 were priced between $250,000-$499,000, where vinyl was most prevalent. Meanwhile, stucco was the most common material in home priced above $500,000.  Interestingly, although brick siding was most common in lower-priced homes, it also had a relatively high market share among larger homes. This apparent contradiction highlights the most important factor influencing exterior material choices: geography.

Climate, regional building practices, material availability, and architectural styles create substantial differences in siding preferences across the country. In 2025, brick or brick veneer was the most common exterior siding material in the West South Central division at 54%. As the South tends to build larger and more affordable homes, this helps explain why brick siding is associated with both larger and lower-priced homes. 

In 2025, vinyl siding was the most widely used primary exterior material in five out of nine census divisions. Vinylsidingwas used on 73% of the new homes started in the Middle Atlantic, 72% in New England, 71% in the East North Central, 47% in the West North Central and the East South Central at 39%. Notably, this was the first time since 2020 that vinyl siding surpassed brick siding in the East South Central division.

Stucco was the most used primary exterior wall material in the Pacific and South Atlantic divisions in 2025, at 65% and 33% of the new single-family homes started in those areas. Fiber Cement siding slightly surpassed stucco this year in the Mountain division with a 42% market share for the first time based on data available back to 2000.

The highest market share for wood exterior siding was in the West North Central division at 23% of homes started in 2025. Meanwhile, stone, concrete block, and other siding materials held similary small shares across all divisions.


This article was originally published by a eyeonhousing.org . Read the Original article here. .


Strong multifamily growth pushed overall housing starts higher in June, while single-family production remained sluggish as elevated mortgage rates, rising construction costs and persistent labor shortages continued to weigh on the market.

Overall housing starts increased 19.0% in June to a seasonally adjusted annual rate of 1.43 million units, according to a report from the U.S. Department of Housing and Urban Development (HUD) and the U.S. Census Bureau. This pace reflects the number of housing units builders would begin over the next 12 months if June’s activity were sustained.

Within the total, single-family starts decreased 0.2% to an 895,000 seasonally adjusted annual rate and were down 3.2% compared to June 2025. On a year-to-date basis, single-family starts are down 5.3%. Given recent volatility, the three-month moving average provides a clearer signal, falling to 902,000 units.

Multifamily starts, which include apartment buildings and condominiums, rose 76.2% from May to June to an annualized 532,000 pace. The three-month moving average for multifamily construction has trended higher to 445,000 units, and activity is 17.2% higher compared to year-earlier levels.

Regionally, on a year-to-date basis, combined single-family and multifamily starts were 4.5% higher in the Northeast, 1.7% higher in the South, 1.2% higher in the Midwest, and 4.4% lower in the West. Single-family starts were down in all four regions.

The total number of housing units under construction stood at 1.26 million in June, down 6.2% from a year earlier. Single-family homes under construction stood at 582,000 units, a 6.9% year-over-year decline. Multifamily units under construction slowed down to 682,000, down from peaks above 1 million units in December 2023 and 5.7% lower than a year ago.

Completions of single-family homes have improved to an annual rate of about 964,000 units. This marks a 5.5% increase from a year earlier. However, multifamily completions for buildings with five or more units were down 5.1% year over year to a 413,000-unit pace. On a year-to-date basis, total completions across both sectors are down 9.5% reflecting ongoing challenges in the residential construction sector.

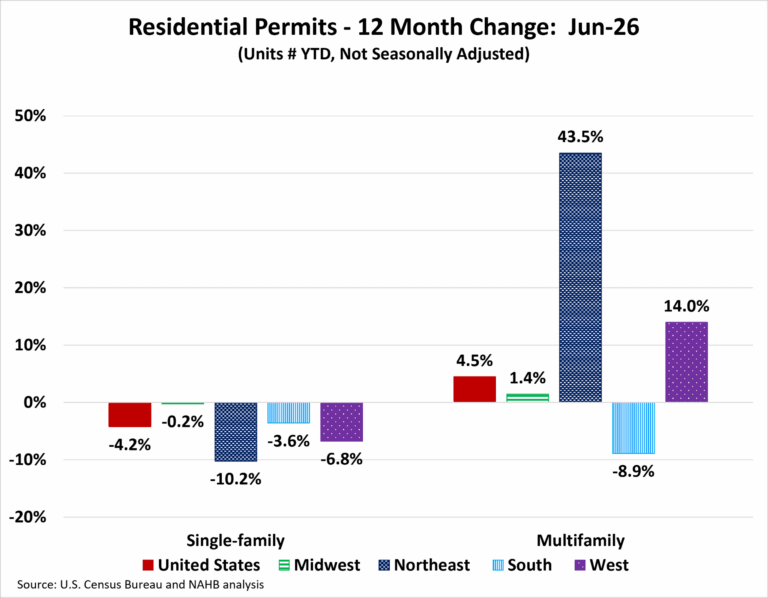
Overall permits declined 3.0% to a 1.37-million-unit annualized rate in June. Single-family permits decreased 2.4% to an 871,000-unit rate and are essentially flat compared to June 2025. Multifamily permits are down 4.2% to an annualized 496,000 pace and are down 5.7% compared to June 2025. Looking at regional permit data on a year-to-date basis, total permits were 15.2% higher in the Northeast, 1.4% higher in the Midwest, 0.7% higher in the West, but 6.3% lower in the South. For single-family permits, the Midwest was the only region to post an increase, rising 1.3% reflecting the residential construction strength in the region.


This article was originally published by a eyeonhousing.org . Read the Original article here. .


State-level permitting activity continued to reflect a divided housing market through the first five months of 2026. Elevated mortgage rates and ongoing affordability challenges continued to weigh on single-family construction across much of the country, while multifamily permitting remained comparatively stronger, supported by gains in several regions despite continued weakness in parts of the South.

Over the first five months of the year, the number of single-family permits issued nationwide reached 380,130. Compared with the same period in 2025, this represents a 6.1 percent decline compared with the May 2025 total of 404,977. In contrast, multifamily permitting activity remained stronger, with 208,192 permits issued nationwide, marking a 6.5 percent increase from the same period last year.

Regionally, year-to-date single-family permitting declined in all four regions through May. The Midwest was essentially flat, while the South declined 5.3 percent, the West fell 9.4 percent, and the Northeast posted the largest decline, down 12.2 percent. Multifamily permits increased in three of the four regions, led by the Northeast (up 32.9 percent), followed by the West (up 18.3 percent) and the Midwest (up 5.0 percent). The South was the only region to post a decline, with multifamily permits falling 5.7 percent, driven largely by reduced permitting activity in major metropolitan areas across the region.

At the state level, ten states and the District of Columbia recorded year-over-year increases in single-family permits through May, with gains ranging from 54.5 percent in the District of Columbia to 0.2 percent in Connecticut. The remaining 39 states posted declines, led by Nevada, which recorded the steepest drop at 28.5 percent. Kentucky reported no change.

The ten states issuing the highest number of single-family permits accounted for 62.8 percent of all single-family permits issued nationwide. Texas led the nation with 61,157 permits issued through May 2026, although this represented a 7.4 percent decline from the same period in 2025. Florida, the second-highest state, recorded a 5.5 percent decline, while North Carolina, ranking third, posted a 9.5 percent decrease.

Between May 2026 and May 2025, 33 states and the District of Columbia recorded increases in multifamily building permits, while 17 states experienced declines. Rhode Island posted the largest percentage increase, with multifamily permits rising 158.6 percent, from 251 to 649 units. In contrast, Nevada recorded the steepest decline, with permits falling 77.6 percent, from 3,702 to 828 units.

The ten states issuing the highest number of multifamily permits accounted for 62.6 percent of all multifamily permits issued nationwide. Through the first five months of 2026, California, which issued the largest number of multifamily permits, posted a 47.9 percent increase compared with the same period last year. Texas, the second-highest state, recorded a 23.3 percent decline, while Florida, ranking third, saw multifamily permits decrease by 37.4 percent.

At the local level, the following are the ten metropolitan areas with the highest number of single-family permits issued.

Below are the ten metropolitan areas with the highest levels of multifamily permitting activity. It is worth noting that the largest multifamily markets continue to show declines. Gains for multifamily permitting are occurring in smaller markets and for smaller builders.


This article was originally published by a eyeonhousing.org . Read the Original article here. .


Persistently high mortgage rates, elevated costs for builders, and ongoing supply-side constraints continued to weigh on single-family construction in 2025. According to the NAHB analysis of the 2025 Survey of Construction (SOC), a total of 939,182 new single-family units started construction nationwide. This represents a 6.9% decline compared to 2024.

Among the nine Census divisions, the South Atlantic division continued to lead the nation with 308,189 starts in 2025, representing about one-third of all new single-family starts. The second highest was the West South Central division at 171,247 starts, followed by the Mountain division with 106,549 starts and the Pacific division with 95,940 starts. Collectively, the South Atlantic, West South Central, and Mountain divisions accounted for roughly 62% of total new single-family housing starts in 2025.

The East North Central division recorded 87,589 new single-family starts in 2025, followed by the East South Central division with 62,674 starts and the West North Central division with 44,996 starts. The Middle Atlantic division posted 42,328 starts, while New England remained the smallest division by volume, with 19,670 new single-family starts.

Regional performance varied considerably in 2025. Only three of the nine Census divisions posted year-over-year growth in single-family starts. The East South Central division recorded the strongest annual gain, rising 13.7%, followed by the East North Central division at 8.0% and the Middle Atlantic division at 4.0%.

In contrast, the remaining six divisions experienced declines. New England recorded the steepest drop, with starts falling 26.3% from the previous year. The Mountain and South Atlantic divisions, both of which posted gains in 2024, reversed course in 2025, declining 15.4% and 10.5%, respectively. Single-family starts also decreased 8.8% in the West South Central division, 7.5% in the West North Central division, and 3.3% in the Pacific division.

Overall, the 2025 SOC data points to a more uneven regional housing market than in 2024. While parts of the Midwest and the Middle Atlantic region continued to expand, declines in the nation’s largest home building regions, particularly the South Atlantic, Mountain, and West South Central divisions, more than offset those gains, driving the national decline in single-family housing starts.


This article was originally published by a eyeonhousing.org . Read the Original article here. .


Through April 2026, residential construction activity remained uneven across housing sectors. Single-family permitting continued to soften compared with a year ago, reflecting persistent affordability challenges and elevated borrowing costs, while multifamily permitting posted solid gains supported by stronger activity in several regions. Regional and state-level permit data reveal notable differences in housing market conditions across the country.

Over the first four months of the year, the number of single-family permits issued nationwide reached 299,642. On a year-over-year basis, this represents a 6.4 percent decline compared with the April 2025 total of 320,259. On the other hand, multifamily permitting activity was stronger, with 166,252 permits issued nationwide, marking a 7.5 percent increase from the same period last year.

Regionally, year-to-date single-family permitting declined in all four regions through April. The Midwest was essentially flat, the South declined by 6.3 percent, the West dropped 8.3 percent, and the Northeast fell 13.8 percent. Multifamily permits increased in three of the four regions, led by gains in the Northeast (up 33.5 percent), followed by the West (up 20.0 percent), and the Midwest (up 19.3 percent). The South saw an 8.4 percent decline, driven largely by reductions in large metro areas across Southern states.

At the state level, 13 states and the District of Columbia recorded year-over-year increases in single-family permits in April, with gains ranging from 28.0 percent in the District of Columbia to 0.6 percent in Nebraska and Minnesota. The remaining 37 states reported declines, led by Hawaii, which posted the steepest drop at 27.1 percent.

The ten states issuing the highest number of single-family permits accounted for 63.1 percent of all single-family permits issued nationwide. Texas led the country with 48,328 permits issued at the end of April 2026, although this represented an 8.2 percent decline compared with April 2025. Florida, the second-highest state, saw permits fall by 6.3 percent, while North Carolina, ranked third, experienced a decline of 12.6 percent.

Between April 2026 and April 2025, 34 states recorded increases in multifamily building permits, while 16 states and the District of Columbia experienced declines. Rhode Island posted the largest percentage increase, with multifamily permits surging 250.6 percent, rising from 170 to 596 units. In contrast, Nevada recorded the steepest decline, with permits falling 78.5 percent, from 3,426 to 738 units.

The ten states issuing the highest number of multifamily permits accounted for 61.3 percent of all multifamily permits issued nationwide. Over the first four months of 2026, California, which issued the most multifamily permits, recorded a substantial increase of 57.0 percent. Texas, the second-highest state, posted a decline of 20.6 percent, while Florida, ranking third, saw multifamily permits fall by 41.3 percent.

At the local level, the following are the ten metropolitan areas with the highest number of single-family permits issued.

Below are the ten metropolitan areas with the highest levels of multifamily permitting activity.


This article was originally published by a eyeonhousing.org . Read the Original article here. .


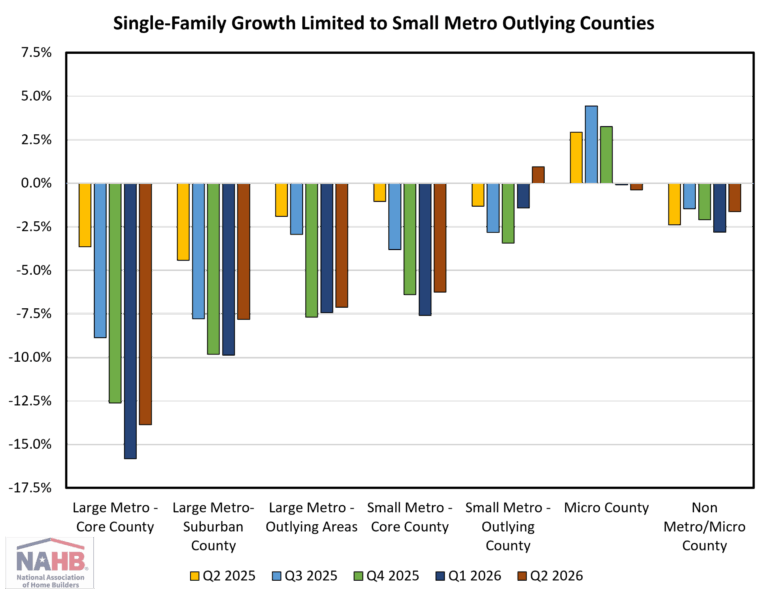
Single-family construction declined across all geographies in the first quarter of 2026, according to the latest Home Building Geography Index (HBGI), as elevated interest rates, rising material costs, and labor shortages slowed home building activities at the start of the year. Meanwhile, multifamily construction remained broadly resilient, posting growth in most markets.

Single-Family

The pullback in single-family activity was sharpest in large metro core counties, which recorded a 16.0% year-over-year decline on a four-quarter moving average (4QMA) basis — a deterioration of 3.2 percentage points from the prior quarter. More broadly, single-family construction in non-rural areas, which are counties within a metro area, fell 9.2%.

These declines are part of a longer-term structural shift away from dense population centers. Large metro core counties have shed an average of 0.1 percentage points of single-family market share every quarter for the past decade, with the pace accelerating after the pandemic. In Q1 2026, large metro cores accounted for just 14.7% of single-family permits — down 1.3 percentage points from a year earlier and 4.1 percentage points below their Q1 2016 share. Large metro suburban counties have similarly lost 3.3 percentage points of market share over the past decade.

The gains have flowed to smaller and outlying markets. Outlying counties in small metros recorded the largest increase, gaining almost two percentage points compared to a decade ago and 0.7 percentage points relative to Q1 2025 to capture 10.8% market share.

Multifamily

Multifamily construction told a different story in Q1 2026, expanding across most geographies. Large metro core counties led the way with 20.8% growth (4QMA), picking up pace after returning to positive territory in the prior quarter. Construction in non-rural counties grew 10.5% overall.

Markets with negative growth were large metro outlying counties, which fell 24.6%, and micro counties, which edged down 0.6%. Both had posted consistent growth throughout 2025 and appear to be normalizing. Rural counties, in general, saw multifamily growth slow sharply, from 11.4% in the previous quarter to just 1.8%.

On the market share front, large metro core had the largest multifamily share increase by 3.2 percentage points to 36.5%. Meanwhile, large metro outlying counties saw the largest decline, dropping 1.6 percentage points over the year to 3.1%.

Over a longer horizon, multifamily market share has migrated slowly but steadily from large metro core counties to smaller metro core counties, with the former losing 8.6 percentage points and the latter gaining 5.1 percentage points over the past decade. However, since last year, large metro core counties have steadily regained market share as demand for rental housing remains strong.

The first quarter of 2026 HBGI data along with an interactive HBGI map can be found at https://nahb.org/hbgi.


This article was originally published by a eyeonhousing.org . Read the Original article here. .


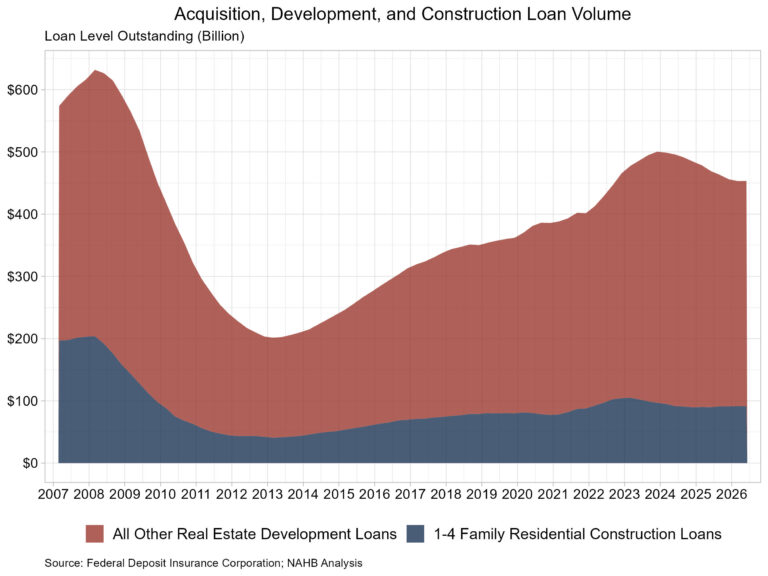
Single-family construction lending rose marginally in the first quarter, according to data released by the Federal Deposit Insurance Corporation. The volume of loans outstanding was up 0.8% from the fourth quarter. This increase comes at a time when NAHB’s AD&C Financing Survey indicates a slight tightening in credit conditions in the first quarter. The total volume of outstanding AD&C loans, which includes both nonresidential and residential construction loans, fell for the ninth consecutive quarter.

In the first quarter of 2026, the total level of outstanding AD&C loans fell to $453.3 billion, down 0.6% from the fourth quarter. The quarterly decline was led by a drop in other real estate development loans, which declined 1.8% to $361.5 billion. Meanwhile, the volume of 1-4 family residential construction and land development loans rose to $91.8 billion in the first quarter, up 0.8% from a quarter earlier. The volume of 1-4 family residential was up 1.9% from last year. This marked the third straight quarter showing a year-over-year increase.

It is worth noting that the FDIC data represents only the stock of loans, not changes in the underlying flows, so it is an imperfect data source. Nonetheless, lending remains much reduced compared with years past. The current amount of existing 1-4 family residential AD&C loans now stands 56% lower than the peak level of residential construction lending of $204 billion reached during the first quarter of 2008. Alternative sources of financing, including equity partners, have supplemented this capital market in recent years.

Quality Metrics of Construction Loans

The volume of loans that are 30+ days past due or nonaccrual status rose in the first quarter, to $989.8 million. As a share of the total 1-4 family residential construction loan volume, this accounts for 1.1%.

Breaking this out further, the level of loans 30-89 days past due was $451.3 million, while the volume in nonaccrual status was $495.2 million. The nonaccrual loan volume fell from $522.1 million in the fourth quarter, and the 30-89 past due volume rose from $414.2 million.

Loans are classified as nonaccrual when one or more of the following conditions apply: the loan is 90 days or more past due on principal or interest (unless it is well-secured and in the process of collection); the bank no longer expects full repayment of principal and interest; or the borrower’s financial condition has significantly deteriorated, warranting cash-basis accounting.


This article was originally published by a eyeonhousing.org . Read the Original article here. .


Single-family built-for-rent (or built-to-rent, BTR) construction fell back in the first quarter of 2026, as a higher cost of financing, increased multifamily supply and policy concerns over Congressional legislation related to institutional capital froze parts of the development market. Fortunately, recent changes by the House of Representatives have addressed a harmful Senate proposal.

The legislation, as approved by the Senate, would have required institutionally financed new-construction single-family rental housing to be sold to individual home buyers within seven years. This requirement would decrease investable capital and lower housing supply. A preliminary NAHB estimate indicates the proposed rule places approximately 40,000 units per year at-risk. The House version of the bill removes this anti-supply provision. Nonetheless, concerns over the Senate version limited capital investment in the BTR sector at the beginning of 2026.

According to NAHB’s analysis of data from the Census Bureau’s Quarterly Starts and Completions by Purpose and Design, there were approximately 14,000 single-family built-for-rent (SFBFR) starts during the first quarter of 2026. This is down measurably from the first quarter of 2025 (19,000).

Over the last four quarters, 62,000 such homes began construction, which is a 26% decrease compared to the 84,000 estimated BTR starts for the prior four quarter period.

The BTR market is a source of inventory amid challenges regarding housing affordability and down payment requirements in the for-sale market, particularly during a period when a growing number of people want more space and a single-family structure. Single-family built-for-rent construction differs in structural characteristics compared to other newly-built single-family homes, particularly with respect to home size. However, investor demand for single-family homes, both existing and new, has cooled with higher interest rates.

Given the relatively small size of this market segment, the quarter-to-quarter movements typically are not statistically significant. The current four-quarter moving average of market share (just under 7%) is nonetheless higher than the historical average of 2.7% (1992-2012).

Importantly, as measured for this analysis, the estimates noted above include only homes built and held by the builder for rental purposes. The estimates exclude homes that are sold to another party for rental purposes, which NAHB estimates may represent another three to five percent of single-family starts based on industry surveys.

The Census data note an elevated share of single-family homes built as condos (non-fee simple), with this share averaging about 4% over recent quarters. Some, but certainly not all, of these homes will be used for rental purposes. Additionally, it is theoretically possible that some single-family built-for-rent units are being counted in multifamily starts, as a form of “horizontal multifamily,” given that these units are often built on a single plat of land. However, spot checks by NAHB with permitting offices indicate no evidence of this data issue occurring.

With the onset of the Great Recession and declines in the homeownership rate, the share of built-for-rent homes increased in the years after the recession. While the market share of SFBFR homes is small, it has clearly expanded. Given affordability challenges in the for-sale market, the SFBFR market will likely retain an elevated market share. However, in the near term, SFBFR construction is likely to be slow given market and policy headwinds.


This article was originally published by a eyeonhousing.org . Read the Original article here. .


New single-family home size had been falling since 2015 in response to declining affordability conditions. An exception occurred in 2021, when new home size increased as interest rates reached historic lows. However, as mortgage interest rates increased in 2022 and 2023 and affordability worsened, demand shifted back toward smaller homes. More recent data suggest these trends have stabilized, although that reversal is likely due to weakness for the starter-home market.

According to first quarter 2026 data from the Census Quarterly Starts and Completions by Purpose and Design and NAHB analysis, median single-family square floor area was 2,211 square feet, effectively unchanged from the start of the year but up more than 3% over the past two years. Average (mean) square footage for new single-family homes registered at 2,436 square feet, a small increase year-over-year.

On a one-year moving average basis, the average size of a new single-family home was increased slightly to 2,408 square feet, while the median size increased to 2,169 square feet.

Home size trends in 2026 are likely to post continued small gains, driven by relative strength at the high end of the market but constrained by housing affordability challenges.


This article was originally published by a eyeonhousing.org . Read the Original article here. .

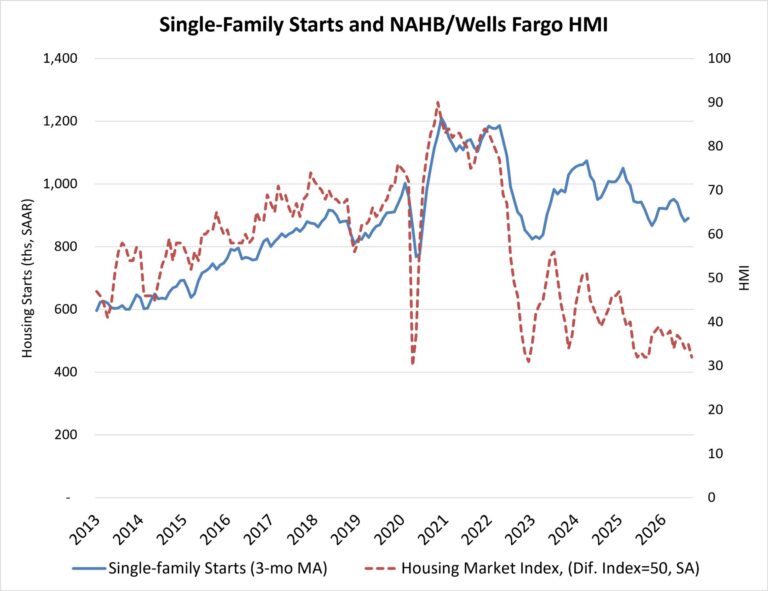
Single-family housing starts declined in April as builders faced continued economic uncertainty and affordability challenges, including higher construction costs, ongoing labor shortages and elevated financing expenses. The latest housing starts and permits data suggest that the overall construction pipeline remains uneven across regions and property types.

Overall housing starts decreased 2.8% in April to a seasonally adjusted annual rate of 1.47 million units, according to a report from the U.S. Department of Housing and Urban Development (HUD) and the U.S. Census Bureau. This pace reflects the number of housing units builders would begin over the next 12 months if April’s activity were sustained.

Within the total, single-family starts decreased 9.0% to a 930,000 seasonally adjusted annual rate and were down 2.4% compared to April 2025. On a year-to-date basis, single-family starts are down 5.1%. Given recent volatility, the three-month moving average provides a clearer signal, rising to 958,000 units.

Multifamily starts, which include apartment buildings and condominiums, increased 10.3% from March to April to an annualized 535,000 pace. The three-month moving average for multifamily construction has trended higher to 481,000 units, and activity is 19.7% higher compared to year-earlier levels.

Regionally, on a year-to-date basis, combined single-family and multifamily starts were 16.6% higher in the Northeast, 1.8% higher in the South, 0.4% lower in the West, and 2.9% lower in the Midwest. For single-family starts, the Midwest was the only region to post an increase, rising 5.2% and reflecting the residential construction strength in the region.

The total number of housing units under construction stood at 1.3 million in April, down 8.5% from a year earlier. Single-family homes under construction stood at 588,000 units, a 7.0% year-over-year decline. Multifamily units under construction declined to 687,000, down from peaks above 1 million units in December 2023 and 9.8% lower than a year ago.

Completions of single-family homes have slowed to an annual rate of about 903,000 units, reflecting ongoing challenges in the residential construction sector. This marks a 7.0% decline from a year earlier. However, multifamily completions for buildings with five or more units were up 6.4% year over year to a 529,000-unit pace. On a year-to-date basis, total completions across both sectors are down 11.2%.

Overall permits increased 5.8% to a 1.44-million-unit annualized rate in April. Single-family permits decreased 2.6% to an 872,000-unit rate and are down 5.5% compared to April 2025. Multifamily permits increased 21.8% to an annualized 570,000 pace and are up 9.2% compared to April 2025. Looking at regional permit data on a year-to-date basis, total permits were 14.2% higher in the Northeast, 7.3% higher in the Midwest, 0.7% higher in the West, but 6.7% lower in the South.


This article was originally published by a eyeonhousing.org . Read the Original article here. .
Pin It