Tag

single-family

Browsing


High interest rates for construction and development loans as well as ongoing challenges regarding labor shortages and higher prices for many building materials continued to slow the building market this summer.

Overall housing starts decreased 6.8% in July to a seasonally adjusted annual rate of 1.24 million units, according to a report from the U.S. Department of Housing and Urban Development and the U.S. Census Bureau. This is the lowest pace since May 2020.

The July reading of 1.24 million starts is the number of housing units builders would begin if development kept this pace for the next 12 months. Within this overall number, single-family starts decreased 14.1% from an upwardly revised June figure to an 851,000 seasonally adjusted annual rate. However, on a year-to-date basis, single-family starts are up 11.4%.

The multifamily sector, which includes apartment buildings and condos, increased 14.5% to an annualized 387,000 pace.

The decline in new home construction mirrors our latest builder surveys (the NAHB/Wells Fargo HMI), which show that buyers remain concerned about challenging affordability conditions and builders are grappling with elevated rates for builder loans, a shortage of workers and lots, and supply chain concerns for some building materials.

Better inflation data points to the Federal Reserve moving to cut interest rates possibly as early as September, and with interest rates expected to moderate in the months ahead, this will help both buyers and builders who are dealing with tight lending conditions.

On a regional and year-to-date basis, combined single-family and multifamily starts are 1.3% lower in the Northeast, 5.1% lower in the Midwest, 5.4% lower in the South and 5.1% lower in the West.

Overall permits decreased 4.0% to a 1.40 million unit annualized rate in July. Single-family permits decreased 0.1% to a 938,000 unit rate. Multifamily permits decreased 11.1% to an annualized 458,000 pace.

Looking at regional data on a year-to-date basis, permits are 1.1% higher in the Northeast, 3.2% higher in the Midwest, 0.3% lower in the South and 4.1% lower in the West.

Single-family homes under construction fell back to a count of 653,000—down 4.1% compared to a year ago. The number of multifamily units under construction fell to an 886,000 count—down 13.2% compared to a year ago. The number of multifamily units under construction is now the lowest since July 2022.

Discover more from Eye On Housing

Subscribe to get the latest posts sent to your email.


This article was originally published by a eyeonhousing.org . Read the Original article here. .
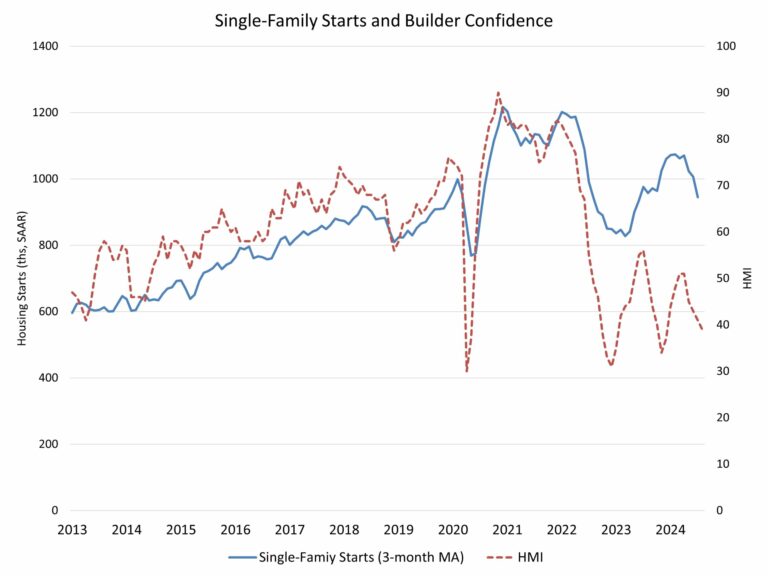

A lack of affordability and buyer hesitation stemming from elevated interest rates and high home prices contributed to a decline in builder sentiment in August.

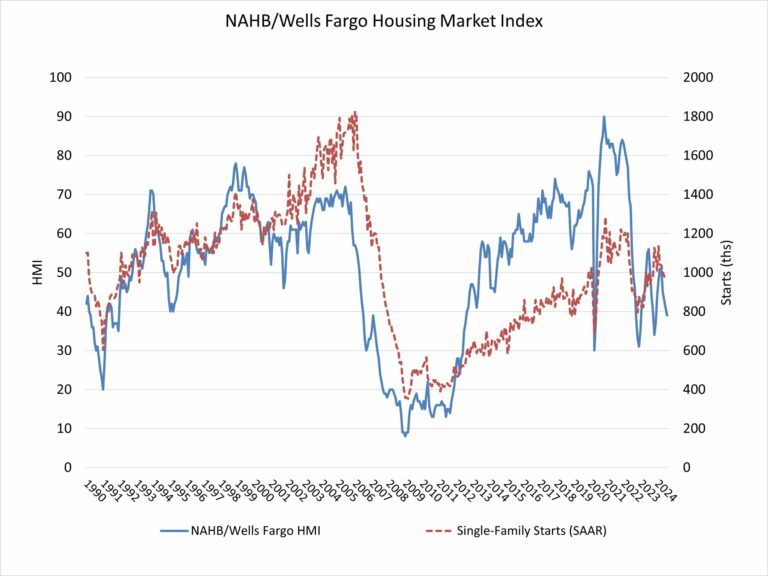
Builder confidence in the market for newly built single-family homes was 39 in August, down two points from a downwardly revised reading of 41 in July, according to the National Association of Home Builders (NAHB)/Wells Fargo Housing Market Index (HMI) released today. This is the lowest reading since December 2023.

Almost three-quarters of the responses to the August HMI were collected during the first week of the month when interest rates averaged 6.73%, according to Freddie Mac. Mortgage rates declined notably the following week to 6.47%, the lowest reading since May 2023.

Challenging housing affordability conditions remain the top concern for prospective home buyers in the current reading of the HMI, as both present sales and traffic readings showed weakness. However, with current inflation data pointing to interest rate cuts from the Federal Reserve and mortgage rates down markedly in the second week of August, buyer interest and builder sentiment should improve in the months ahead.

The August HMI survey also revealed that 33% of builders cut home prices to bolster sales in August, above the July rate of 31% and the highest share in all of 2024. However, the average price reduction in August held steady at 6% for the 14th straight month. Meanwhile, the use of sales incentives increased to 64% in August from 61% in July, and this was the highest level since April 2019.

Derived from a monthly survey that NAHB has been conducting for more than 35 years, the NAHB/Wells Fargo HMI gauges builder perceptions of current single-family home sales and sales expectations for the next six months as “good,” “fair” or “poor.” The survey also asks builders to rate traffic of prospective buyers as “high to very high,” “average” or “low to very low.” Scores for each component are then used to calculate a seasonally adjusted index where any number over 50 indicates that more builders view conditions as good than poor.

The HMI index charting current sales conditions in August fell two points to 44 and the gauge charting traffic of prospective buyers also declined by two points to 25. The component measuring sales expectations in the next six months increased one point to 49.

Looking at the three-month moving averages for regional HMI scores, the Northeast fell four points to 52, the Midwest dropped four points to 39, the South decreased two points to 42 and the West held steady at 37. The HMI tables can be found at nahb.org/hmi.

Discover more from Eye On Housing

Subscribe to get the latest posts sent to your email.


This article was originally published by a eyeonhousing.org . Read the Original article here. .

Nationwide, the share of non-conventional financing for new home sales accounted for 32.4% of the market per NAHB analysis of the 2023 Census Bureau Survey of Construction (SOC) data. This is a significant 4.3 percentage point increase from the 2022 share of 28.1%. As in previous years, conventional financing dominated the market at 67.6% of sales, albeit lower than the 2022 share of 71.9%.

Non-conventional forms of financing, as opposed to conventional mortgage loans, include loans insured by the Federal Housing Administration (FHA), VA-backed loans, cash purchases and other types of financing such as the Rural Housing Service, Habitat for Humanity, loans from individuals, or state or local government mortgage-backed bonds. The reliance on non-conventional forms of financing varied across the United States, with its share at almost 40% in West South Central but only 17.1% of new single-family home starts in the Middle Atlantic division.

Nationwide, cash purchases were the majority share of non-conventional financing of new home purchases, accounting for 14% of the market share, slightly up from 13% in 2022. NAHB survey based on builders reported that for 2024, all-cash sales are a higher share at 22%. FHA-backed loans accounted for 12%, whereas in 2022, it was only 8% of the market share. The share of VA-backed loans was at 4% market share in 2023, while Other Financing was 3% of market share.

Regionally, cash financing held the highest share in East South Central, where 24.6% of all homes started were purchased with cash. Except for the South Atlantic, West South Central, and the Pacific, cash purchases led non-conventional financing in the remaining six census regions. Cash purchases accounted for 22.0% in East North Central, 16.9% in New England, 12.3% in Mountain, 12.0% in Middle Atlantic, and 10.6% in West North Central region.   

FHA-backed loans accounted for the majority of all non-conventional financing in the West South Central division accounting for 20.8% of the homes started. This share has gone up considerably  from 12.9% in 2022. The New England division reported the lowest FHA-backed loans with only a share of 1.2% of the homes started in 2023.

VA-backed loans were most used in the South Atlantic division, which accounted for 5.9% of non-conventional forms of financing. In New England, none of the homes started used VA-backed loans in 2023.  

Other financing such as the Rural Housing Service, Habitat for Humanity, loans from individuals, state or local government mortgage-backed bonds was highest in East North Central where it was collectively 5.6% of market share, while Middle Atlantic division reported the lowest share at 0.9%.

Discover more from Eye On Housing

Subscribe to get the latest posts sent to your email.


This article was originally published by a eyeonhousing.org . Read the Original article here. .

Pin It