Tag

single-family

Browsing


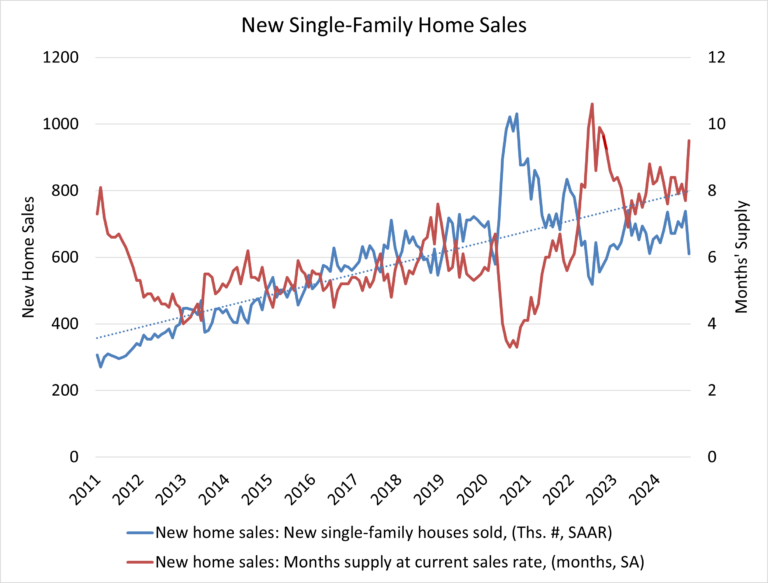
Steadily rising mortgage rates coupled with ongoing affordability challenges kept many potential home buyers on the sidelines in October. Sales of newly built, single-family homes in October declined 17.3% to a 610,000 seasonally adjusted annual rate, according to newly released data from the U.S. Department of Housing and Urban Development and the U.S. Census Bureau. The pace of new home sales in October is down 9.4% compared to a year earlier. October new home sales are up 2.1% on a year-to-date basis.

A new home sale occurs when a sales contract is signed, or a deposit is accepted. The home can be in any stage of construction: not yet started, under construction or completed. In addition to adjusting for seasonal effects, the October reading of 610,000 units is the number of homes that would sell if this pace continued for the next 12 months.

New single-family home inventory in October remained elevated at a level of 481,000, up 8.8% compared to a year earlier. This represents a 9.5 months’ supply at the current sales pace. A measure near a six months’ supply is considered balanced.

While a 9.5 months’ supply may be considered elevated in normal market conditions, there is currently only a 4.2 months’ supply of existing single-family homes on the market. Combined, new and existing total months’ supply remains below historic norms at approximately 4.9 months, although this measure is expected to increase as more home sellers test the market in the months ahead.

A year ago, there were 76,000 completed, ready-to-occupy homes available for sale (not seasonally adjusted). By the end of October 2024, that number increased 52.6% to 116,000. However, completed, ready-to-occupy inventory remains just 24% of total inventory, while homes under construction account for 55% of the inventory. The remaining 22% of new homes sold in October were homes that had not started construction when the sales contract was signed.

The median new home sale price in October edged up 2.5% to $437,300 and is up 4.7% from a year ago. In terms of affordability, the share of entry-level homes priced below $300,000 has been steadily falling in recent years. Only 13% of the homes were priced in this entry-level affordable range, while 37% of the homes were priced above $500,000. Most of the homes were priced between $300,000-$500,000.

Regionally, on a year-over-year basis, new home sales are up 35.3% in the Northeast and 15.9% in the Midwest. New home sales are down 19.7% in the South and 1.3% in the West.

Discover more from Eye On Housing

Subscribe to get the latest posts sent to your email.


This article was originally published by a eyeonhousing.org . Read the Original article here. .

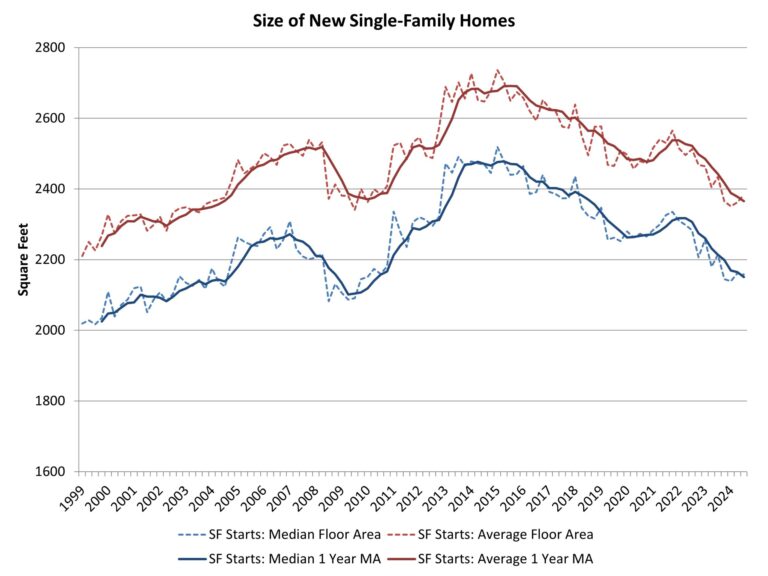
An expected impact of the virus crisis was a need for more residential space, as people used homes for more purposes including work. Home size correspondingly increased in 2021 as interest rates reached historic lows. However, as interest rates increased in 2022 and 2023, and housing affordability worsened, the demand for home size has trended lower. With lower long-term interest rates coming in view, will new single-family home size reverse and move higher in 2025?

According to third quarter 2024 data from the Census Quarterly Starts and Completions by Purpose and Design and NAHB analysis, median single-family square floor area was 2,158 square feet, just off the lowest reading since the second half of 2009. Average (mean) square footage for new single-family homes registered at 2,348 square feet.

The average size of a new single-family home, on a one-year moving average basis, trended lower to 2,366 square feet, while the median size is at 2,150 square feet.

Home size increased from 2009 to 2015 as entry-level new construction lost market share. Home size declined between 2016 and 2020 as more starter homes were developed. After a brief increase during the post-COVID building boom, home size has trended lower due to declining affordability conditions. As interest rates decline, new home size could level off and increase in the quarters ahead.

Discover more from Eye On Housing

Subscribe to get the latest posts sent to your email.


This article was originally published by a eyeonhousing.org . Read the Original article here. .

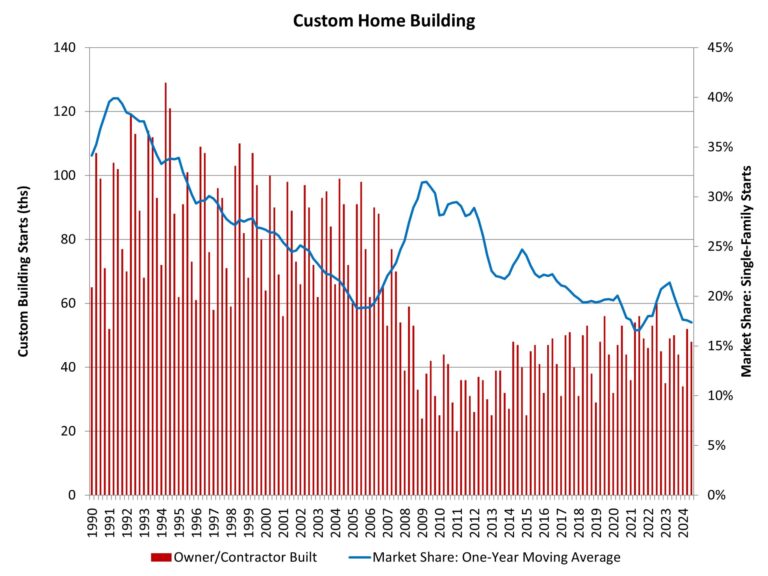
NAHB’s analysis of Census Data from the Quarterly Starts and Completions by Purpose and Design survey indicates relatively flat conditions for custom home builders after a period slight softening of market share due to declining mortgage interest rates. However, post-election stock market gains should support custom building at the end of 2024 and going into 2025.

There were 48,000 total custom building starts during the third quarter of 2024. This marks a 4% decline compared to the third quarter of 2023. Over the last four quarters, custom housing starts totaled 178,000 homes, just below a 1% decline compared to the prior four quarter total (179,000).

After share declines due to a rise in spec building in the wake of the pandemic, the market share for custom homes increased until 2023 and then entered a period of retrenchment. As measured on a one-year moving average, the market share of custom home building, in terms of total single-family starts, has fallen back to 17%. This is down from a prior cycle peak of 31.5% set during the second quarter of 2009 and a 21% local peak rate at the beginning of 2023.

Note that this definition of custom home building does not include homes intended for sale, so the analysis in this post uses a narrow definition of the sector. It represents home construction undertaken on a contract basis for which the builder does not hold tax basis in the structure during construction.

Discover more from Eye On Housing

Subscribe to get the latest posts sent to your email.


This article was originally published by a eyeonhousing.org . Read the Original article here. .

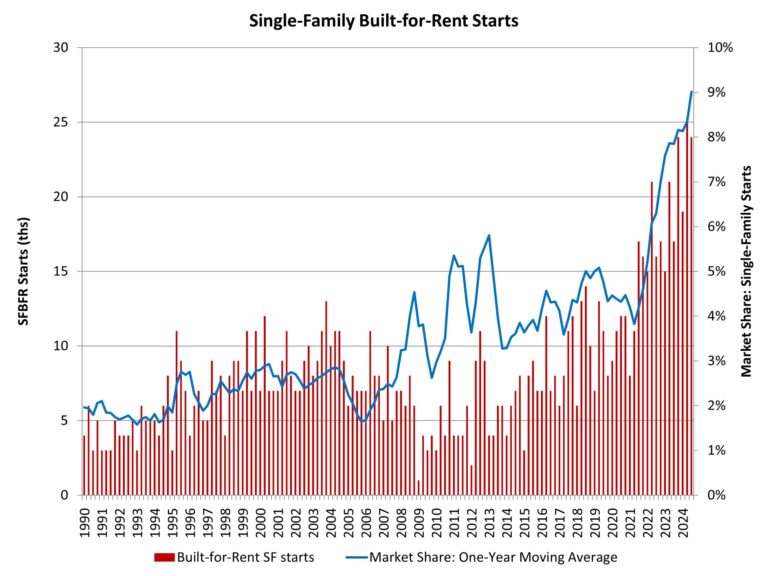
Single-family built-for-rent construction posted year-over-year gains for the third quarter of 2024, as builders sought to add additional rental housing in a market facing ongoing, elevated mortgage interest rates.

According to NAHB’s analysis of data from the Census Bureau’s Quarterly Starts and Completions by Purpose and Design, there were approximately 24,000 single-family built-for-rent (SFBFR) starts during the third quarter of 2024. This is 41% higher than the third quarter of 2023. Over the last four quarters, 92,000 such homes began construction, which is a more than 31% increase compared to the 70,000 estimated SFBFR starts in the four quarters prior to that period.

The SFBFR market is a source of inventory amid challenges over housing affordability and downpayment requirements in the for-sale market, particularly during a period when a growing number of people want more space and a single-family structure. Single-family built-for-rent construction differs in terms of structural characteristics compared to other newly-built single-family homes, particularly with respect to home size. However, investor demand for single-family homes, both existing and new, has cooled with higher interest rates. Nonetheless, builders continue to build projects of built-for-rent homes for their own operation.

Given the relatively small size of this market segment, the quarter-to-quarter movements typically are not statistically significant. The current four-quarter moving average of market share (9%) is nonetheless higher than the historical average of 2.7% (1992-2012).

Importantly, as measured for this analysis, the estimates noted above include only homes built and held by the builder for rental purposes. The estimates exclude homes that are sold to another party for rental purposes, which NAHB estimates may represent another three to five percent of single-family starts based on industry surveys. However, this investor market has cooled somewhat in recent quarters due to higher interest rates.

The Census data notes an elevated share of single-family homes built as condos (non-fee simple), with this share averaging more than 4% over recent quarters. Some, but certainly not all, of these homes will be used for rental purposes. Additionally, it is theoretically possible some single-family built-for-rent units are being counted in multifamily starts, as a form of “horizontal multifamily,” given these units are often built on a single plat of land. However, spot checks by NAHB with permitting offices indicate no evidence of this data issue occurring.

With the onset of the Great Recession and declines for the homeownership rate, the share of built-for-rent homes increased in the years after the recession. While the market share of SFBFR homes is small, it has clearly expanded. Given affordability challenges in the for-sale market, the SFBFR market will likely retain an elevated market share even as the rest of the building market expands in the coming quarters.

Discover more from Eye On Housing

Subscribe to get the latest posts sent to your email.


This article was originally published by a eyeonhousing.org . Read the Original article here. .

Housing starts edged lower last month as average monthly mortgage rates increased a quarter-point from 6.18% to 6.43% between September and October, according to Freddie Mac.

Overall housing starts decreased 3.1% in October to a seasonally adjusted annual rate of 1.31 million units, according to a report from the U.S. Department of Housing and Urban Development and the U.S. Census Bureau.

The October reading of 1.31 million starts is the number of housing units builders would begin if development kept this pace for the next 12 months. Within this overall number, single-family starts decreased 6.9% to a 970,000 seasonally adjusted annual rate. On a year-to-date basis, single-family construction is up 9.3%. The volatile multifamily sector, which includes apartment buildings and condos, increased 9.6% to an annualized 341,000 pace but are down 29.3% on a year-to-date basis.

Although housing starts declined in October, builder sentiment improved for a third straight month in November as builders anticipate an improved regulatory environment in 2025 that will allow the industry to increase housing supply. Further interest rate cuts from the Federal Reserve through 2025 should result in lower interest rates for construction and development loans, helping to lead to a stabilization for apartment construction and expansion for single-family home building.

While multifamily starts increased in October, the number of apartments under construction is down to 821,000, the lowest count since March 2022 and down 18.9% from a year ago. In October, there were 1.8 apartments that completed construction for every one apartment that started construction. The three-month moving average reached a ratio of 2 in October.

There were 644,000 single-family homes under construction in October, down 3.6% from a year ago and down 22% from the peak count in the Spring of 2022.

On a regional and year-to-date basis, combined single-family and multifamily starts are 10.4% higher in the Northeast, 1.7% lower in the Midwest, 5.0% lower in the South due to hurricane effects, and 4.4% lower in the West.

Overall permits decreased 0.6% to a 1.42 million unit annualized rate in October. Single-family permits increased 0.5% to a 968,000 unit rate and are up 9.4% on a year-to-date basis. Multifamily permits decreased 3.0% to an annualized 448,000 pace.

Looking at regional data on a year-to-date basis, permits are 0.9% higher in the Northeast, 3.9% higher in the Midwest, 2.4% lower in the South and 4.8% lower in the West.

Discover more from Eye On Housing

Subscribe to get the latest posts sent to your email.


This article was originally published by a eyeonhousing.org . Read the Original article here. .
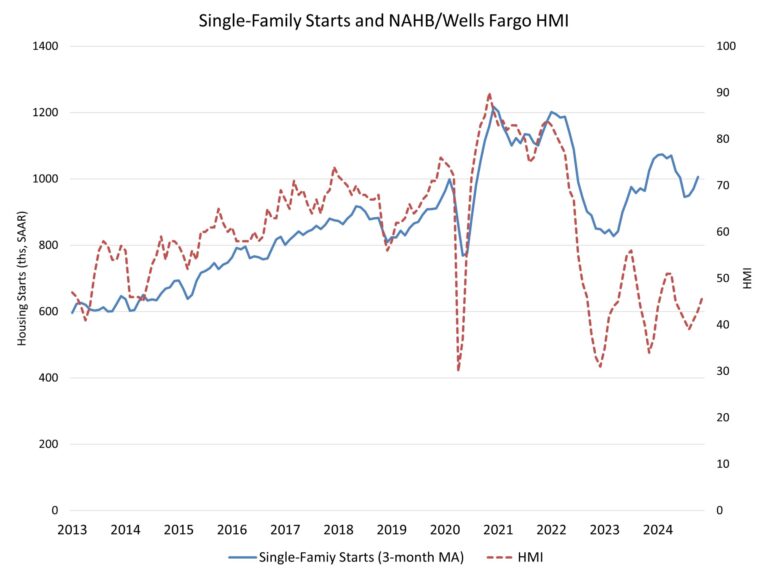

Builder sentiment improved for the third straight month, and builders expect market conditions will continue to improve with Republicans winning control of the White House and Congress.

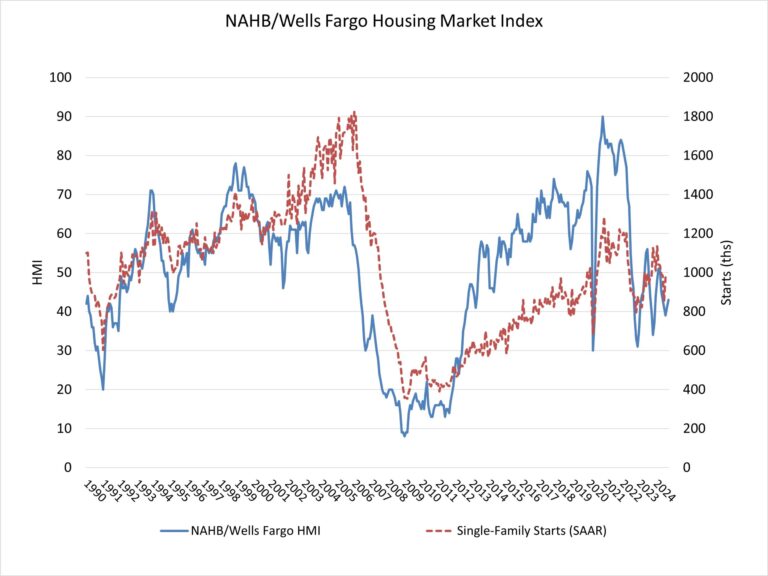
Builder confidence in the market for newly built single-family homes was 46 in November, up three points from October, according to the National Association of Home Builders (NAHB)/Wells Fargo Housing Market Index. Future sales expectations posted a notable increase in the November reading of builder sentiment.

While builder confidence is improving, the industry still faces many headwinds such as an ongoing shortage of labor and buildable lots along with elevated building material prices. Moreover, while the stock market cheered the election result, the bond market has concerns, as indicated by a rise for long-term interest rates. There is also policy uncertainty in front of the business sector and housing market as the executive branch changes hands.

The latest HMI survey also revealed that 31% of builders cut home prices in November. This share has remained essentially unchanged since July, hovering between 31% and 33%. Meanwhile, the average price reduction was 5%, slightly below the 6% rate posted in October. The use of sales incentives was 60% in November, slightly down from 62% in October.

Derived from a monthly survey that NAHB has been conducting for more than 35 years, the NAHB/Wells Fargo HMI gauges builder perceptions of current single-family home sales and sales expectations for the next six months as “good,” “fair” or “poor.” The survey also asks builders to rate traffic of prospective buyers as “high to very high,” “average” or “low to very low.” Scores for each component are then used to calculate a seasonally adjusted index where any number over 50 indicates that more builders view conditions as good than poor.

All three HMI sub-indices were up in November. The index charting current sales conditions rose two points to 49, the component measuring sales expectations in the next six months increased seven points to 64 and the gauge charting traffic of prospective buyers posted a three-point gain to 32.

Looking at the three-month moving averages for regional HMI scores, the Northeast increased four points to 55, the Midwest moved three points higher to 44, the South edged up one point to 42 and the West held steady at 41. HMI tables can be found at nahb.org/hmi.

Discover more from Eye On Housing

Subscribe to get the latest posts sent to your email.


This article was originally published by a eyeonhousing.org . Read the Original article here. .
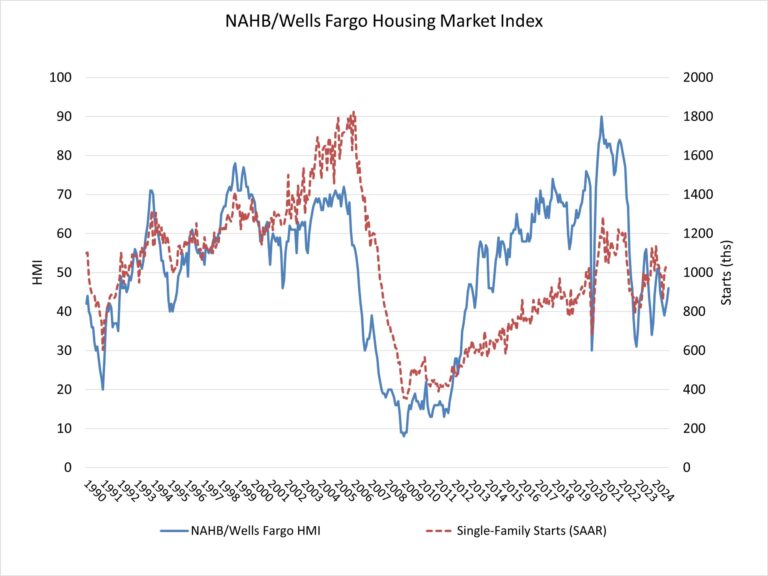

With elevated interest rates and rising home prices, 103.5 million households in the United States cannot afford a $495,750 median-priced new home. The growing affordability crisis makes housing a top issue for voters in the 2024 presidential election. Both presidential candidates have offered housing policy proposals to address our nation’s housing supply and affordability challenges.

Homeownership has been a crucial part of the American Dream for over a century as owning a home not only provides households with a stable place to live, but also offers an opportunity for households to accumulate assets and build wealth over time through equity.

A recent NAHB study on home buyer preferences revealed that a single-family detached home remained the top purchase preference for two out of every three buyers. In reality, only 54% of the total housing units in 2023 were owner-occupied single-family detached homes, according to NAHB analysis of American Community Survey (ACS) data. This equates to around 70 million homes of the total 131 million housing units.

In addition, a recent article in the Washington Post stated that “the new American Dream should be a townhouse (using the term of single-family attached homes in this post).” The article argues that townhouses are more affordable, need less maintenance, and foster a sense of community. Additionally, townhomes in medium-density residential neighborhoods can be a good option for younger home buyers. However, owner-occupied single-family attached homes only accounted for 4% of the total occupied housing units in 2023.

Single-Family Detached Homes Across Congressional Districts

Across congressional districts, the share of single-family detached homes among all owner-occupied housing units varies substantially, ranging from 3% to 95%.

Texas has a high share of owner-occupied single-family homes. Texas’s 20th congressional district has the highest share of single-family detached homes. All congressional districts in Texas have at least an 83% share of single-family detached homes. Four districts in Texas, two in Indiana and Nebraska, one in Iowa, and one in California report the top ten highest share of single-family detached homes.

At the bottom of the ranking, congressional districts in New York and Pennsylvania are on the list of the ten lowest shares of single-family detached homes. New York’s 12th, 13th, and 10th, where renter-occupied housing units exceed owner-occupied ones, have the lowest share with 3%, 4%, and 5%, respectively. In addition to a lower share of single-family detached homes, New York’s 12th and 13th have a low share of single-family attached homes, with 2% for both districts. In the District of Columbia, at-large, 22% of owner-occupied single-family housing units are detached, ranked as the 12th lowest share.

Despite the geographic variation, single-family detached homes dominate most of the owner-occupied housing markets. Out of all 436 congressional districts, only 18 congressional districts have a lower share of single-family detached homes than the national level of 54%.

Single-Family Attached Homes Across Congressional Districts

Although single-family attached homes are not as popular as single-family detached homes in the owner-occupied housing market, the share of single-family attached homes shows substantial variation across congressional districts, ranging from 0% to 78%.

Pennsylvania’s 3rd congressional district has about 78% single-family attached homes, followed by Pennsylvania’s 2nd district with 75% single-family attached homes, and Maryland’s 7th district with 57%. The District of Columbia, at-large, with only 22% single-family detached homes, was ranked as the fourth highest share of single-family attached homes (43%).

Single-family attached homes have become popular as more home buyers are looking for “medium-density residential neighborhoods, such as urban villages that offer walkable environments and other amenities”, as mentioned in an NAHB blog post.

Median Home Value

The median value of owner-occupied housing units in the United States is $340,200, though it varies significantly across congressional districts depending on local housing supply and demand, property size, neighborhood, and overall economic factors. Coastal areas often have significantly higher median home values than rural regions.

Analysis of the 2023 ACS data shows that of the 14 congressional districts where median house value exceeds one million, 12 of them are in California. California’s 16th congressional district has the highest median home value of $1,820,400 among all congressional districts, with 81% of 159,895 owner-occupied housing units valuing more than one million dollars.

New York’s 12th and 10th congressional districts, with only 3% and 5% single-family detached homes, are the other two districts where median home value is over one million.

Additional housing data for your congressional district are provided by the US Census Bureau here.

Discover more from Eye On Housing

Subscribe to get the latest posts sent to your email.


This article was originally published by a eyeonhousing.org . Read the Original article here. .


Home buyers moved off the sidelines in September following the Federal Reserve’s recent move to cut interest rates for the first time in four years. 

Sales of newly built, single-family homes in September increased 4.1% to a 738,000 seasonally adjusted annual rate from a downwardly revised August number, according to newly released data from the U.S. Department of Housing and Urban Development and the U.S. Census Bureau. The pace of new home sales in September is up 6.3% compared to a year earlier.

Despite challenging affordability conditions, home builder confidence edged higher in October as they anticipate that mortgage rates will gradually, in an uneven manner, moderate in the coming months. There is a significant need for additional housing supply, as many prospective home buyers are entering the market.

Following the Fed’s actions in September, mortgage rates fell to 6.18%, from 6.5% in August. However, new home sales will likely weaken in October due to a recent rise in long-term rates.

A new home sale occurs when a sales contract is signed, or a deposit is accepted. The home can be in any stage of construction: not yet started, under construction or completed. In addition to adjusting for seasonal effects, the September reading of 738,000 units is the number of homes that would sell if this pace continued for the next 12 months.

New single-family home inventory in September remained elevated at a level of 470,000, up 8.0% compared to a year earlier. This represents a 7.6 months’ supply at the current building pace. Completed for-sale new homes rose to 108,000, the highest level since 2009.

The median new home sale price in September was $426,300, essentially unchanged from a year ago. The Census data reveals a gain for new home sales priced below $300,000, which made up 17% of new home sales in September, compared to 14% a year ago.

Regionally, on a year-to-date basis, new home sales are up 19.2% in the Midwest, 1.1% in the South and 3.4% in the West. New home sales are down 1.1% in the Northeast.

Discover more from Eye On Housing

Subscribe to get the latest posts sent to your email.


This article was originally published by a eyeonhousing.org . Read the Original article here. .
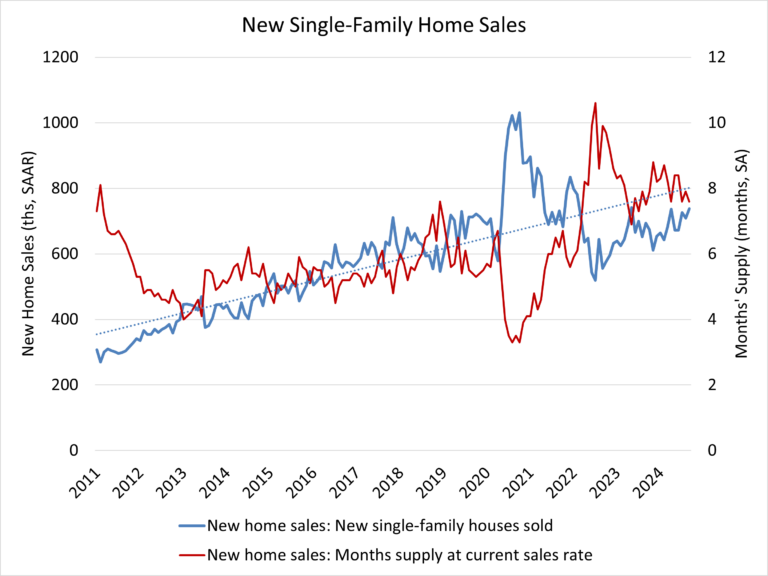

With the Federal Reserve beginning an easing of monetary policy and builder sentiment improving, single-family starts posted a modest gain in September while multifamily construction continued to weaken because of tight financing and an ongoing rise in completed apartments.

Overall housing starts decreased 0.5% in September to a seasonally adjusted annual rate of 1.35 million units, according to a report from the U.S. Department of Housing and Urban Development and the U.S. Census Bureau.

The September reading of 1.35 million starts is the number of housing units builders would begin if development kept this pace for the next 12 months. Within this overall number, single-family starts increased 2.7% to a 1.03 million seasonally adjusted annual rate. On a year-to-date basis, single-family construction is up 10.1%. The September gain for single-family home building mirrored an increase for the NAHB/Wells Fargo HMI.

While single-family home building increased in September, higher mortgage interest rates in October are likely to place a damper on growth in next month’s data. Nonetheless, NAHB is forecasting a gradual, if uneven, decline for mortgage rates in the coming quarters, with corresponding increases for single-family construction.

The multifamily sector, which includes apartment buildings and condos, decreased 9.4% to an annualized 327,000 pace. This marks the weakest pace since May. Multifamily construction will remain weak as completions of apartments are elevated.

On a regional and year-to-date basis, combined single-family and multifamily starts are 9.0% higher in the Northeast, 2.0% lower in the Midwest, 4.6% lower in the South and 5.4% lower in the West.

Overall permits decreased 2.9% to a 1.43 million unit annualized rate in September. Single-family permits increased 0.3% to a 970,000 unit rate. Multifamily permits decreased 8.9% to an annualized 458,000 pace. This is the weakest reading since May.

Looking at regional data on a year-to-date basis, permits are 0.8% higher in the Northeast, 2.6% higher in the Midwest, 2.2% lower in the South and 5.1% lower in the West.

The number of single-family homes under active construction totaled 642,000 in September. After stabilizing recently, this is down just 4.5% from a year ago. The number of multifamily units under construction declined 3.4% in September to an 842,000 total. This is 16.5% lower than a year ago and is the smallest count since February 2022.

As a sign of the reversal for multifamily construction, the seasonally adjusted annual rate of multifamily construction was 680,000 in September. This was roughly twice the pace of multifamily starts, meaning for every two apartments finishing construction, only one new unit began construction. The pace of multifamily completions was up 41% compared to a year ago.

Discover more from Eye On Housing

Subscribe to get the latest posts sent to your email.


This article was originally published by a eyeonhousing.org . Read the Original article here. .
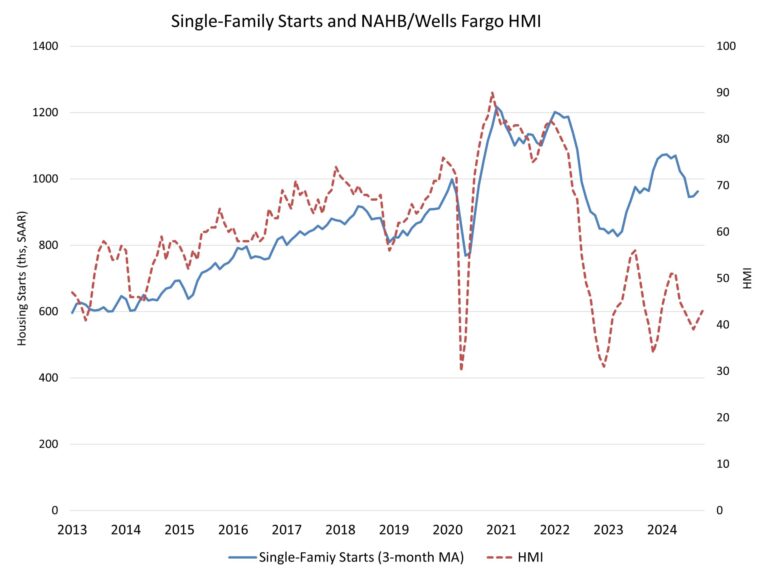

With inflation gradually easing and builders anticipating mortgage rates will moderate in coming months, builder sentiment moved higher for a second consecutive month despite challenging affordability conditions.

Builder confidence in the market for newly built single-family homes was 43 in October, up two points from a reading of 41 in September, according to the National Association of Home Builders (NAHB)/Wells Fargo Housing Market Index (HMI).

Despite the beginning of the Fed’s easing cycle, many prospective home buyers remain on the sideline waiting for lower interest rates. We are forecasting uneven declines for mortgage interest rates in the coming quarters, which will improve housing demand but place stress on building lot supplies due to tight lending conditions for development and construction loans. However, while housing affordability remains low, builders are feeling more optimistic about 2025 market conditions. A wildcard for the outlook remains the election.

The latest HMI survey also revealed that the share of builders cutting prices held steady at 32% in October, the same rate as last month. Meanwhile, the average price reduction returned to the long-term trend of 6% after dropping to 5% in September. The use of sales incentives was 62% in October, slightly up from 61% in September.

Derived from a monthly survey that NAHB has been conducting for more than 35 years, the NAHB/Wells Fargo HMI gauges builder perceptions of current single-family home sales and sales expectations for the next six months as “good,” “fair” or “poor.” The survey also asks builders to rate traffic of prospective buyers as “high to very high,” “average” or “low to very low.” Scores for each component are then used to calculate a seasonally adjusted index where any number over 50 indicates that more builders view conditions as good than poor.

All three HMI indices were up in October. The index charting current sales conditions rose two points to 47, the component measuring sales expectations in the next six months increased four points to 57 and the gauge charting traffic of prospective buyers posted a two-point gain to 29.

Looking at the three-month moving averages for regional HMI scores, the Northeast increased two points to 51, the Midwest moved two points higher to 41, the South held steady at 41 and the West increased three points to 41. The HMI tables can be found at nahb.org/hmi.

Discover more from Eye On Housing

Subscribe to get the latest posts sent to your email.


This article was originally published by a eyeonhousing.org . Read the Original article here. .
Pin It