Tag

single-family

Browsing


In 2024, there were 24,000 homes that exceeded 5,000 square feet, equating to a 2.3% market share of all new homes started. Both the number and market share for 5,000+ square foot homes experienced declines from 2023, according to the annual data from the Census Bureau’s Survey of Construction (SOC).

The number of homes started in 2024 exceeding 5,000 square feet dropped to 24,000, a decrease from 26,000 in 2023. In 2006, the number of new 5,000+ square foot homes reached a peak of 45,000. This number proceeded to drop during the Great Recession and hit a low of 11,000 in 2009. Since 2013, the number has remained consistently above 20,000, with a recent peak of 33,000 in 2021.

Of the total number of new homes started in 2024, 2.3% had 5,000+ square feet or more of finished space, down from 2.8% in 2023.  The decline marks the third consecutive drop in the share of homes this size, down from a recent peak of 2.9% in 2021.  In 2015, the 5,000+ square foot share reached a record high of 3.9%.  Since then, it has fluctuated between 2.3% and 3.1%.

Tabulating the major characteristics of 5,000+ square foot homes started in 2024, the data show 83% have a porch, 79% have a finished basement, 71% have a patio, 69% have four or more bathrooms, 66% have a 3-or-more car garage, 54% have five bedrooms or more, and 50% belong to a community association.

Discover more from Eye On Housing

Subscribe to get the latest posts sent to your email.


This article was originally published by a eyeonhousing.org . Read the Original article here. .

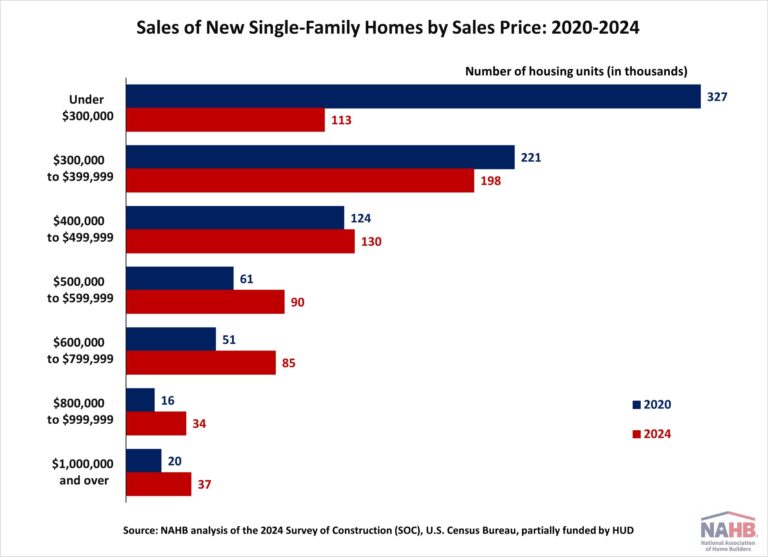
From 2020 to 2024, sales of lower-priced new homes declined significantly as the market moved toward higher-priced segments. Rising construction costs—driven by inflation, supply chain disruptions, and labor shortages—as well as higher regulatory costs, made it increasingly difficult for builders to construct affordable homes. On the other hand, low levels of inventory pushed up the price of new single-family homes, deepening the housing affordability crisis for first-time and middle-income buyers.

National New Home Sales by Sales Price

Data from the U.S. Census’s Survey of Construction (SOC) shows that total sales of new single-family homes declined by 17% during the 2020—2024 period. Meanwhile, the median sales price of new single-family homes increased significantly, rising from $330,900 in 2020 to $420,300 in 2024. This steep rise in sales price has placed additional pressure on prospective home buyers, particularly those seeking homes in the lower-priced segments.

Between 2020 and 2024, the market for new single-family homes experienced significant shifts in the distribution of sales by price range. Most notably, there was a sharp decline in sales of lower-priced homes. Homes priced under $300,000 experienced a 65% decline in sales, while sales of homes priced between $300,000 and $399,999 fell by 10%. In contrast, higher-end segments saw substantial growth, with sales of homes priced between $800,000 and $999,999 more than doubling and those priced at $1,000,000 or more increasing by 85%.

The market share of lower-priced homes declined dramatically. In 2020, homes priced under $300,000 accounted for 40% of the total new single-family home sales, making them a dominant category. By 2024, this category had dropped to the third largest, overtaken by homes in the $300,000—$399,999 and $400,000—$499,999 ranges. Meanwhile, the share of higher-priced homes expanded, reflecting a broader shift toward more expensive construction and away from affordability.

Regional New Home Sales by Sales Price

The regional picture mirrors these national trends, though the magnitude and affected price category vary by geography. Between 2020 and 2024, all four regions—the Northeast, Midwest, South, and West—saw declines in new home sales. The West experienced the steepest drop at 28%, followed by the Midwest at 14%, the South at 13%, and the Northeast at 8%. The declines mainly reflect significant declines in lower-priced home sales.

In the Midwest and South, the declines in new home sales were limited to homes priced under $300,000. In the Northeast and West, where the regions tend to have higher median home prices, sales declines occurred in multiple price categories. The Northeast saw a broader decline in new homes sold under $600,000, while new home sales in the West reported declines in three price categories under $500,000.

Furthermore, all four regions also experienced a decline in the market share of lower-priced homes. In 2020, more than half of the new homes sold in the Midwest and South were priced under $300,000. By 2024, that share had plummeted to just 16% in the Midwest and 23% in the South. The Northeast and West also saw notable shifts, with the share of homes priced between $300,000 and $499,999 dropping sharply over the same period.

Discover more from Eye On Housing

Subscribe to get the latest posts sent to your email.


This article was originally published by a eyeonhousing.org . Read the Original article here. .

Single-family housing starts declined in June to the lowest rate since July 2024 as elevated interest rates, rising inventories and ongoing supply-side issues continue to act as headwinds for the housing sector.

Due to a solid increase in multifamily production, overall housing starts increased 4.6% in June to a seasonally adjusted annual rate of 1.32 million units, according to a report from the U.S. Department of Housing and Urban Development and the U.S. Census Bureau.

The June reading of 1.32 million starts is the number of housing units builders would begin if development kept this pace for the next 12 months. Within this overall number, single-family starts decreased 4.6% to an 883,000 seasonally adjusted annual rate and are down 10% compared to June 2024. The multifamily sector, which includes apartment buildings and condos, increased 30% to an annualized 438,000 pace.

Single-family building conditions continued to weaken in June as housing affordability challenges caused builder traffic to move lower as buyers moved to the sidelines. Rising levels of resale inventory are also a headwind for the industry.

Single-family home building in the South is down 12.4% on a year-to-date basis, far outpacing declines in the Northeast and the West. However, single-family home building is up 10% on a year-to-date basis in the Midwest, where housing affordability conditions are generally better than much of the nation.

On a regional and year-to-date basis, combined single-family and multifamily starts were 28.8% higher in the Northeast, 13.1% higher in the Midwest, 8.1% lower in the South and 0.6% lower in the West.

Overall permits increased 0.2% to a 1.40-million-unit annualized rate in June. Single-family permits decreased 3.7% to an 866,000-unit rate and are down 8.4% compared to June 2024. Multifamily permits increased 7.3% to a 531,000 pace.

Looking at regional permit data on a year-to-date basis, permits were 16.9% lower in the Northeast, 8.2% higher in the Midwest, 3.3% lower in the South and 3.7% lower in the West.

The declines for single-family home building have caused the number of single-family homes under construction to level off. There are currently 622,000 single-family homes under construction, which is 6% lower than a year ago. The number of apartments under construction in June, 739,000, is 18.8% lower than a year ago.

Discover more from Eye On Housing

Subscribe to get the latest posts sent to your email.


This article was originally published by a eyeonhousing.org . Read the Original article here. .

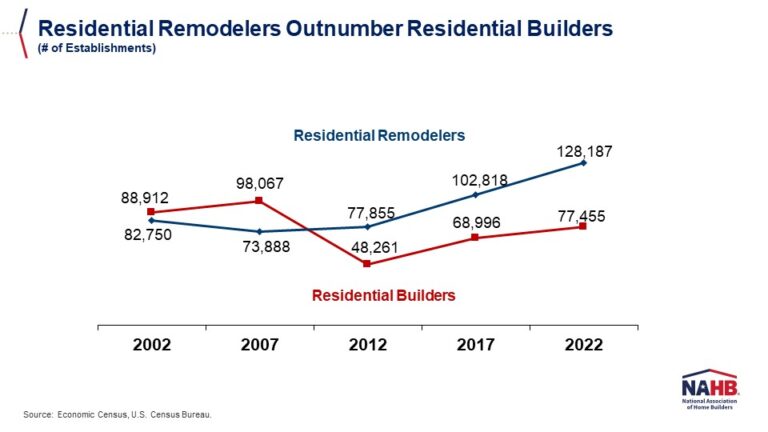
The number of residential remodelers in the U.S. has reached a record high of 128,187 establishments, 65% higher than the number of residential builders (single-family and multifamily), which stands at 77,455.  These official government counts were released by the U.S. Census Bureau as part of its 2022 Economic Census, which tallies American businesses every five years (in years ending in 2 and 7).

Growth in the number of remodelers significantly outpaced that of builders between 2017 and 2022. In that 5-year span, the remodeler count increased by 25% (102,818 to 128,187), while the number of builders grew at half that pace–by 12% (68,996 to 77,455).

A starker dichotomy emerges when comparing 2022 counts to those in 2007, prior to the financial crisis and the ensuing housing recession.  In that 15-year period, the official number of residential remodelers in the U.S. grew by 73% (73,888 to 128,187), while the official number of residential builders contracted by 21% (98,067 to 77,455).

Another way to analyze this data is by creating a combined universe of both builders and remodelers and then calculating each group’s share of the total. In 2022, for example, remodelers represented 62% of the total number of builders and remodelers in the U.S, while builders made up a minority share of 38%.  Remodelers have accounted for at least 60% of this total in the last three Economic Census (2012, 2017, and 2022). 

The last time builders comprised a majority share was in 2007, when they represented 57% of the combined total number of builders and remodelers in the country.

Discover more from Eye On Housing

Subscribe to get the latest posts sent to your email.


This article was originally published by a eyeonhousing.org . Read the Original article here. .

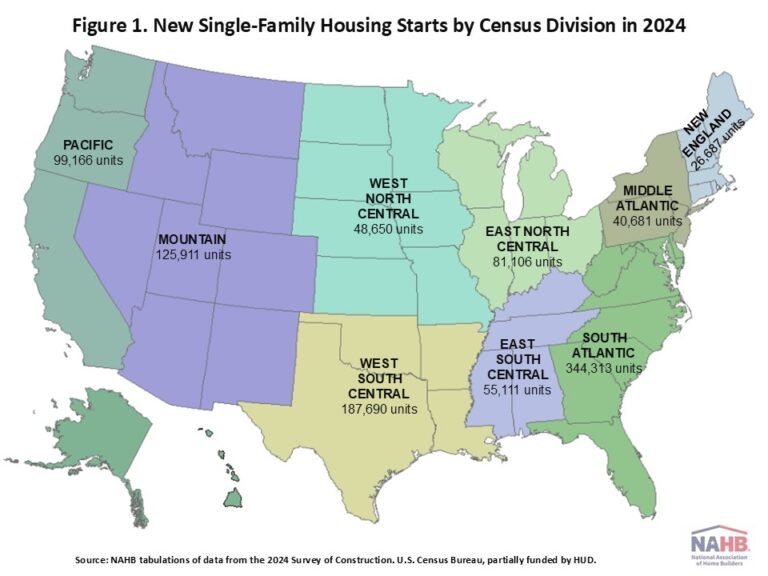
Despite persistently high mortgage rates, elevated financing costs for builders, and a shortage of buildable lots, single-family starts rebounded in 2024, following two straight years of declines. According to the National Association of Home Builders’ analysis of the 2024 Survey of Construction (SOC), a total of 1,009,315 new single-family units started construction nationwide. This is a 7% increase compared to 2023.

Among the nine Census divisions, the South Atlantic division led the nation with 344,313 starts in 2024, representing a 34% share. The second highest was the West South Central division at 187,690 starts, followed by the Mountain division with 125,911 starts. Collectively, these three divisions, covering 20 states and Washington, D.C., and representing approximately 41% of the United States, accounted for nearly two-thirds of the total new single-family housing starts in 2024.

Meanwhile, there were 99,166 new single-family units started in the Pacific division (10% of total starts) and 81,106 in the East North Central division (8%) in 2024. The other four divisions, including East South Central, West North Central, Middle Atlantic, and New England, accounted for the remaining 17% of the total new single-family housing starts.

In 2024, seven out of nine divisions experienced year-over-year growth in single-family starts. The Middle Atlantic division had the strongest performance among all regions, posting a 22% annual increase. In addition, five out of nine divisions surpassed the U.S. growth rate of 7%. Conversely, both the East South Central and West South Central divisions recorded declines in single-family housing starts.

Compared to the previous year, the New England and West South Central divisions experienced a deceleration in growth, while the East South Central division marked its second consecutive year of decreases. In contrast, the remaining six divisions reported an acceleration in growth. Despite regional disparities, the overall national trend in 2024 reflected a resilient housing market, even in the face of ongoing economic and supply-side challenges.

Discover more from Eye On Housing

Subscribe to get the latest posts sent to your email.


This article was originally published by a eyeonhousing.org . Read the Original article here. .


Elevated interest rates and economic uncertainty sent more home buyers to the sidelines in May as housing affordability conditions remain challenging.

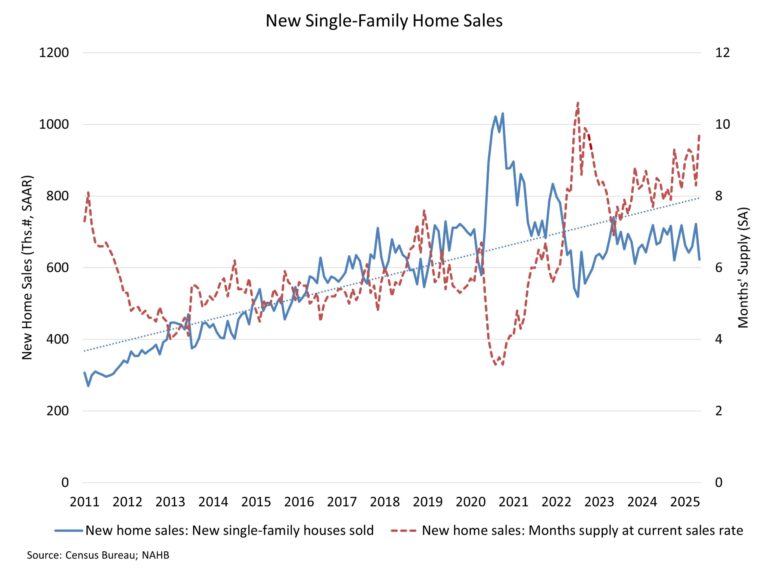
Sales of newly built single-family homes declined 13.7% in May, falling back to a seasonally adjusted annual rate of 623,000 according to newly released data from the U.S. Department of Housing and Urban Development and the U.S. Census Bureau. This was the slowest pace since October of last year, as mortgage rates averaged 6.83% in May. Sales were particularly slow in the South, with the pace of sales down 21% in May.

The slowing of the housing market has occurred despite the growing use of of builder sales incentives, including 37% of home builders reporting cutting prices in the June NAHB/Wells Fargo Housing Market Index survey.

On a year-to-date basis, new home sales are 3.2% lower thus far in 2025. As a result of slowing home sales conditions, inventory continues to rise, marking an elevated 9.8 months’ supply in May.

As estimated by NAHB, total months’ supply, defined as a combination of current new and resale single-family inventory, now stands at 5.2. This is the highest sales-adjusted inventory level since 2015 and will place downward pressure on housing construction starts in the months ahead.

A new home sale occurs when a sales contract is signed, or a deposit is accepted. The home can be in any stage of construction: not yet started, under construction or completed. In addition to adjusting for seasonal effects, the May reading of 623,000 units is the number of homes that would sell if this pace continued for the next 12 months.

New single-family home inventory continued to rise with 507,000 residences marketed for sale as of May. This is 1.4% higher than the previous month and 8.1% higher than a year ago. At the current sales pace, the months’ supply for new homes stands at 9.8 compared to 8.5 a year ago. Completed, ready-to-occupy new home inventory stood at 115,000 in May, up 29% compared to a year ago on a non-seasonally adjusted basis. However, this measure was higher at the end of 2024.

The median new home sale price in May was $426,600, compared to $414,300 a year ago. This measure reflects the fact that higher income borrowers face fewer budget constraints than lower income prospective home buyers. New home sales priced below $500,000 were down 15% in May of 2025 compared to the May 2024.

Regionally, on a year-to-date basis, new home sales are down 20.7% in the Northeast, 11.9% in the Midwest and 1.8% in the South. Sales are up 2.1% in the West.

Discover more from Eye On Housing

Subscribe to get the latest posts sent to your email.


This article was originally published by a eyeonhousing.org . Read the Original article here. .

A sharp decline in multifamily production pushed overall housing starts down in May, while single-family output was essentially flat due to economic and tariff uncertainty along with elevated interest rates.

Overall housing starts decreased 9.8% in May to a seasonally adjusted annual rate of 1.26 million units, according to a report from the U.S. Department of Housing and Urban Development and the U.S. Census Bureau.

The May reading of 1.26 million starts is the number of housing units builders would begin if development kept this pace for the next 12 months. Within this overall number, single-family starts increased 0.4% to a 924,000 seasonally adjusted annual rate and are down 7.3% compared to May 2024. The volatile multifamily sector, which includes apartment buildings and condos, decreased 29.7% in May to an annualized 332,000 pace.

On a year-to-date basis, single-family starts are down 7.1%. In contrast, multifamily 5-plus unit starts are up 14.5% as more prospective home buyers remain on the sidelines helping rental demand.

Single-family permits and construction starts are down on a year-to-date basis for 2025 for what has been a disappointing spring housing market, given ongoing elevated mortgage interest rates, challenging housing affordability conditions led by higher construction costs, and macroeconomic uncertainty. NAHB is forecasting that 2025 will end with a decline for single-family housing starts.

The number of single-family homes currently under construction totaled 623,000 homes as of May. This is 1.3% lower than April, 7.6% lower than a year ago and 25% lower than the post-Great Recession peak level in June 2022. There were 752,000 apartments under construction in June, 4.6% lower than May and 18.2% lower than a year ago.

On a regional and year-to-date basis, combined single-family and multifamily starts were 21.1% higher in the Northeast, 10.8% higher in the Midwest, 6.8% lower in the South and 1.6% lower in the West.

Overall permits decreased 2% to a 1.39-million-unit annualized rate in May. Single-family permits decreased 2.7% to an 898,000-unit rate and are down 6.4% compared to May 2024. Multifamily permits decreased 0.8% to a 495,000 pace.

Looking at regional permit data on a year-to-date basis, permits were 17.2% lower in the Northeast, 6% higher in the Midwest, 5.4% lower in the South and 3.7% lower in the West.

Discover more from Eye On Housing

Subscribe to get the latest posts sent to your email.


This article was originally published by a eyeonhousing.org . Read the Original article here. .


The Census estimate of new home sales posted an unexpected gain in April even as builders and consumers continue to deal with economic uncertainty, elevated interest rates and rising building material costs.

Sales of newly built, single-family homes in April increased 10.9% to a 743,000 seasonally adjusted annual rate from a downwardly revised March number, according to newly released data from the U.S. Department of Housing and Urban Development and the U.S. Census Bureau. The pace of new home sales in April was up 3.3% compared to a year earlier.

The April new home sales figure may be revised as it runs counter to market commentary and the fact that builder sentiment moved markedly lower in May. A less volatile look at the market would be the year-to-date figures, which show new home sales are down 1.2% thus far in 2025 on elevated interest rates, ongoing policy uncertainty and rising construction costs.

Rising inventory in the resale market is likely to place pressure on both pricing and sales activity for home builders during the second half of the year. The April new home data reflects this as new home inventory is leveling off near a half million of residences marketed for sale, up just 1.6% from January.

In April, new home inventory totaled 504,000 residences marketed for sale. While this is 8.6% higher than a year ago, it is only 1.6% higher from January. At the current sales pace, the months’ supply for new home stands at 8.1 compared to 7.7 a year ago.

To further illustrate the challenges builders are facing during the spring home buying season, 61% of home builders are using various kinds of sales incentives, including mortgage rate buydowns, to facilitate sales due to lackluster demand.

A new home sale occurs when a sales contract is signed, or a deposit is accepted. The home can be in any stage of construction: not yet started, under construction or completed. In addition to adjusting for seasonal effects, the April reading of 743,000 units is the number of homes that would sell if this pace continued for the next 12 months. This estimate may be revised lower next month.

Further, when accounting for existing, single-family home sales (a market which is showing rising inventory levels), total home inventory (new plus existing homes) is at a 4.8 months’ supply as of April. This is up from 4.6 from March and up from 4.1 from a year ago. The current reading is the highest since late 2015. Prior analysis indicates that the market will face notable inventory impacts on production as this measure approaches 5.5.

The median new home sale price in April was $407,200, compared to $415,300 a year ago.

Regionally, on a year-to-date basis, new home sales are down 32.5% in the Northeast, 14.8% in the Midwest and 2.4% in the West. Sales are up 5.7% in the South.

Discover more from Eye On Housing

Subscribe to get the latest posts sent to your email.


This article was originally published by a eyeonhousing.org . Read the Original article here. .

Economic uncertainty stemming from tariff issues, elevated mortgage rates and rising building material costs pushed single-family housing starts lower in April.

Overall housing starts increased 1.6% in April to a seasonally adjusted annual rate of 1.36 million units, according to a report from the U.S. Department of Housing and Urban Development and the U.S. Census Bureau.

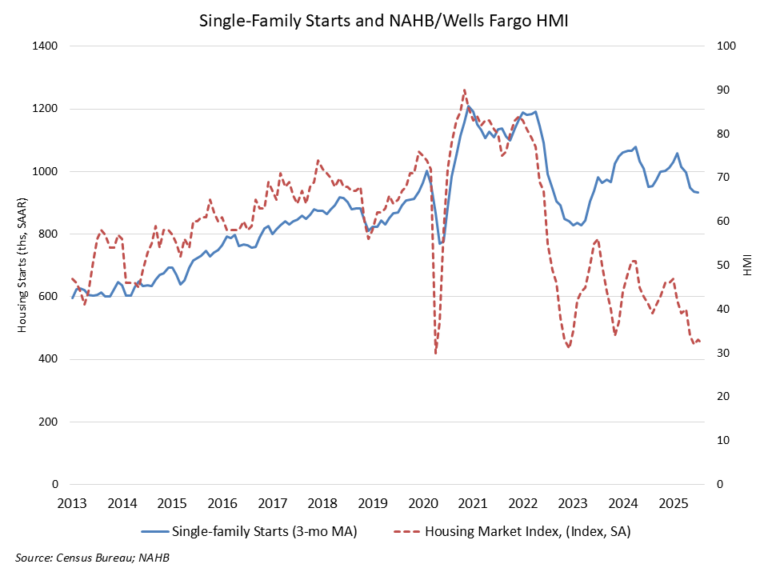
The April reading of 1.36 million starts is the number of housing units builders would begin if development kept this pace for the next 12 months. Within this overall number, single-family starts decreased 2.1% to a 927,000 seasonally adjusted annual rate and are down 12.0% compared to April 2024. On a year-to-date basis, single-family starts are down 7.1%. The three-month moving average (a useful gauge given recent volatility) is down to 991,000 units, as charted below.

The multifamily sector, which includes apartment buildings and condos, increased 10.7% to an annualized 434,000 pace. The three-month moving average for multifamily construction has trended upward to a 406,000-unit annual rate. On a year-over-year basis, multifamily construction is up 30.7%.

On a regional and year-to-date basis, combined single-family and multifamily starts were 19.8% higher in the Northeast, 4.4% higher in the Midwest, 3.4% higher in the West , and 7.4% lower in the South.

The total number of single-family homes and apartments under construction was 1.4 million units in April. This is the lowest total since June 2021. Total housing units now under construction are 14.3% lower than a year ago. Single-family units under construction fell to a count of 630,000—down 7.1% compared to a year ago. The number of multifamily units under construction has fallen to 788,000 units. This is down 15.6% compared to a year ago.

On a 3-month moving average basis, there are currently 1.3 apartments completing construction for every one that is beginning construction. While apartment construction starts are down, the number of completed units entering the market is rising due to prior elevated construction levels. Year-to-date, the pace of completions for apartments in buildings with five or more units is down 3.4% in 2025 compared to 2024. An elevated pace of completions in 2025 for multifamily construction will place some downward pressure on rent growth.

Overall permits decreased 4.7% to a 1.41-million-unit annualized rate in April. Single-family permits decreased 5.1% to a 922,000-unit rate and are down 6.2% compared to April 2024. Multifamily permits decreased 3.7% to a 490,000 pace but are up 2.9% compared to April 2024.

Looking at regional permit data on a year-to-date basis, permits were 5.1% higher in the Midwest, 3.5% lower in the West, 3.8% lower in the South, and 20.3% lower in the Northeast.

Discover more from Eye On Housing

Subscribe to get the latest posts sent to your email.


This article was originally published by a eyeonhousing.org . Read the Original article here. .

A modest decline in mortgage rates and lean existing inventory helped boost new home sales in March even as builders and consumers contend with uncertain market conditions.

Sales of newly built, single-family homes in March increased 7.4% to a 724,000 seasonally adjusted annual rate from a revised January number, according to newly released data from the U.S. Department of Housing and Urban Development and the U.S. Census Bureau. The pace of new home sales in March was up 6.0% compared to a year earlier.

The March new home sales data shows that demand continues to be present in the market, provided affordability conditions permit a purchase. An increase in economic certainty would be a big boost to future sales conditions. Lower mortgage interest rates helped boost the pace of new home sales in March. In February, the average 30-year fixed rate mortgage was 6.84%, while in March it fell to 6.65%.

A new home sale occurs when a sales contract is signed, or a deposit is accepted. The home can be in any stage of construction: not yet started, under construction or completed. In addition to adjusting for seasonal effects, the March reading of 724,000 units is the number of homes that would sell if this pace continued for the next 12 months.

New single-family home inventory in March continued to rise to a level of 503,000, up 7.9% compared to a year earlier. This represents an 8.3 months’ supply at the current building pace. This level of supply continues to be reasonable given that the resale, single-family months’ supply remains lean at just 3.4. The count of completed, ready-to-occupy homes available for sale increased to 119,000, up 34% from a year ago.

However, the March data also is showing signs that the total amount of inventory in the new construction space has slowed given soft housing conditions at the start of 2025. For example, the count of new homes available for sale that are under construction (263,000 in March) is down 5% year-over-year and 6% lower than the non-seasonally adjusted peak count set in October 2024.

The median new home sale price in March was $403,600, down 7.5% from a year ago. Sales were particularly strong at lower price levels. Compared to March 2024, new homes sales were 33% higher for homes priced below $300,000 and 28% higher for new homes priced between $300,000 and $400,000.

Regionally, on a year-to-date basis, new home sales are up 12.9% in the South, but are down 32% in the Northeast, 18.3% in the Midwest and 6% in the West.

Discover more from Eye On Housing

Subscribe to get the latest posts sent to your email.


This article was originally published by a eyeonhousing.org . Read the Original article here. .
Pin It