This article was originally published by a www.houzz.com . Read the Original article here. .
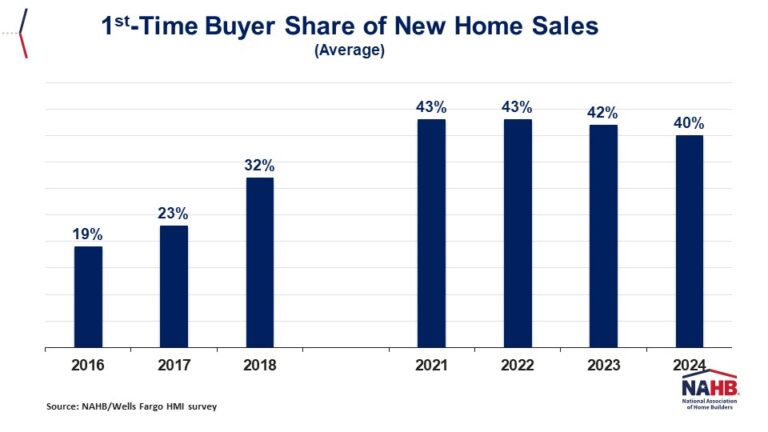
On average, 40% of builders’ single-family home sales so far in 2024 have been made to first-time home buyers, according to the most recent NAHB/Wells Fargo Housing Market Index survey (HMI). That share has doubled since 2016, when only 19% of builders’ sales went to first-time buyers.
Our limited time-series on this topic in the HMI survey indicates that first-time home buyers purchased an increasing share of new homes between 2016 and 2021, when the proportion rose from 19% to 43%. Unfortunately, the series has a two-year hiatus (2019 and 2020) when no data are available.
Since 2021, however, growth in the new home first-time buyer share has stopped. After holding steady at 43% in 2022, the share has lost ground in each of the past two years, slipping to 42% in 2023 and then to 40% in 2024.
More granular analysis shows there is a direct correlation between the first-time buyer share and builder size. In other words, the larger the builder, the more likely it is for a higher share of its sales to go to people buying a home for the first time.
To be more precise, builders with 1 to 5 single-family starts a year reported that only about 18% of their sales so far in 2024 have gone to first-time buyers. That average increases to 21% among builders with 6 to 24 starts, to 34% among those with 25 to 99 starts, and reaches 44% among builders who start at least 100 homes a year.
Discover more from Eye On Housing
Subscribe to get the latest posts sent to your email.
This article was originally published by a eyeonhousing.org . Read the Original article here. .
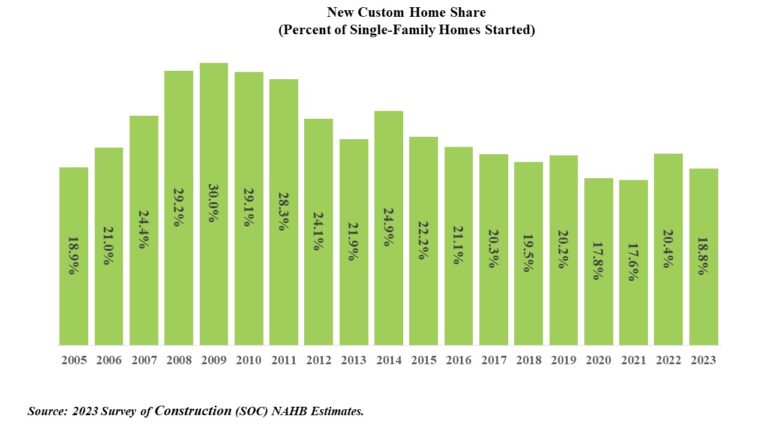
In 2023, 18.8 percent of all new single-family homes started were custom homes. This share decreased from the 20.4 percent recorded in 2022, according to data tabulated from the Census Bureau’s Survey of Construction (SOC). The custom home market consists of contractor-built and owner-built homes—homes built one at a time for owner occupancy on the owner’s land, with either the owner or a builder acting as a general contractor. The alternatives are homes built-for-sale (on the builder’s land, often in subdivisions, with the intention of selling the house and land in one transaction) and homes built-for-rent.
In 2023, 71.5 percent of the single-family homes started were built-for-sale, and 9.7 percent were built-for-rent. At an 18.9 percent share, the number of custom homes started in 2023 was 177,850, falling from 207,472 in 2022.
The quarterly published statistics show that the custom home share of single-family starts showed gains in the second quarter of 2024 after some recent slowing. Although the quarterly statistics are timelier, they lack the geographic detail available in the annual data set.
When analyzed across the 9 census divisions, the annual data show that the highest custom home share in 2023 was 35.5 percent in the East South-Central division. While the lowest share was in the West South-Central division, where the share was only 11.9 percent. The share of custom homes across U.S. divisions are showed in the map below.
Discover more from Eye On Housing
Subscribe to get the latest posts sent to your email.
This article was originally published by a eyeonhousing.org . Read the Original article here. .
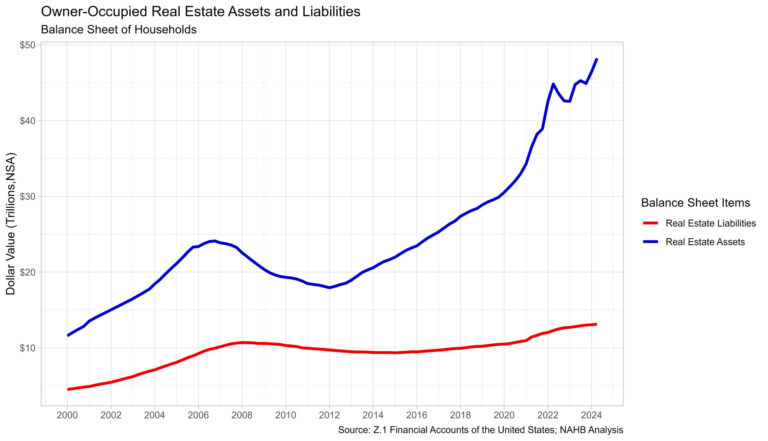
Owners’ equity share of household real estate assets remained above 70% for the tenth straight quarter, continuing to mark the highest levels of this share since the late 1950s. The share in the second quarter of 2024 was 72.7%, up from a year ago when it stood at 71.4%. Notably, this is the highest reading of owners’ equity share since the fourth quarter of 1958, when it was 73.3%.
Household real estate assets represent all types of owner-occupied housing including farm houses and mobile homes, as well as second homes that are not rented, vacant homes for sale, and vacant land at current market value. Household real estate liabilities represent all outstanding residential mortgages as well as loans made under home equity lines of credit and home equity loans secured by junior liens. Owners’ equity is the difference between the current market value of the household’s property and the existing debt secured by the property (assets – liabilities).
The market value of household real estate assets rose from $46.4 trillion to $48.2 trillion in the second quarter of 2024 according to the most recent release of U.S. Federal Reserve Z.1 Financial Accounts. Over the year, household real estate assets were 7.7% higher in the second quarter following a 9.2% increase in the first quarter.
Household real estate secured liabilities, i.e. mortgages, home equity loans, and HELOCs, increased 0.8% over the second quarter to $13.1 trillion. This level is 2.6% higher than the second quarter of 2023, the same as the increase in the first quarter of 2.6%.
Discover more from Eye On Housing
Subscribe to get the latest posts sent to your email.
This article was originally published by a eyeonhousing.org . Read the Original article here. .
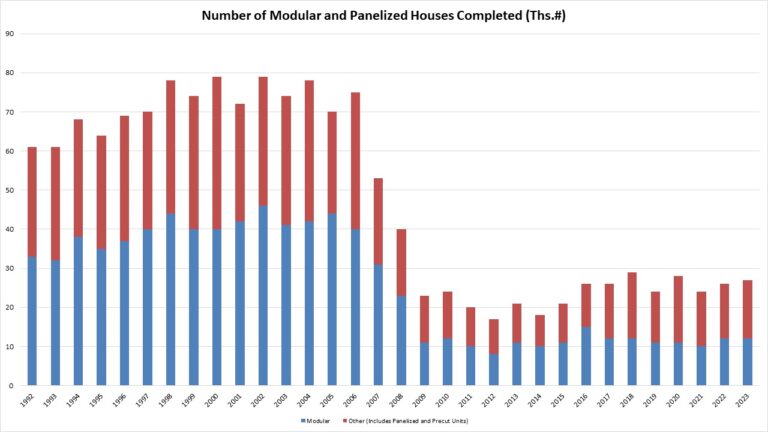
The total market share of non-site built single-family homes (modular and panelized) was just 3% of single-family homes in 2023, according to completion data from the Census Bureau Survey of Construction data and NAHB analysis. This is a slight increase from the 2% share in 2022. This share has been steadily declining since the early-2000s despite the high-level of interest for non-site built construction. This low market share in fact runs counter to some media commentary on off-site construction suggesting recent gains. Nonetheless, there exists potential for market share gains in the years ahead due to the need to increase productivity in the residential construction sector.
In 2023, there were 27,000 total single-family units built using modular (12,000) and panelized/pre-cut (15,000) construction methods, out of a total of 999,000 single-family homes completed. It is worth noting that the Census definitions of off-site construction are relatively narrow. In a separate survey, the Home Innovation Research Labs Survey of U.S. Home Builders has a higher share for panelized construction (5-12%) due to a wider definition of “panelized” construction.
While the Census-measured market share is small, there exists potential for expansion. This 3% market share for 2023 represents a decline from years prior to the Great Recession. In 1998, 7% of single-family completions were modular (4%) or panelized (3%). This marked the largest share for the 1992-2023 period.
One notable regional concentration is found in the Northeast and Midwest. These two regions tie for the highest market share of homes built using non-site build construction methods. In the Northeast, 5% (4,000 homes) of the region’s 61,000 housing units were completed using non-site built construction methods. At the same time, in the Midwest, 5% market share (6,000 homes) of the region’s 126,000 housing units were completed using non-site build construction methods.
With respect to multifamily construction, approximately 7% of multifamily buildings (properties, not units) were built using modular and panelized methods, marking the highest level in the last two decades. This is significantly higher than the 2% share in 2022 and 1% share in 2018-2021. It is notable that modular construction methods accounted for 5% of this share, whereas in previous years it was only panelized construction methods that made up the small share of non-site build methods in multifamily construction. Prior to last year, the highest levels of modular and panelized methods share in multifamily construction was in 2000 and 2011, where 5% of multifamily buildings were constructed with modular (1%) or panelized construction methods (4%).
Discover more from Eye On Housing
Subscribe to get the latest posts sent to your email.
This article was originally published by a eyeonhousing.org . Read the Original article here. .
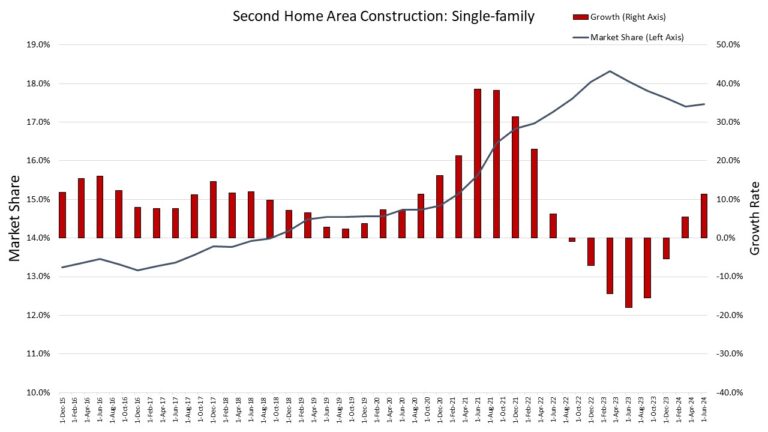
NAHB’s featured topic for the second quarter HBGI reveals that 17.5% of single-family and 8.6% of multifamily construction takes place in second home areas. Recent NAHB analysis found that the total count of second homes across the US was 6.5 million, which accounts for 4.6% of the total housing stock. For this analysis, a second home area is a county that has a second home share greater than 10.3% of the county’s total housing stock (these counties fall within the 75th and above percentile of the second home stock share distribution). There are 788 counties that are considered a second home area based on this definition.
Single-family
Single-family permit data shows that the market share for construction in second home areas has grown by over four percentage points in the past nine years. The earliest data, which is the fourth quarter of 2015, shows that second home areas had a market share of 13.2%. As of the second quarter of 2024, the market share for this geography increased to 17.5%. However, this latest reading is down from a peak of 18.3% in the first quarter of 2023.
The peak growth rate in construction for second homes areas was at 38.5% in the third quarter of 2021. The first recorded decline in the growth rate occurred in the third quarter of 2022. This downward growth rate was followed by five quarters of declines until the first quarter of 2024. Second home areas have averaged a growth rate of 9.1% between the fourth quarter of 2015 and the second quarter of 2024, while non-second home areas averaged single-family a growth rate of 5.1% over the same period.
Multifamily
Although smaller, the market share for second home areas has also grown for multifamily construction. The market share was 5.5% in the fourth quarter of 2015 and is now 8.6%, a 3.1 percentage point increase. This increase in market share has been more volatile than single-family, as growth in construction has not been as consistent for multifamily in second home areas.
There have been three periods where construction growth for multifamily experienced declines in these areas, such as in 2017 and early 2021. The third period of decline is ongoing, as there have been two consecutive quarters where the growth rate has been negative to start 2024. The latest growth rate is a11.8% decline. This is down from a peak of 53.1% in the third quarter of 2022, as multifamily construction has slowed nationwide.
Discover more from Eye On Housing
Subscribe to get the latest posts sent to your email.
This article was originally published by a eyeonhousing.org . Read the Original article here. .
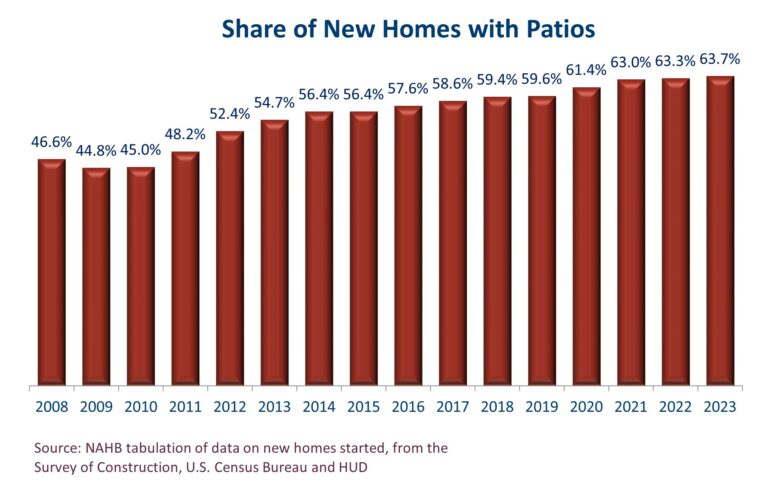
The share of new homes with patios increased to yet another record high in 2023. Of the roughly 950,000 single-family homes started during the year, 63.7% came with patios. This is up from 63.3% in 2022 and marks the eighth consecutive year the percentage set a new record high. The source for these numbers is NAHB tabulation of data from the Survey of Construction (conducted by the U.S. Census Bureau with partial funding from the Department of Housing and Urban Development).
Historically, fewer than half of new homes came with patios during the 2008-2011 period of extreme weakness in housing markets. But soon thereafter, the share jumped to 52.4% in 2012 and has been climbing ever since. The percentage has now increased in thirteen of the past fourteen years. The only exception was 2015, when the percentage was unchanged.
While patios for new homes have generally become more common over time, the parts of the country where they tend to be most common have remained consistent. At the low end, only 17% percent of new single-family homes built in New England and 20% in the Middle Atlantic came with patios in 2023. At the high end, the incidence of patios on new homes was over 80% in the West South Central and close to 70% in the South Atlantic and Mountain divisions. The geographic tendencies are similar to the ones reported in last year’s post.
Additional detail on the characteristics of new-home patios is available from the Annual Builder Practices Survey (BPS) conducted by Home Innovation Research Labs.
For the U.S. as a whole, the 2024 BPS report (based on homes built in 2023, like the SOC-based statistics cited above) shows that the average size of a new-home patio is about 290 square feet, but with considerable geographic variation. The average is over 400 square feet in the East South Central and about 380 square feet in New England; but under 200 square feet in the West South Central, and only a little over 200 square feet in the adjacent West North Central division.
In most parts of the country, poured concrete dominates all other building materials used in new-home patios. In the East South Central, for instance, poured concrete accounts for over 90% of new-home patios on a square-foot basis. To the extent that there are exceptions, they occur on the east coast. In the South Atlantic, concrete and brick pavers each have about a quarter of the market, and poured concrete has less than half. In New England, the market is more or less equally divided among poured concrete, concrete pavers and natural stone. In the Mid-Atlantic, brick pavers are the most popular choice for new-home patios by a substantial margin.
Discover more from Eye On Housing
Subscribe to get the latest posts sent to your email.
This article was originally published by a eyeonhousing.org . Read the Original article here. .
According to NAHB analysis of quarterly Census data, the count of multifamily, for-rent housing starts declined significantly during the second quarter of 2024. For the quarter, 88,000 multifamily residences started construction. Of this total, 83,000 were built-for-rent. This marks a notable 37% decline from the second quarter of 2023 for the multifamily built-for-rent category.
The market share of rental units of multifamily construction starts was flat at a still elevated 94% for the second quarter as the small condo market remained held back due to higher interest rates. In contrast, the historical low share of 47% was set during the third quarter of 2005, during the condo building boom. An average share of 80% was registered during the 1980-2002 period.
For the second quarter, there were just 5,000 multifamily condo unit construction starts.
An elevated rental share of multifamily construction is holding typical apartment size below levels seen during the pre-Great Recession period. According to second quarter 2024 data, the average square footage of multifamily construction starts was relatively unchanged at 1,034 square feet. The median declined to 955 square feet. These estimates are near multidecade lows.
Discover more from Eye On Housing
Subscribe to get the latest posts sent to your email.
This article was originally published by a eyeonhousing.org . Read the Original article here. .
Wood framing remains the most dominant construction method for completed single-family homes in the U.S., according to NAHB analysis of 2023 Census Bureau data. For 2023 completions, 93% of new homes were wood-framed, another 7% were concrete-framed homes, and less than half a percent were steel-framed.
On a count basis, there were 930,000 wood-framed homes completed in 2023. This was a 3% decrease compared to the 2022 total. The wood-framed market share decreased to 93% in 2023, after it increased for three consecutive years, from 2019 (90%) to 2022 (94%). As noted above, steel-framed homes are relatively uncommon, with 3,000 housing completions in 2023, the same amount as the 2021 and 2022 completions.
Meanwhile, the concrete-framed market share increased from 6% in 2022 to 7% in 2023. On a count basis, there were 65,000 concrete-framed homes completed in 2023, up 3% from the previous year. This is the first increase after three straight years of declines (down 13% in 2020, 5% in 2021 and 11% in 2022).
Non-wood based framing methods are primarily concentrated in the South due to residential resiliency requirements. In 2023, concrete-framed homes made up 11% of all homes completed in the South. Additionally, approximately two-thirds of steel-framed homes completed in 2023 were in the South.
Discover more from Eye On Housing
Subscribe to get the latest posts sent to your email.
This article was originally published by a eyeonhousing.org . Read the Original article here. .
The total share of workers teleworking or working from home for pay has increased from 2023, according to the latest Telework or Work at Home for Pay Survey from the Bureau of Labor Statistics. In June 2023, 19% of the labor force teleworked on a non-seasonally adjusted basis. This share rose to 22.3% in June 2024, even though the total number of workers remained stable. However, the average weekly hours of remote work among teleworkers decreased slightly by 1.7 hours, from 28.7 to 27 hours a week. This decline is due to a shift toward hybrid work, with the proportion of people working all their hours remotely dropping from 53.2% to 48.4%.
Across all occupations, the share of teleworkers has increased, while the average weekly telework hours have declined. Management, professional, and related occupations had the highest share of teleworkers, with 37.8% working remotely in June, averaging 27.1 hours per week. In contrast, natural resources, construction, and maintenance occupations had the lowest share, with only 3.0% teleworking for an average of 21.4 hours a week.
By industry, financial activities saw the largest increase in teleworkers, rising by 7.5 percentage points from 44.9% in June 2023 to 52.4% in June 2024. Meanwhile, the average weekly telework hours for this industry decreased modestly from 30.4 hours to 28.8 hours. The information industry, previously the leader in telework, increased by 3.8 percentage points, from 47.8% to 51.6%. Its average weekly telework hours declined by 1.1 hours, from 31.4 to 30.3 hours.
The increase in teleworking has significant implications for the housing and real estate market. With more people working from home, there may be a growing demand to remodel their current homes to have dedicated office spaces. Additionally, commercial real estate could face challenges as businesses reconsider their office space needs, potentially leading to an increase in flexible workspaces or a reevaluation of leasing strategies.
There are also policy proposals that NAHB supports which aim to repurpose underused commercial spaces into residential real estate, such as the “Revitalizing Downtowns and Main Streets Act” that proposes a 20% tax credit to encourage converting vacant commercial properties into affordable housing, thereby addressing the nationwide housing shortage.
Discover more from Eye On Housing
Subscribe to get the latest posts sent to your email.
This article was originally published by a eyeonhousing.org . Read the Original article here. .
Designers often recommend giving extra consideration to elements that you interact with the most. In a kitchen, that can be a lot of things, but the kitchen sink is one area that always sees a lot of action. So it makes sense to put a little more effort into designing the sink area and choosing components.
These days, many sink manufacturers offer designs called workstations, which feature add-ons such as cutting boards, strainers and prep bowls. “I always recommend a sink with gadgets,” designer Brittany Steptoe-Wright of BSW Design says. “For example, the sink in this project [shown here] is a single, large undermount sink, but it has a colander, cutting board and drying rack that sit inside on a small lip and provide so much function. It’s a game changer.”