Tag

Share

Browsing


An earlier post described how the top ten builders  in the country accounted for 43.6% of new single-family closings in 2025. BUILDER magazine has now released additional data on the top ten builders within each of the 50 largest new home markets in the U.S., ranked by single-family permits. It is important to note that this post does not focus on the top ten largest home builders nationally; instead, it analyzes the top ten list within each of the largest 50 new housing markets.

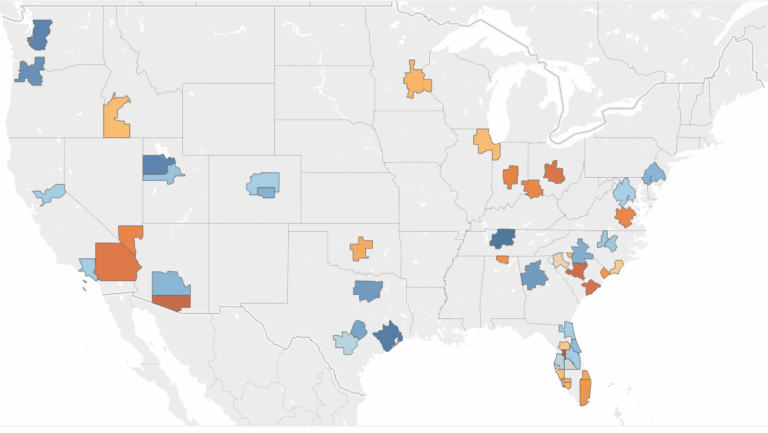
The 2025 data show that the top 10 builder concentration in the 50 largest markets ranged from 53.4% in Nashville-Davidson-Murfreesboro-Franklin, TN to 99.5% in Tucson, AZ. In ten metro areas, the top ten builders’ market share exceeded 90%. Across all 50 metro areas, the average market share of the top 10 builders was 78.9%, down slightly from 79.3% in 2024.  

Looking at the results on a map reveals that South Carolina, southern Florida, and parts of the Midwest continue to include multiple highly concentrated markets, while Texas, the Northwest and the Mountain West markets have lower levels of concentration.

D.R. Horton made the top ten builder list in 47 markets, followed closely by Lennar at 45 markets. Both companies are present within the same top ten builder list in 42 metro areas. PulteGroup was next with 36 metro markets, followed by Meritage Homes and NVR with 22 and 20 metro markets, respectively.

From 2024 to 2025, 20 metro areas saw an increase in their top 10 builders’ market share, lower than the 27 increases from 2023 to 2024. The largest increases were seen in:

Tucson, AZ (+17.1 percentage points, 99.5%)

Miami-Fort Lauderdale-West Palm Beach, FL (+16.9 percentage points, 89.3%)

Richmond, VA (+8.7 percentage points, 91.3%)

Wilmington, NC (+8.4 percentage points, 80.8%)

On the other hand, 26 metro areas saw a decline in their top 10 builders’ market share from 2024 to 2025, up from 20 decreases from 2023 to 2024. Six metro areas experienced a double-digit decrease in 2025:

Philadelphia-Camden-Wilmington, PA-NJ-DE-MD (-18.2 percentage points, 69.3%)

Atlanta-Sandy Springs-Roswell, GA (-13.4 percentage points, 63.4%)

Jacksonville, FL (-12.1 percentage points, 74.4%)

Cape-Coral-Fort Myers, FL (-12.0 percentage points, 84.2%)

Salt Lake City-Murray, UT (-11.6 percentage points, 58.2%)

Spartanburg, SC (-10.4 percentage points, 83.1%)

The remaining four largest markets are new to the top 50 market list in 2025: Wildwood-The Villages, FL; Huntsville, AL; Punta Gorda, FL; and Colorado Springs, CO


This article was originally published by a eyeonhousing.org . Read the Original article here. .
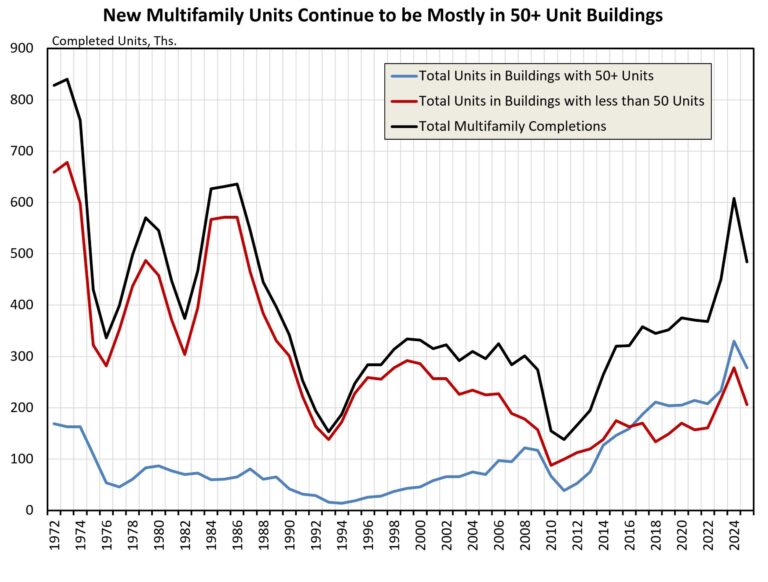

Following the highest number of multifamily completions in nearly 40 years in 2024, completions declined in 2025 to 484,000, according to NAHB analysis of the Census Bureau’s Survey of Construction. For the ninth consecutive year, a majority of new multifamily units were in buildings with 50 or more units (labeled as high-density buildings) at 57%, the highest share since 2021.

Dating back to the earliest estimates in the series (1972), multifamily units have historically been built in buildings with less than 50 units (low-medium density buildings). This trend reversed in 2017 and has remained unchanged through 2025, with a majority of new multifamily units being located in high-density buildings. Of the total 484,000 multifamily units completed in 2025, 278,000 (57%) were in high-density buildings while the remaining 206,000 (43%) were in low-medium density buildings.

Regional Distribution

The South continued to be the leading region in terms of units completed, down from 292,000 in 2024 to 217,000 completions in 2025. The South accounted for 45% of the total multifamily completions; the West held 26% (127,000), the Northeast 16% (79,000), and the Midwest 13% (63,000). The Midwest was the only region where low-medium density completions outpaced those in high-density buildings. The Midwest had 38,000 completions in low-medium density compared to 25,000 units in high-density buildings.

Conversely, the South, West and Northeast had more high-density completions than completions in low-medium density buildings. For the South, there were 122,000 units in high-density buildings and 95,000 low-medium density units. The West had 74,000 units in high-density buildings and 53,000 low-medium density units. The Northeast featured the largest divergence with 58,000 high-density units and 21,000 low-medium density.

As a share of regional completions, units in high-density buildings reached a new high in the Northeast at 73%. In the South, this share was up from 50% in 2024 to 56% in 2025. The West saw a similar rise, from 50% to 58% in 2025. The Midwest was the only region where this share declined, from 67% in 2024 to just 40% of completions in 2025.

Built-for-Rent

Among multifamily units completed in 2025, 95% were built-for-rent at 461,000. Over half of these units (59%) were in a building with 50 units or more, the highest share since 2021 (59%). This was the ninth straight year where most of multifamily rental-units were in high-density buildings. The second largest share was split between 30-49 unit buildings and 20-29 unit buildings, as both represented 15% of completed units in 2025. No other building category accounted for over 10% of completions in 2025.

Built-for-Sale

The number of multifamily units built-for-sale fell from 29,000 in 2024 to 23,000 in 2025. High-density buildings continued to be the primary type of building where these units were built, with 32% of built-for-sale units being completed in buildings with 50+ units. This share was down from 40% in 2024. The largest gain in market share for multifamily built-for-sale units was for buildings with 10-19 units, rising from 13% in 2024 to 24% in 2025 and making it the second largest segment of multifamily units built-for-sale.


This article was originally published by a eyeonhousing.org . Read the Original article here. .
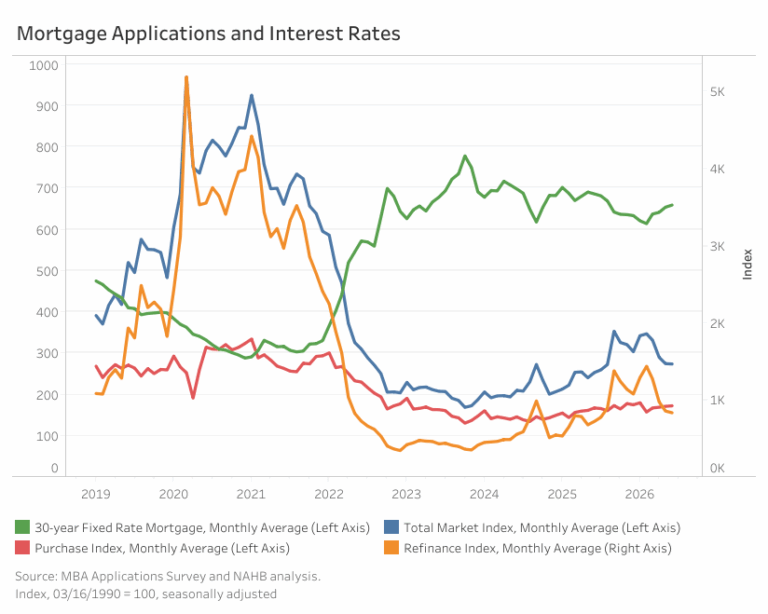

Mortgage applications stalled in June as higher mortgage rates dampened market activity. The Mortgage Bankers Association’s (MBA) Market Composite Index, a measure of total mortgage application volume, stayed relatively unchanged with a marginal decrease of 0.3% month-over-month on a seasonally adjusted basis. The decline was driven by a 2.5% decline in refinancing applications, which offset a modest 0.7% gain in purchase applications. Compared with a year earlier, however, total mortgage application activity remained 7.9% higher, with refinance applications up 15.6% and purchase applications rising 3.1%. Meanwhile, applications for adjustable-rate mortgages (ARM) decreased 9.4% over the month, bringing the ARM share of total applications to 8.2%.

The average contract rate for a 30-year fixed-rate mortgage increased 5 basis points (bps) to 6.59% in June, as markets priced in inflation risks and the possibility of the Federal Reserve increasing rates this year. Nonetheless, the rate remained 27 bps lower than its level a year ago.

By loan type, applications for ARMs decreased 9.4%, while fixed-rate mortgages (FRMs) increased about 0.4% from the previous month. On a year-over-year basis, applications for FRM and ARMs were up 6.9% and 22.4%, respectively. As of June 2026, the share of ARMs applications was down 0.8 percentage points from the prior month to 8.2% on a non-seasonally adjusted basis (NSA). Compared to a year ago, ARMs share were 0.6 percentage points higher. The average contract interest rate for 5/1 ARMs was 5.8% in June.

Loan sizes decreased across most categories in June, with ARM loans being the only exception. Consequently, the overall average loan size declined 3.4% to $393,800. The average purchase and refinance loan sizes decreased 1.8% to $456,500, and 5.8% to $302,500, respectively. The average ARM loan size edged up 0.8% to $944,800.


This article was originally published by a eyeonhousing.org . Read the Original article here. .


Mortgage application activity declined again in May as higher mortgage rates continued to suppress the market, although adjustable-rate mortgages (ARM) gained some traction. According to the Mortgage Bankers Association’s (MBA) Market Composite Index, a measure of total mortgage application volume, applications fell 5.5% month-over-month in May on a seasonally adjusted basis. The decline was driven by refinance activity, which dropped 12.3% over the month, while purchase applications posted a modest 1.8% increase. Compared with a year earlier, however, total mortgage application activity remained 14.2% higher, with refinance applications up 26.4% and purchase applications rising 6.2%. Meanwhile, applications for adjustable-rate mortgages (ARM) rose 3.1% over the month, nudging the ARM share of total applications up to 9.0%.

The average contract rate for a 30-year fixed-rate mortgage increased 13 basis points (bps) to 6.54% in May, as conflict in Iran pushed Treasury yields higher. Nonetheless, the rate remained 36 bps lower than its level a year ago. As borrowing costs moved up, borrowers showed some renewed interest in ARMs, which can offer lower initial rates than fixed-rate loans.

By loan type, applications for ARMs increased 3.0%, while fixed-rate mortgages (FRMs) decreased about 6.1% from the previous month. On a year-over-year basis, applications for FRM and ARMs were up 12.4% and 38.2%, respectively. As of May 2026, ARMs applications, including both purchase and refinance loans, accounted for 9.0% of total applications on a non-seasonally adjusted basis, up 0.7 percentage points from the prior month and 1.5 percentage points a year earlier. The average contract interest rate for 5/1 ARMs was 5.7% in April.

Loan sizes increased across most categories in May, with refinance loans being the main exception. Consequently, the overall average loan size edged up 2.5% to $407,600. The average purchase loan size increased 2.2% to $465,000, while the average refinance loan size declined 1.5% to $321,000. The average ARM loan size edged up, decreasing 1.9% to $937,200.


This article was originally published by a eyeonhousing.org . Read the Original article here. .


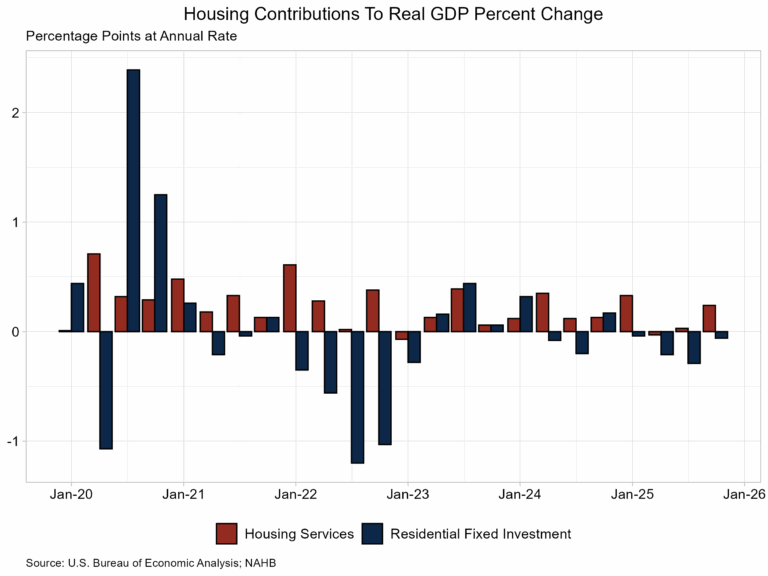
Housing’s share of the economy was 15.9% in the first quarter of 2026, according to the latest estimates of GDP produced by the Bureau of Economic Analysis. This share is down from 16.0% in the fourth quarter and is lower than 16.5% registered just one year ago. Residential construction, measured by residential fixed investment, fell at its fastest pace in over three years, while household expenditures on housing services continued to remain steady.

The more cyclical home building and remodeling component–residential fixed investment (RFI)–was 3.7% of GDP, down from 3.8% in the previous quarter. The second component, housing services, was 12.2% of GDP, down from 12.3% in the previous quarter. The graph below plots the share for housing services and RFI, along with housing’s total share of nominal GDP.

Housing service expenditures are much less volatile when compared to RFI due to the cyclical nature of RFI. Historically, RFI has averaged roughly 5% of GDP, while housing services have averaged between 12% and 13%, for a combined 17% to 18% of GDP. These shares tend to vary over the business cycle. However, the housing share of GDP lagged during the post-Great Recession period due to underbuilding, particularly in the single-family sector.

Residential Fixed Investment

In the first quarter, RFI subtracted 31 basis points from the headline GDP growth rate, marking the fifth consecutive quarter of negative contributions. This was the largest negative contribution since the fourth quarter of 2022. RFI was 3.7% of the economy, recording a $1.2 trillion seasonally adjusted annual pace. Among the two segments of RFI, private investment in structures fell 8.2%, while residential equipment rose 6.7%.

Breaking down the components of residential structures, single-family RFI fell 8.2%, while multifamily RFI rose 1.9%. This marks the second consecutive increase in RFI for multifamily structures, as the estimate in the fourth quarter of 2025 was revised to 1.7%, up from a decline of 3.6%. Permanent site structure RFI, which is made up of single-family and multifamily RFI, fell 5.9%. The “other structures” RFI category fell significantly, down 10.1% in the first quarter. This component consists primarily of manufactured homes, improvements, and dormitories. On a seasonally adjusted annual basis in the first quarter, private investment in permanent site structures was at $521.4 billion, while other structures totaled $627.9 billion.

Housing Services

The second impact of housing on GDP is the measure of housing services. Similar to the RFI, housing services consumption can be broken into two components. The first component, housing, includes gross rents paid by renters, owners’ imputed rent (an estimate of how much it would cost to rent owner-occupied units), rental value of farm dwellings, and group housing. The inclusion of owners’ imputed rent is necessary from a national income accounting approach, because without this measure, increases in homeownership would result in declines in GDP. The second component, household utilities, is composed of consumption expenditures on water supply, sanitation, electricity, and gas.

For the first quarter, housing services represented 12.2% of the economy or $3.9 trillion on a seasonally adjusted annual basis. Real housing services expenditure rose 1.3% at an annual rate in the fourth quarter. Real personal consumption expenditures for housing grew 1.2%, while real household utilities expenditures increased 1.6%.

Personal consumption expenditure (PCE) on housing services is the largest component of PCE, making up 18.0% in the first quarter. The second largest component of PCE is health care services, at 17.2%. Expenditure on services was $15.0 trillion on a seasonally adjusted annual basis in the fourth quarter, more than double the expenditure on goods ($6.7 trillion).


This article was originally published by a eyeonhousing.org . Read the Original article here. .


Soloway Designs Inc | Architecture + Interiors AIASave Photo
Looking Beyond a Resume

“From the start, Soloway Designs has set one of its goals to create and grow an exciting professional work environment,” says Marc Soloway, architect, founder and principal at Soloway Designs in Tucson, Arizona. “The atmosphere is light, but quality work is produced, deadlines are met and client satisfaction is at the forefront. Our office is a giant family, and as we grow, and during interviews, we endeavor to make sure each new hire will be a good fit.”

Soloway describes reviewing hundreds of resumes to source a new employee. He says the company is seeking “a personality that fits with our team. A quality work ethic, knowledge of what the position requires, desire for further growth are a few of the critical success factors for a potential new employee.”

To find these attributes, Soloway looks beyond what’s written on the page in front of him. “Resumes offer only a glimpse of a potential candidate,” he says.

“The resume and the candidate all too often are not a close fit. For example, a great project in the presented portfolio may indeed be commendable, but deeper discussion may question just how much the candidate actually understands and had uniquely contributed.

“During in-house interviews, we look beyond stated assignments and accomplishments,” Soloway says. “Discussion issues include: Tell me about a particular challenge and how you worked it out. What frustrates you most in the work environment? What are your primary professional growth goals for the coming year? And where do you see yourself in five years?”

Pros Share the Best Business Advice They Ever Received


This article was originally published by a
www.houzz.com . Read the Original article here. .


Restructure StudioSave Photo
1. Comfortable Sofa

Alison Felstead, owner and interior designer at Naibu Design, says, “When designing a living room, I’d recommend you select the sofa first as it is generally the largest piece of furniture in the room. It needs to be proportionate to the space it’s going into, and very comfortable. I will often choose an easy-to-clean fabric in a neutral color that’s simple to update with cushions.”

Giulianna del Popolo, principal designer at GDP Interior Design, adds, “I’d recommend specifying custom-made upholstery pieces from local makers. Not only does this support local manufacturing, but it’s generally easier to customize pieces to your clients’ needs, you can easily follow the progress of the manufacture, there’s often more flexibility with timing, and you won’t have the hassle — or cost — of relying on overseas shipping.

“If you consider the quality and life span of custom pieces, they are not necessarily more expensive than imported retail pieces. Superior frames and fill types guarantee a long-life product. If you choose a piece with clean lines and comfortable proportions, it can last your clients for years, with the option to update the look and feel with new upholstery or filling down the track.”

Should You Go the Custom Route in Your Projects?


This article was originally published by a
www.houzz.com . Read the Original article here. .


Restructure StudioSave Photo
1. Comfortable Sofa

Alison Felstead, owner and interior designer at Naibu Design, says, “When designing a living room, I’d recommend you select the sofa first as it is generally the largest piece of furniture in the room. It needs to be proportionate to the space it’s going into, and very comfortable. I will often choose an easy-to-clean fabric in a neutral color that’s simple to update with cushions.”

Giulianna del Popolo, principal designer at GDP Interior Design, adds, “I’d recommend specifying custom-made upholstery pieces from local makers. Not only does this support local manufacturing, but it’s generally easier to customize pieces to your clients’ needs, you can easily follow the progress of the manufacture, there’s often more flexibility with timing, and you won’t have the hassle — or cost — of relying on overseas shipping.

“If you consider the quality and life span of custom pieces, they are not necessarily more expensive than imported retail pieces. Superior frames and fill types guarantee a long-life product. If you choose a piece with clean lines and comfortable proportions, it can last your clients for years, with the option to update the look and feel with new upholstery or filling down the track.”

Should You Go the Custom Route in Your Projects?


This article was originally published by a
www.houzz.com . Read the Original article here. .


Housing’s share of the economy was 16.0% in the fourth quarter of 2025, according to the latest estimates of GDP produced by the Bureau of Economic Analysis. This share is down from 16.1% in the third quarter and is also lower than 16.3% as registered just one year ago. Residential construction, measured by residential fixed investment, subtracted from real GDP growth for each quarter in 2025, replicating a trend from 2022.

The more cyclical home building and remodeling component–residential fixed investment (RFI)–was 3.7% of GDP, down from 3.8% in the previous quarter. The second component, housing services, was 12.3% of GDP, constant from 12.3% in the previous quarter. The graph below plots the share for housing services and RFI along with housing’s total share of nominal GDP.

Housing service growth is much less volatile when compared to RFI due to the cyclical nature of RFI. Historically, RFI has averaged roughly 5% of GDP, while housing services have averaged between 12% and 13%, for a combined 17% to 18% of GDP. These shares tend to vary over the business cycle. However, the housing share of GDP lagged during the post-Great Recession period due to underbuilding, particularly in the single-family sector.

Residential Fixed Investment

In the fourth quarter, RFI subtracted 6 basis points from the headline GDP growth rate, marking the fourth consecutive quarter of negative contributions. RFI was 3.7% of the economy, recording a $1.2 trillion seasonally adjusted annual pace. Among the two segments of RFI, private investment in structures fell 1.6%, while residential equipment rose 2.1%.

Breaking down the components of residential structures, single-family RFI fell 5.2%, while multifamily RFI fell 3.6%. RFI for multifamily structures has contracted for nine consecutive quarters, recently due to declines in new supply and a shift in geography for multifamily construction to lower density markets. Permanent site structure RFI, which is made up of single-family and multifamily RFI, fell 4.9%. The “other structures” RFI category was the only one to rise, up 1.2% in the fourth quarter. This component consists primarily of manufactured homes, improvements, and dormitories. On a seasonally adjusted annual basis in the fourth quarter, private investment in permanent site structures was at $517.4 billion, while other structures totaled $640.6 billion.

Housing Services

The second impact of housing on GDP is the measure of housing services. Similar to the RFI, housing services consumption can be broken into two components. The first component, housing, includes gross rents paid by renters, owners’ imputed rent (an estimate of how much it would cost to rent owner-occupied units), rental value of farm dwellings, and group housing. The inclusion of owners’ imputed rent is necessary from a national income accounting approach, because without this measure, increases in homeownership would result in declines in GDP. The second component, household utilities, is composed of consumption expenditures on water supply, sanitation, electricity, and gas.

For the fourth quarter, housing services represented 12.3% of the economy or $3.9 trillion on a seasonally adjusted annual basis. Real housing services expenditures rose 2.0% at an annual rate in the fourth quarter. Real personal consumption expenditures for housing grew 1.2%, while real household utilities expenditures increased 7.9%.

Personal consumption expenditures (PCE) for housing services are the largest component of PCE, making up 18.0% in the fourth quarter. The second largest component of PCE is health care services, at 17.2%. Expenditures on services were $14.8 trillion on a seasonally adjusted annual basis in the fourth quarter, more than double the expenditures on goods ($6.6 trillion).


This article was originally published by a eyeonhousing.org . Read the Original article here. .
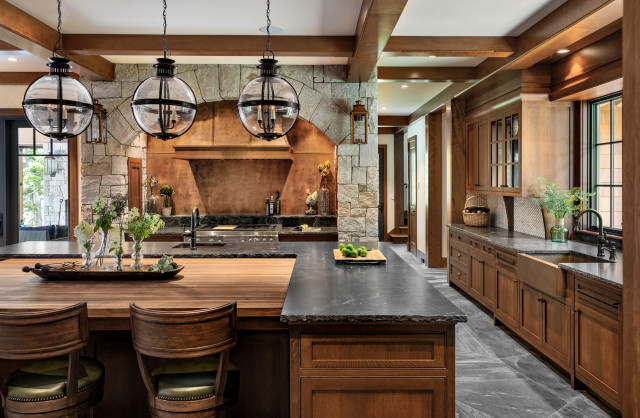

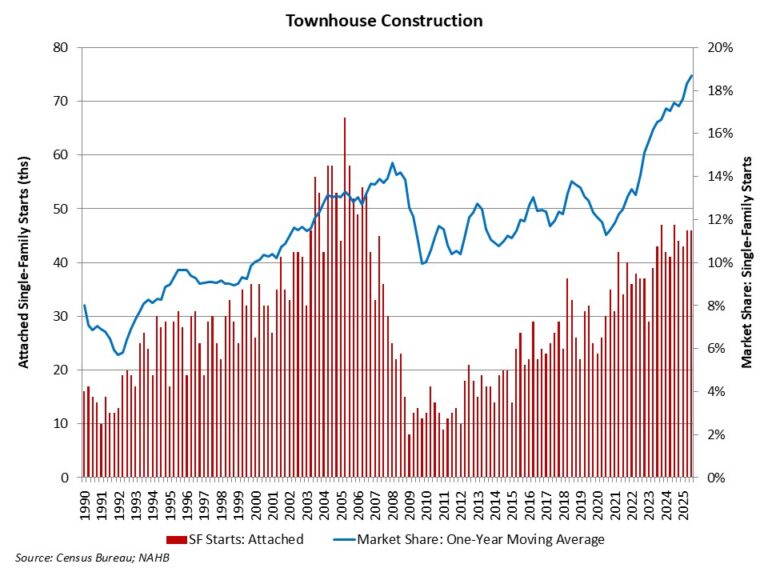
Townhouse construction gained single-family construction market share during the third quarter of 2025.

According to NAHB analysis of the most recent Census data of Starts and Completions by Purpose and Design, during the third quarter of 2025, single-family attached starts totaled 46,000. Over the last four quarters, townhouse construction starts totaled a strong 179,000 homes, which is 1% higher than the prior four-quarter period (177,000). Townhouses made almost 20% all of single-family housing starts for the third quarter of the year.

Using a one-year moving average, the market share of newly-built townhouses stood at 18.7% of all single-family starts for the third quarter. With gains over the last year, the four-quarter moving average market share is the highest on record, for data going back to 1985.

Prior to the current cycle, the peak market share of the last two decades for townhouse construction was set during the first quarter of 2008, when the percentage reached 14.6% on a one-year moving average basis. This high point was set after a fairly consistent increase in the share beginning in the early 1990s.

The long-run prospects for townhouse construction are positive given growing numbers of homebuyers looking for medium-density residential neighborhoods, such as urban villages that offer walkable environments and other amenities. Where it can be zoned, it can be built.


This article was originally published by a eyeonhousing.org . Read the Original article here. .
Pin It